| Param | Original file | Final file |
|---|---|---|
| Filename | modeM0/AS1A10_064T01_9000004144_28890cztM0_level2.evt | modeM0/AS1A10_064T01_9000004144_28890cztM0_level2_quad_clean.evt |
| Size (bytes) | 599,624,640 | 88,698,240 |
| Size | 571.8 MB | 84.6 MB |
| Events in quadrant A | 3,406,383 | 580,305 |
| Events in quadrant B | 3,170,106 | 604,290 |
| Events in quadrant C | 4,098,265 | 558,755 |
| Events in quadrant D | 7,061,105 | 505,000 |
| Mode M0 | |||
|---|---|---|---|
| Quadrant | BADHDUFLAG | Total packets | Discarded packets |
| A | 0 | 14215 | 2 |
| B | 0 | 13312 | 2 |
| C | 0 | 16443 | 2 |
| D | 0 | 25385 | 2 |
| Mode SS | |||
|---|---|---|---|
| Quadrant | BADHDUFLAG | Total packets | Discarded packets |
| A | 0 | 126 | 0 |
| B | 0 | 126 | 0 |
| C | 0 | 126 | 0 |
| D | 0 | 126 | 0 |
| Mode M9 | |||
|---|---|---|---|
| Quadrant | BADHDUFLAG | Total packets | Discarded packets |
| A | 0 | 20 | 0 |
| B | 0 | 21 | 0 |
| C | 0 | 21 | 0 |
| D | 0 | 21 | 0 |
| Quadrant | Total seconds | Saturated seconds | Saturation percentage |
|---|---|---|---|
| A | 6272 | 42 | 0.669643% |
| B | 6272 | 32 | 0.510204% |
| C | 6272 | 114 | 1.817602% |
| D | 6272 | 762 | 12.149235% |
Noise dominated data is calculated using 1-second bins in cleaned event files. If a bin has >2000 counts, and if more than 50% of those come from <1% of pixels, then it is considered to be noise-dominated and hence unusable.
| Quadrant | # 1 sec bins | Bins with >0 counts | Bins with >2000 counts | High rate bins dominated by noise | Noise dominated (total time) | Noise dominated (detector-on time) | Marked lightcurve |
|---|---|---|---|---|---|---|---|
| A | 7502 | 6273 | 17 | 17 | 0.23% | 0.27% | 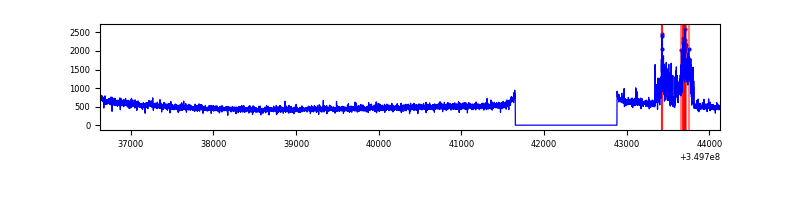 |
| B | 7502 | 6272 | 0 | 0 | 0.00% | 0.00% | 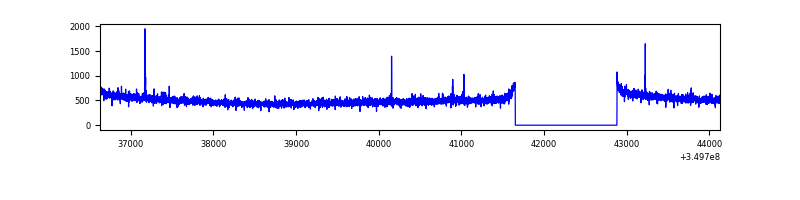 |
| C | 7502 | 6272 | 0 | 0 | 0.00% | 0.00% | 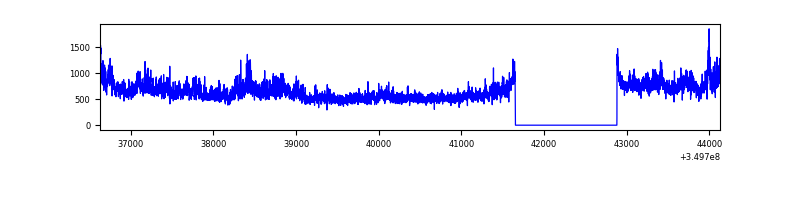 |
| D | 7502 | 6272 | 724 | 724 | 9.65% | 11.54% | 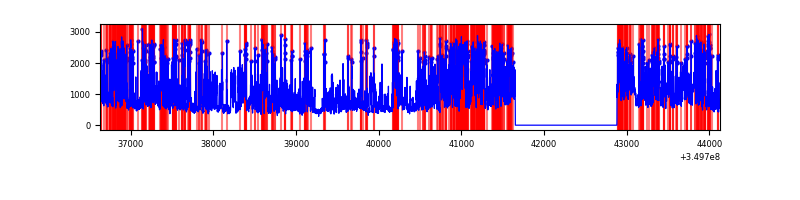 |
Top three noisy pixels from each quadrant. If the there are fewer than three noisy pixels in the level2.evt file, extra rows are filled as -1
| Pixel properties | Quadrant properties | ||||||
|---|---|---|---|---|---|---|---|
| Quadrant | DetID | PixID | Counts | Sigma | Mean | Median | Sigma |
| A | 6 | 16 | 304433 | 1911.27 | 800 | 786 | 158.9 |
| A | 13 | 6 | 18150 | 109.3 | 800 | 786 | 158.9 |
| A | 13 | 254 | 10488 | 61.07 | 800 | 786 | 158.9 |
| B | 12 | 111 | 17811 | 112.35 | 804 | 785 | 151.5 |
| B | 11 | 111 | 16586 | 104.27 | 804 | 785 | 151.5 |
| B | 14 | 111 | 14928 | 93.33 | 804 | 785 | 151.5 |
| C | 3 | 233 | 903142 | 5005.62 | 776 | 783 | 180.3 |
| C | 14 | 238 | 134475 | 741.62 | 776 | 783 | 180.3 |
| C | 2 | 114 | 14792 | 77.71 | 776 | 783 | 180.3 |
| D | 8 | 195 | 2654275 | 14835.81 | 750 | 730 | 178.9 |
| D | 1 | 52 | 1524347 | 8518.45 | 750 | 730 | 178.9 |
| D | 2 | 250 | 30828 | 168.28 | 750 | 730 | 178.9 |
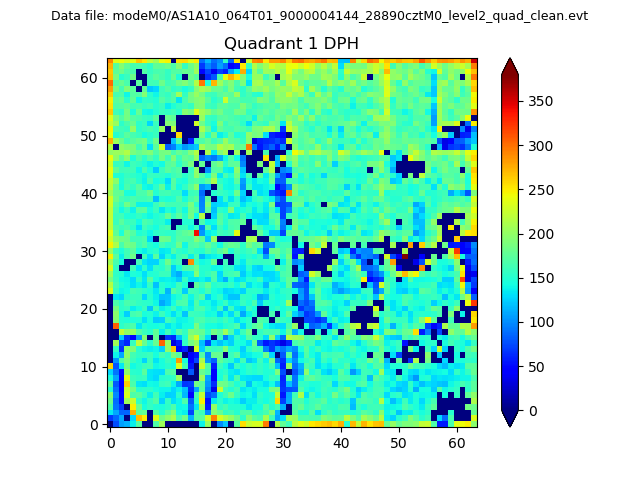
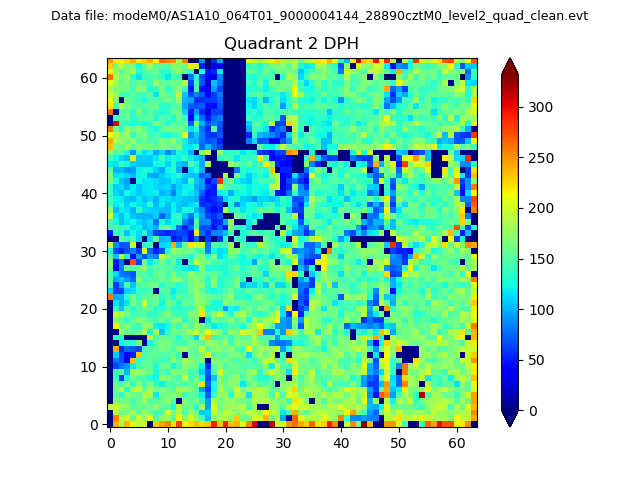
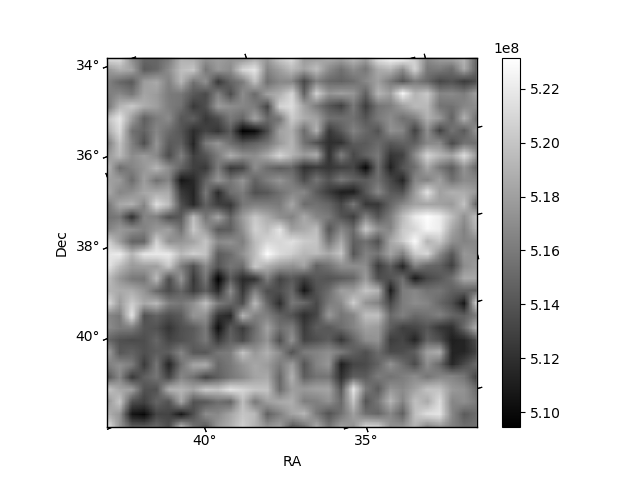
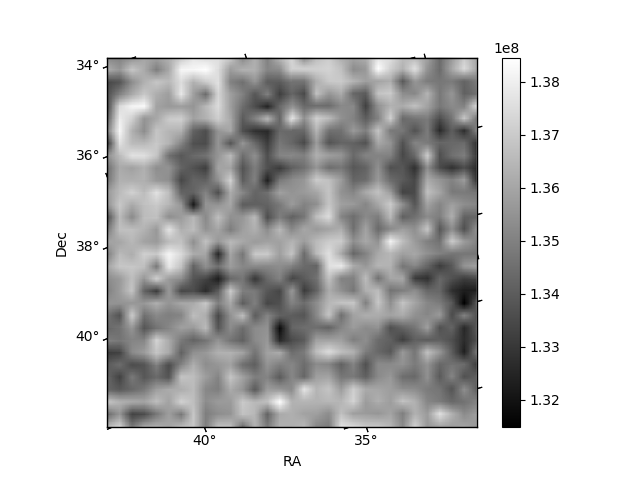
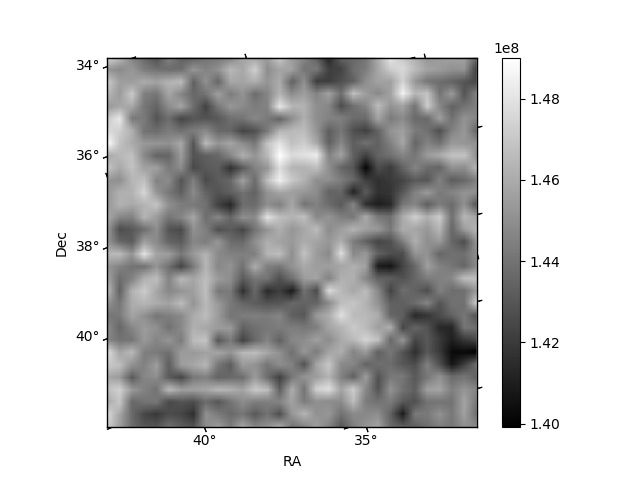
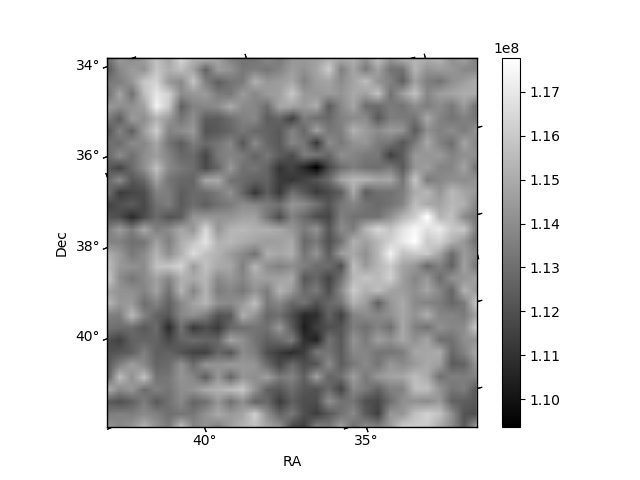
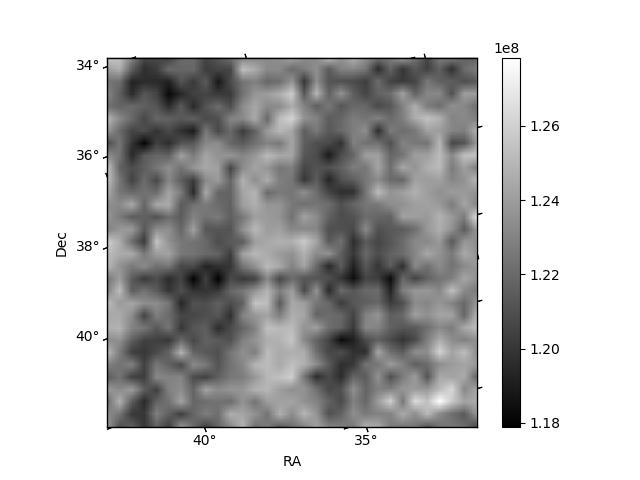
Histogram calculated using DETX and DETY for each event in the final _common_clean file
| Quadrant A |  |
 |
Quadrant B |
|---|---|---|---|
| Quadrant D | 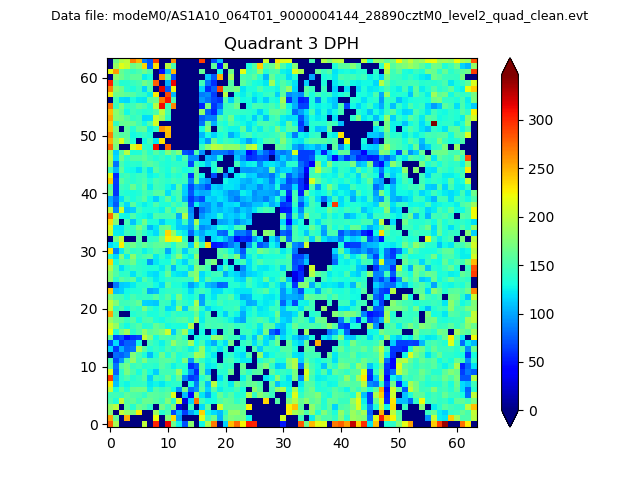 |
 |
Quadrant C |
| Plot type | Count rate plots | Images |
|---|---|---|
| Comparison with Poisson distribution Blue bars denote a histogram of data divided into 1 sec bins. Red curve is a Poisson curve with rate = median count rate of data. |
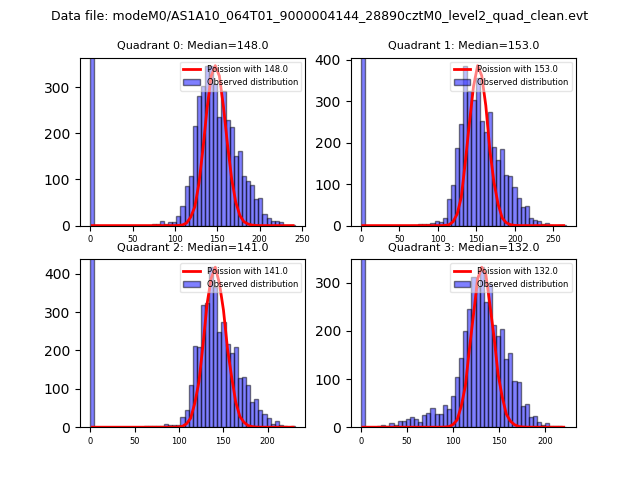 |
 |
| Quadrant-wise count rates Data is divided into 100 sec bins |
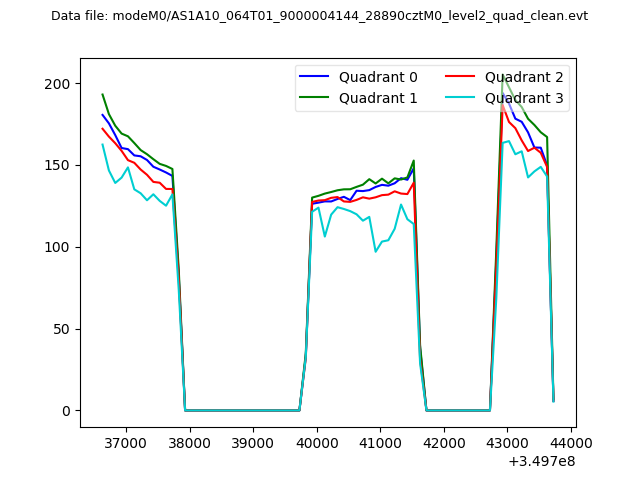 |
|
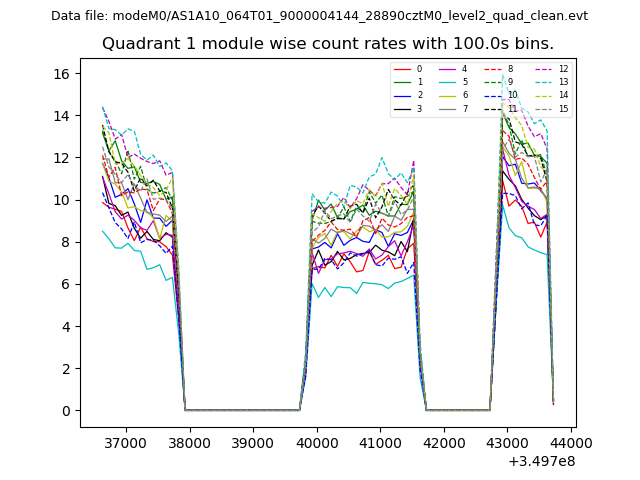
| Module-wise count rates for Quadrant A Data is divided into 100 sec bins |
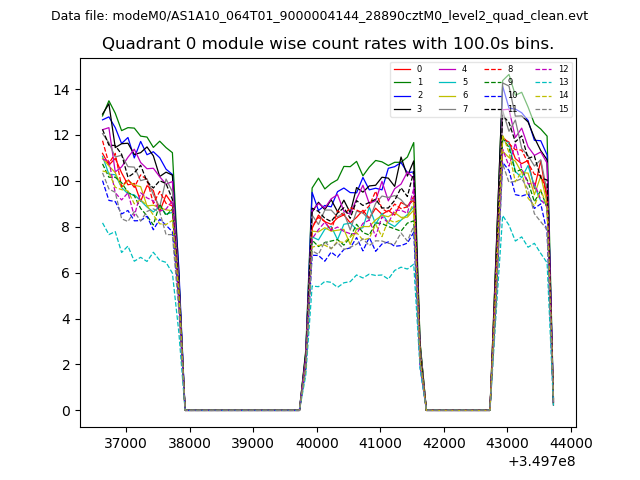 |
 |
| Module-wise count rates for Quadrant B Data is divided into 100 sec bins |
 |
 |
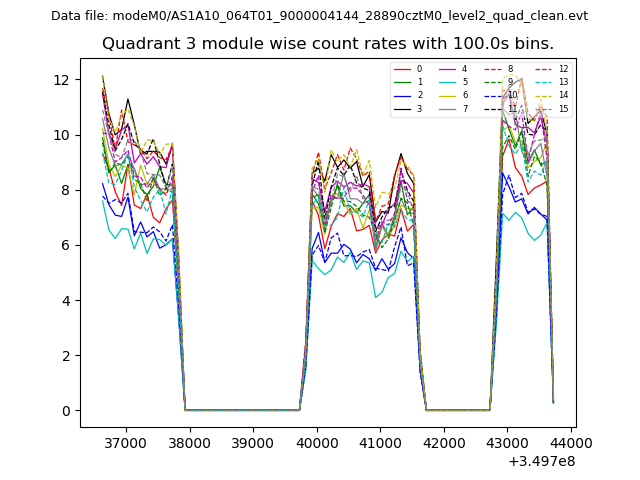
| Module-wise count rates for Quadrant C Data is divided into 100 sec bins |
 |
 |
| Module-wise count rates for Quadrant D Data is divided into 100 sec bins |
 |
 |
| Parameter | Plot |
|---|---|
| CZT HV Monitor |  |
| D_VDD | 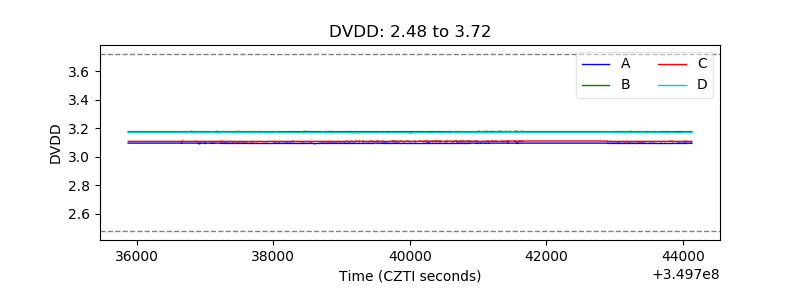 |
| Temperature 1 | 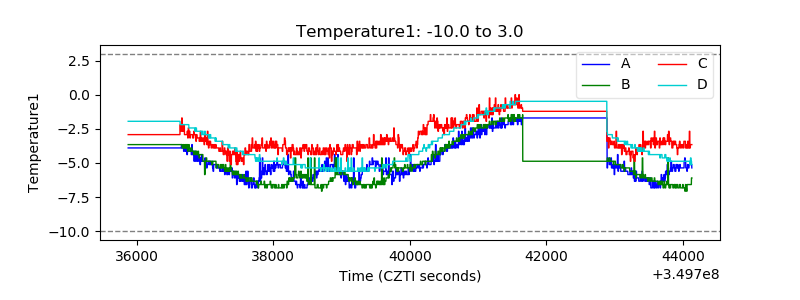 |
| Veto HV Monitor | 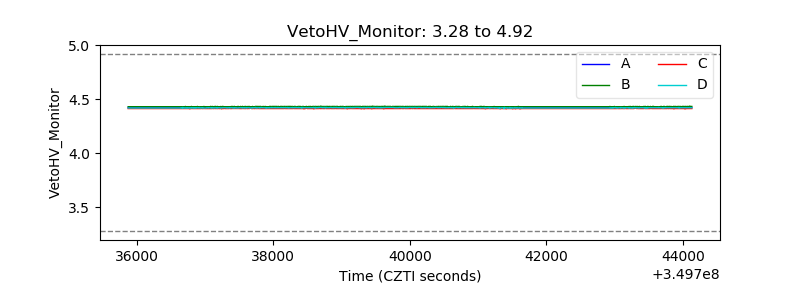 |
| Veto LLD | 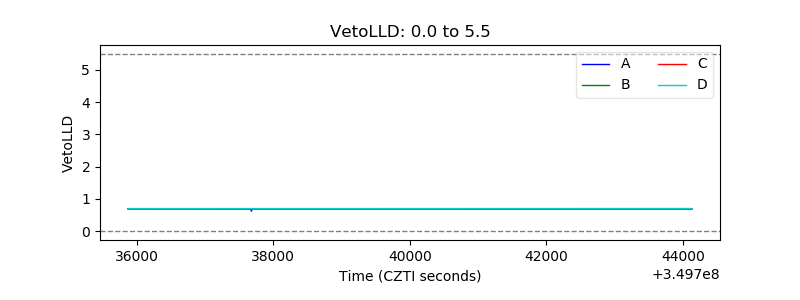 |
| Alpha Counter | 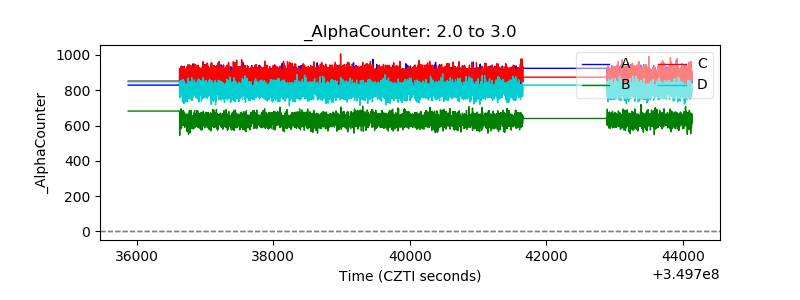 |
| _CPM_Rate | 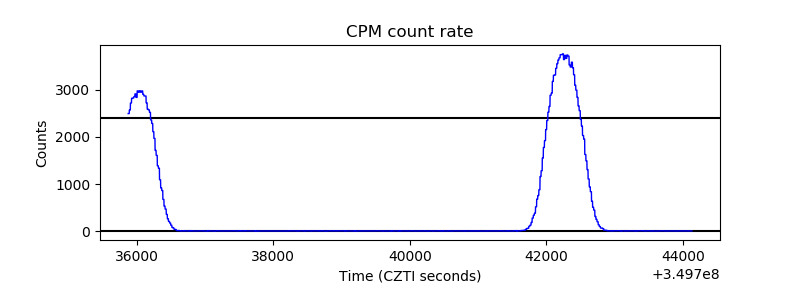 |
| CZT Counter | 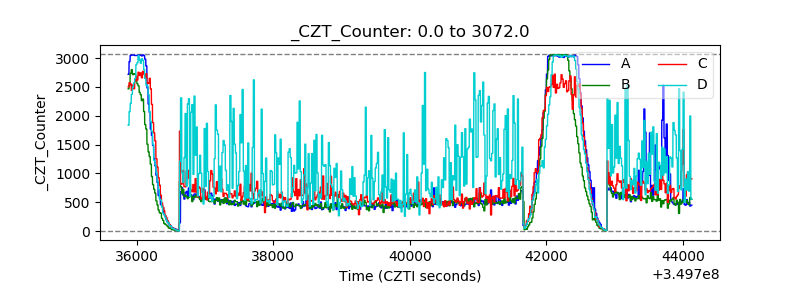 |
| +2.5 Volts monitor |  |
| +5 Volts monitor |  |
| _ROLL_ROT | 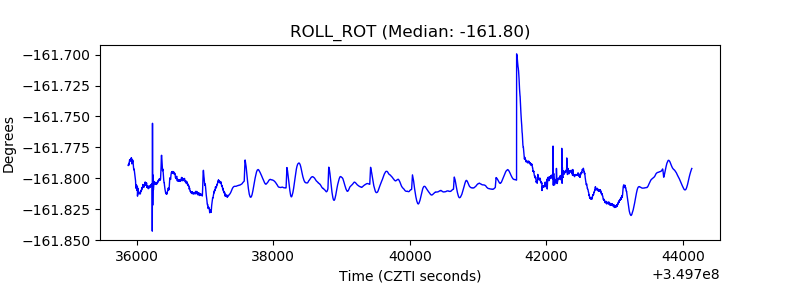 |
| _Roll_DEC | 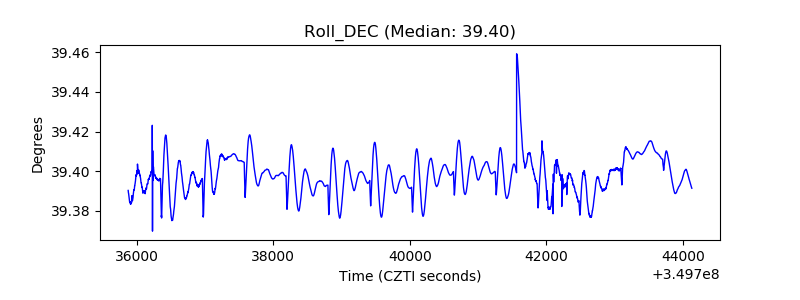 |
| _Roll_RA | 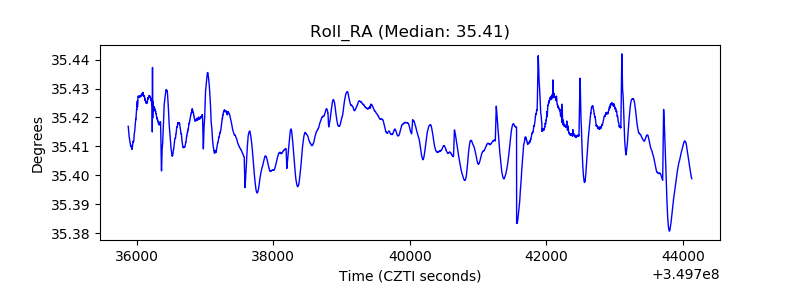 |
| Veto Counter | 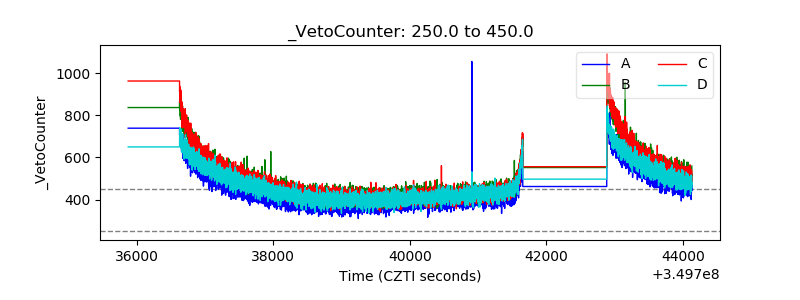 |