| Param | Original file | Final file |
|---|---|---|
| Filename | modeM0/AS1A10_064T01_9000004144_28891cztM0_level2.evt | modeM0/AS1A10_064T01_9000004144_28891cztM0_level2_quad_clean.evt |
| Size (bytes) | 720,803,520 | 81,043,200 |
| Size | 687.4 MB | 77.3 MB |
| Events in quadrant A | 3,772,883 | 518,601 |
| Events in quadrant B | 3,430,014 | 539,563 |
| Events in quadrant C | 6,545,414 | 482,283 |
| Events in quadrant D | 7,644,335 | 460,693 |
| Mode M0 | |||
|---|---|---|---|
| Quadrant | BADHDUFLAG | Total packets | Discarded packets |
| A | 0 | 15225 | 2 |
| B | 0 | 14111 | 2 |
| C | 0 | 24085 | 2 |
| D | 0 | 27303 | 2 |
| Mode SS | |||
|---|---|---|---|
| Quadrant | BADHDUFLAG | Total packets | Discarded packets |
| A | 0 | 132 | 0 |
| B | 0 | 132 | 0 |
| C | 0 | 132 | 0 |
| D | 0 | 132 | 0 |
| Mode M9 | |||
|---|---|---|---|
| Quadrant | BADHDUFLAG | Total packets | Discarded packets |
| A | 0 | 16 | 0 |
| B | 0 | 17 | 0 |
| C | 0 | 17 | 0 |
| D | 0 | 17 | 0 |
| Quadrant | Total seconds | Saturated seconds | Saturation percentage |
|---|---|---|---|
| A | 6488 | 41 | 0.631936% |
| B | 6488 | 27 | 0.416153% |
| C | 6488 | 560 | 8.631319% |
| D | 6488 | 489 | 7.536991% |
Noise dominated data is calculated using 1-second bins in cleaned event files. If a bin has >2000 counts, and if more than 50% of those come from <1% of pixels, then it is considered to be noise-dominated and hence unusable.
| Quadrant | # 1 sec bins | Bins with >0 counts | Bins with >2000 counts | High rate bins dominated by noise | Noise dominated (total time) | Noise dominated (detector-on time) | Marked lightcurve |
|---|---|---|---|---|---|---|---|
| A | 7818 | 6489 | 17 | 17 | 0.22% | 0.26% | 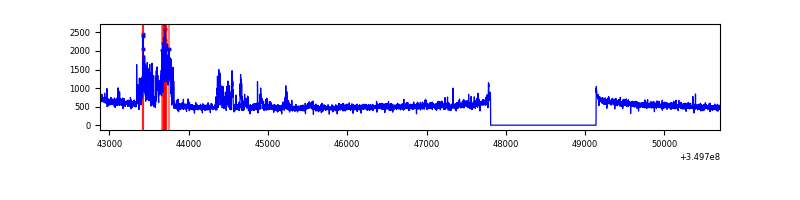 |
| B | 7818 | 6489 | 4 | 4 | 0.05% | 0.06% | 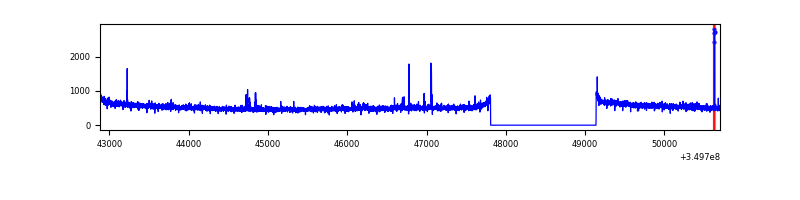 |
| C | 7818 | 6488 | 197 | 197 | 2.52% | 3.04% | 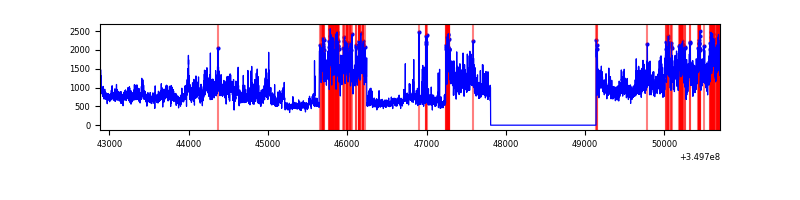 |
| D | 7818 | 6488 | 515 | 515 | 6.59% | 7.94% | 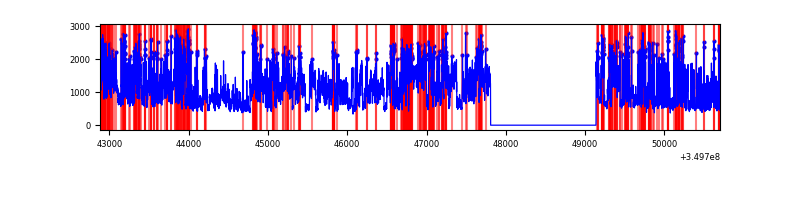 |
Top three noisy pixels from each quadrant. If the there are fewer than three noisy pixels in the level2.evt file, extra rows are filled as -1
| Pixel properties | Quadrant properties | ||||||
|---|---|---|---|---|---|---|---|
| Quadrant | DetID | PixID | Counts | Sigma | Mean | Median | Sigma |
| A | 6 | 16 | 479079 | 2815.14 | 854 | 840 | 169.9 |
| A | 13 | 254 | 10341 | 55.93 | 854 | 840 | 169.9 |
| A | 3 | 137 | 7750 | 40.68 | 854 | 840 | 169.9 |
| B | 10 | 245 | 57182 | 350.16 | 860 | 841 | 160.9 |
| B | 12 | 111 | 18889 | 112.17 | 860 | 841 | 160.9 |
| B | 11 | 111 | 17314 | 102.38 | 860 | 841 | 160.9 |
| C | 3 | 233 | 3135790 | 16773.27 | 813 | 821 | 186.9 |
| C | 14 | 238 | 149400 | 794.95 | 813 | 821 | 186.9 |
| C | 15 | 208 | 46038 | 241.93 | 813 | 821 | 186.9 |
| D | 8 | 195 | 3585946 | 18652.48 | 807 | 785 | 192.2 |
| D | 1 | 52 | 974878 | 5067.9 | 807 | 785 | 192.2 |
| D | 2 | 234 | 23676 | 119.09 | 807 | 785 | 192.2 |
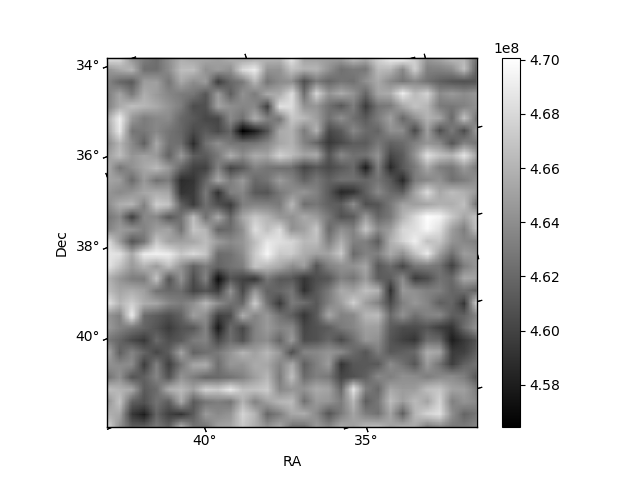
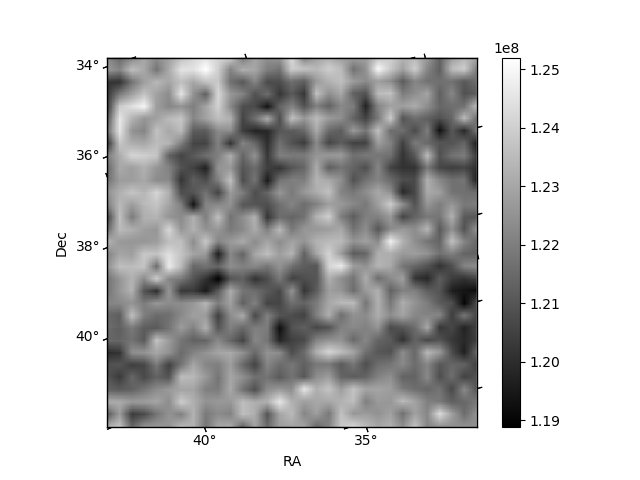
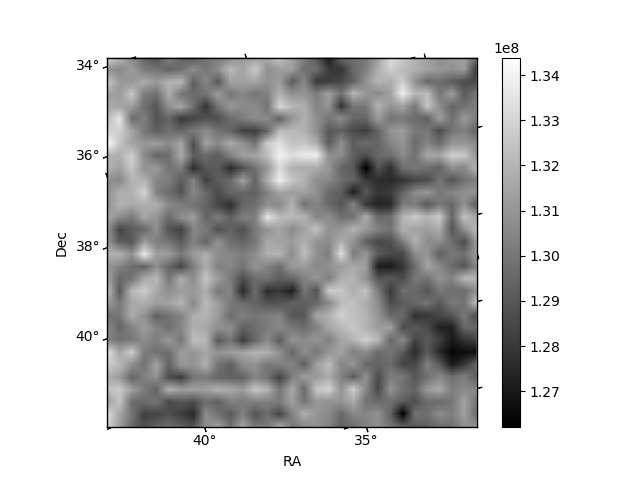
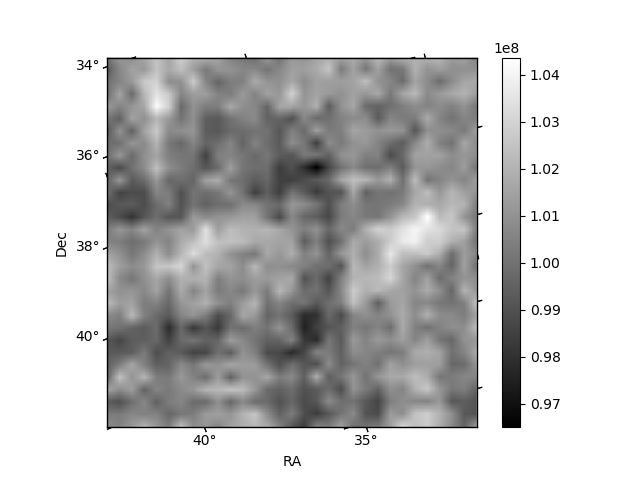
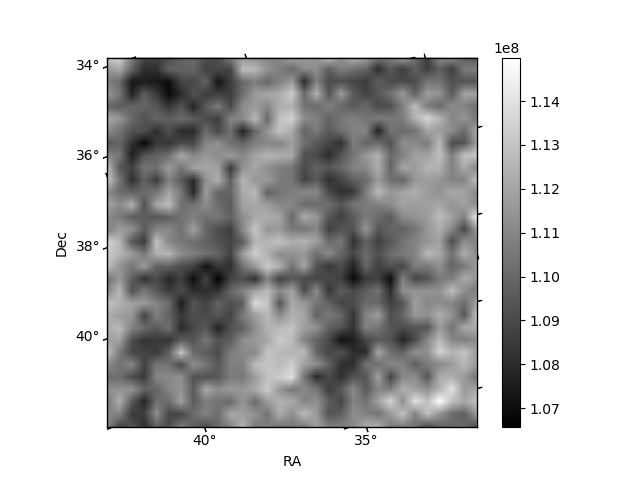
Histogram calculated using DETX and DETY for each event in the final _common_clean file
| Quadrant A | 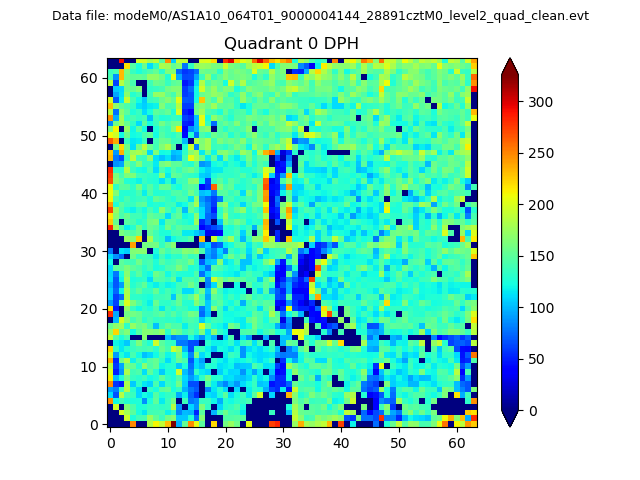 |
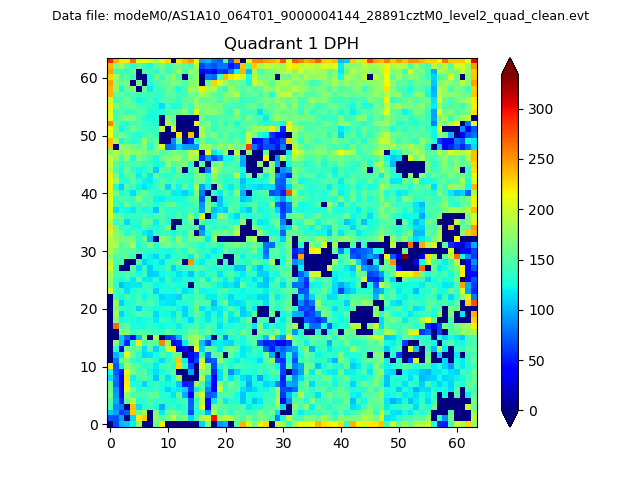 |
Quadrant B |
|---|---|---|---|
| Quadrant D | 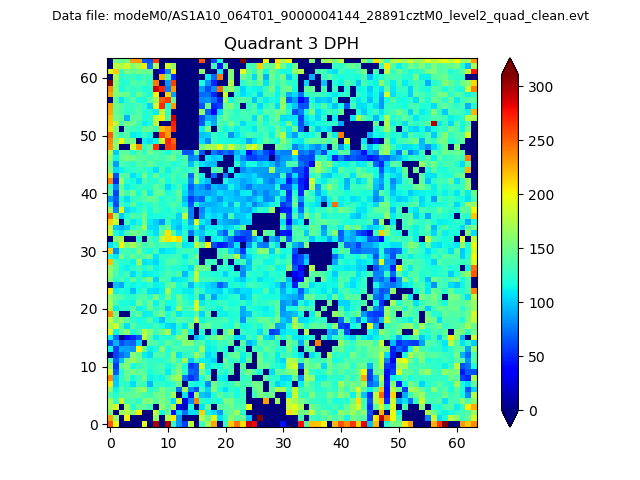 |
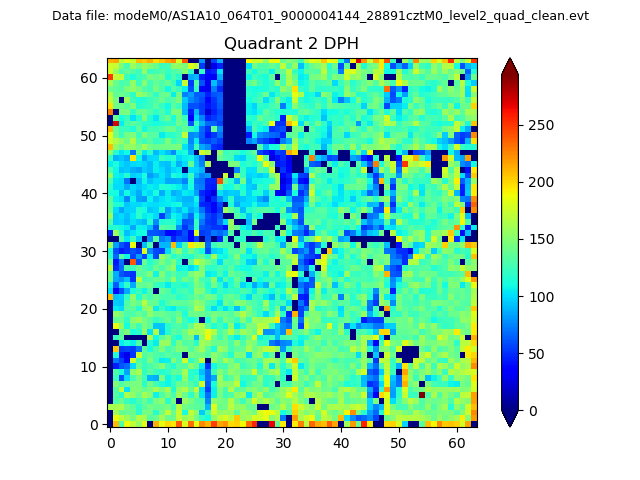 |
Quadrant C |
| Plot type | Count rate plots | Images |
|---|---|---|
| Comparison with Poisson distribution Blue bars denote a histogram of data divided into 1 sec bins. Red curve is a Poisson curve with rate = median count rate of data. |
 |
 |
| Quadrant-wise count rates Data is divided into 100 sec bins |
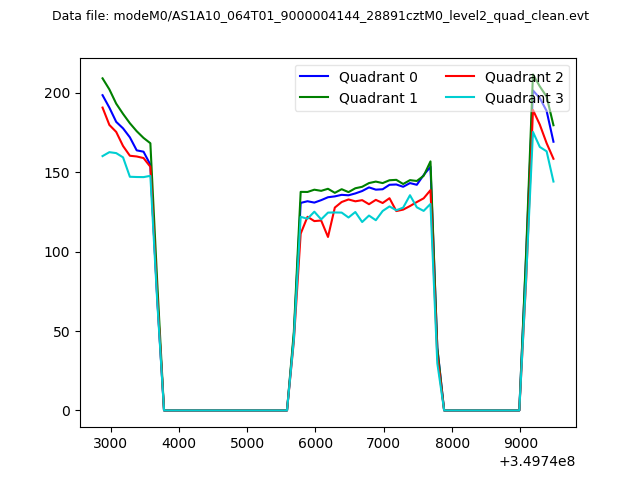 |
|
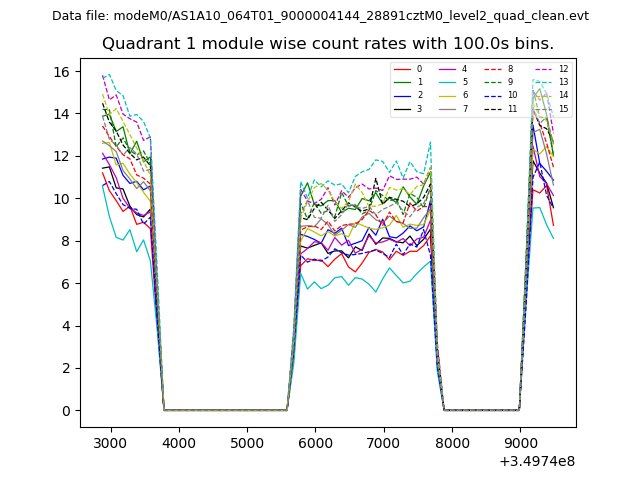
| Module-wise count rates for Quadrant A Data is divided into 100 sec bins |
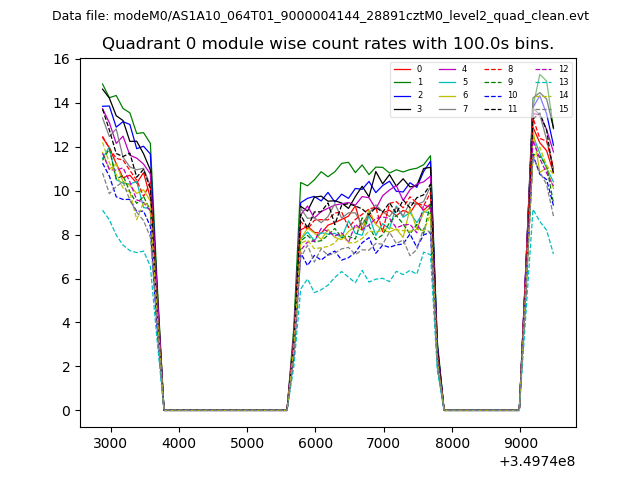 |
 |
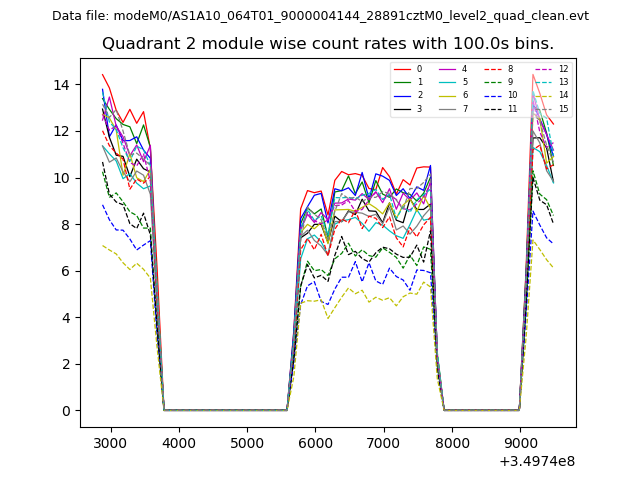
| Module-wise count rates for Quadrant B Data is divided into 100 sec bins |
 |
 |
| Module-wise count rates for Quadrant C Data is divided into 100 sec bins |
 |
 |
| Module-wise count rates for Quadrant D Data is divided into 100 sec bins |
 |
 |
| Parameter | Plot |
|---|---|
| CZT HV Monitor | 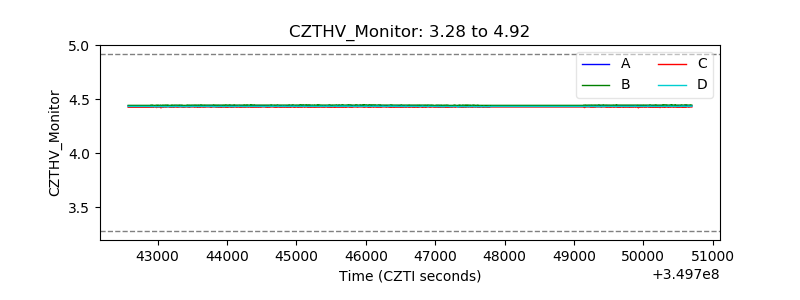 |
| D_VDD | 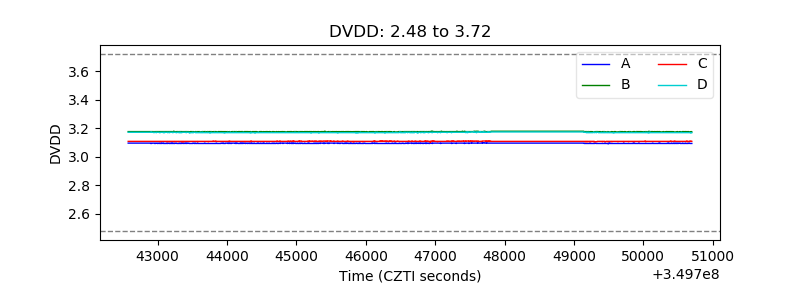 |
| Temperature 1 | 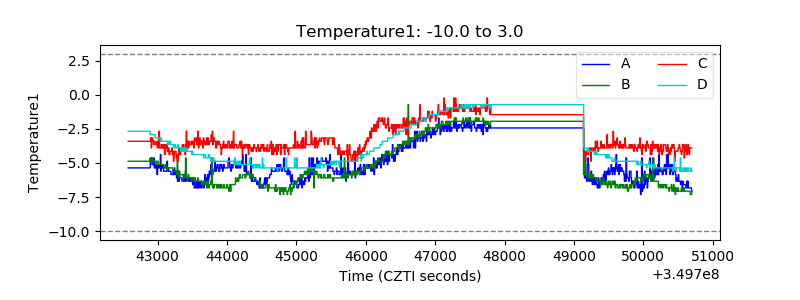 |
| Veto HV Monitor | 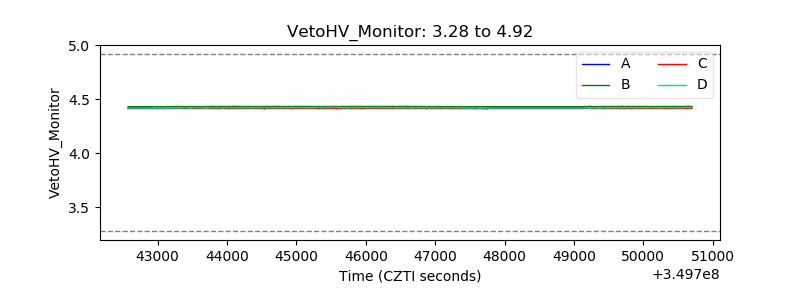 |
| Veto LLD | 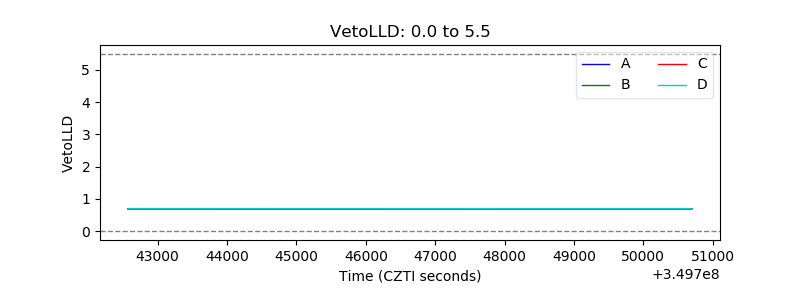 |
| Alpha Counter | 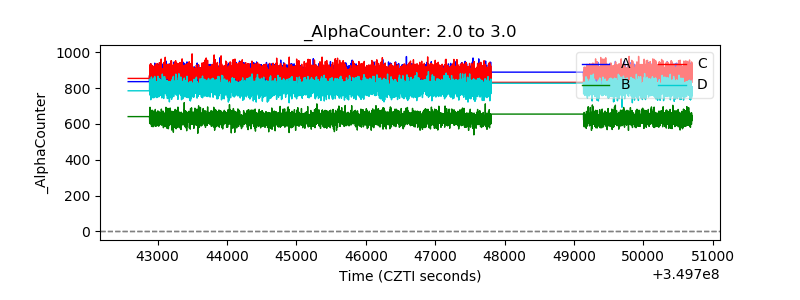 |
| _CPM_Rate | 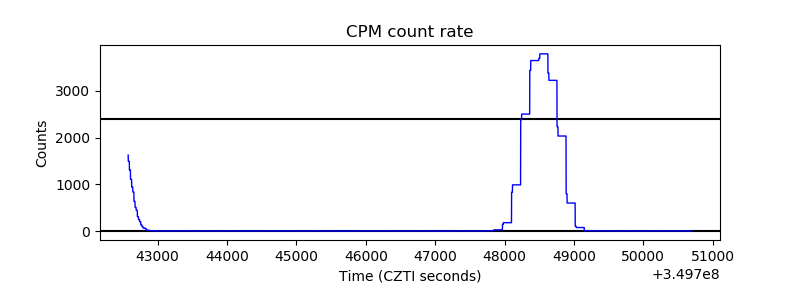 |
| CZT Counter | 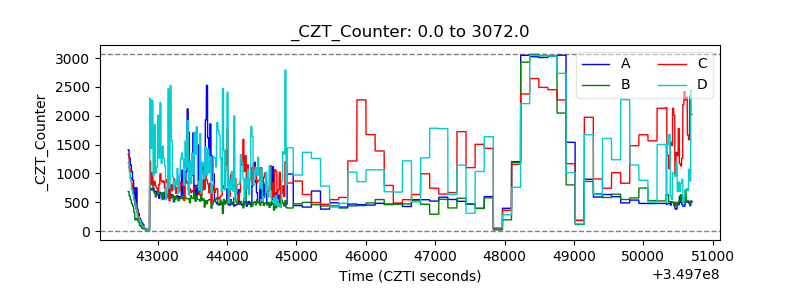 |
| +2.5 Volts monitor |  |
| +5 Volts monitor |  |
| _ROLL_ROT | 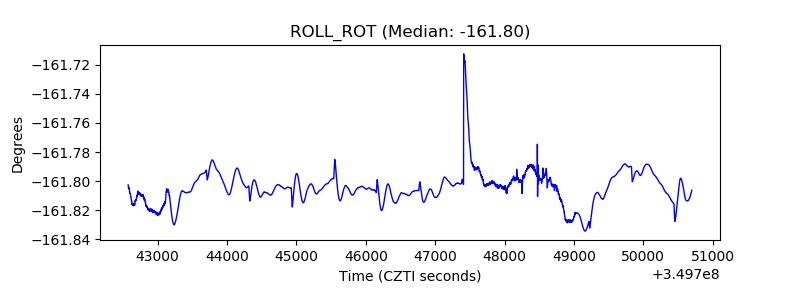 |
| _Roll_DEC | 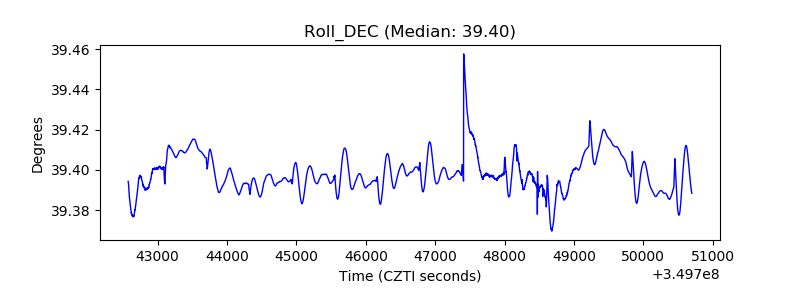 |
| _Roll_RA | 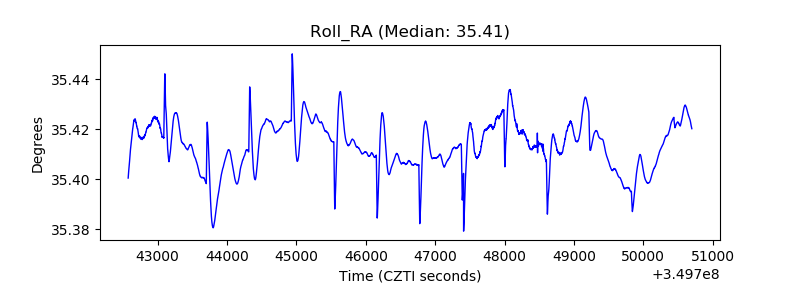 |
| Veto Counter |  |