| Param | Original file | Final file |
|---|---|---|
| Filename | modeM0/AS1A10_064T01_9000004144_28892cztM0_level2.evt | modeM0/AS1A10_064T01_9000004144_28892cztM0_level2_quad_clean.evt |
| Size (bytes) | 727,536,960 | 70,332,480 |
| Size | 693.8 MB | 67.1 MB |
| Events in quadrant A | 3,334,680 | 445,312 |
| Events in quadrant B | 3,443,273 | 459,630 |
| Events in quadrant C | 8,454,207 | 383,842 |
| Events in quadrant D | 6,369,200 | 393,037 |
| Mode M0 | |||
|---|---|---|---|
| Quadrant | BADHDUFLAG | Total packets | Discarded packets |
| A | 0 | 13693 | 2 |
| B | 0 | 14051 | 2 |
| C | 0 | 29686 | 2 |
| D | 0 | 23369 | 3 |
| Mode SS | |||
|---|---|---|---|
| Quadrant | BADHDUFLAG | Total packets | Discarded packets |
| A | 0 | 132 | 0 |
| B | 0 | 132 | 0 |
| C | 0 | 132 | 0 |
| D | 0 | 132 | 0 |
| Mode M9 | |||
|---|---|---|---|
| Quadrant | BADHDUFLAG | Total packets | Discarded packets |
| A | 0 | 15 | 0 |
| B | 0 | 16 | 0 |
| C | 0 | 16 | 0 |
| D | 0 | 16 | 0 |
| Quadrant | Total seconds | Saturated seconds | Saturation percentage |
|---|---|---|---|
| A | 6404 | 36 | 0.562149% |
| B | 6404 | 61 | 0.952530% |
| C | 6404 | 1229 | 19.191131% |
| D | 6403 | 484 | 7.558957% |
Noise dominated data is calculated using 1-second bins in cleaned event files. If a bin has >2000 counts, and if more than 50% of those come from <1% of pixels, then it is considered to be noise-dominated and hence unusable.
| Quadrant | # 1 sec bins | Bins with >0 counts | Bins with >2000 counts | High rate bins dominated by noise | Noise dominated (total time) | Noise dominated (detector-on time) | Marked lightcurve |
|---|---|---|---|---|---|---|---|
| A | 7739 | 6404 | 0 | 0 | 0.00% | 0.00% | 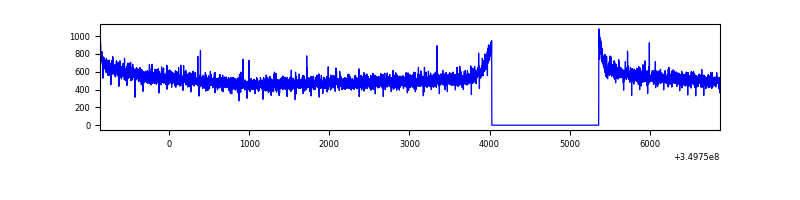 |
| B | 7739 | 6404 | 5 | 5 | 0.06% | 0.08% | 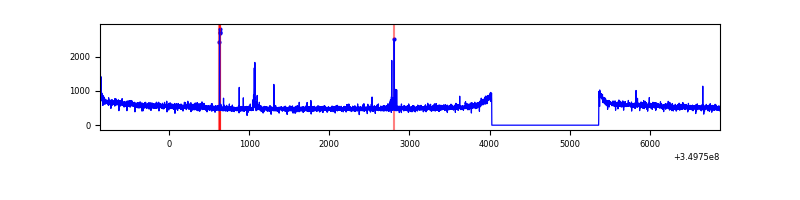 |
| C | 7739 | 6404 | 638 | 638 | 8.24% | 9.96% | 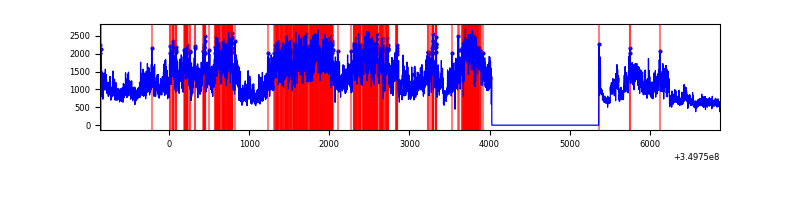 |
| D | 7738 | 6403 | 452 | 452 | 5.84% | 7.06% | 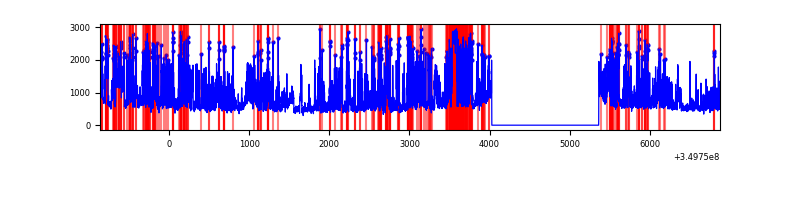 |
Top three noisy pixels from each quadrant. If the there are fewer than three noisy pixels in the level2.evt file, extra rows are filled as -1
| Pixel properties | Quadrant properties | ||||||
|---|---|---|---|---|---|---|---|
| Quadrant | DetID | PixID | Counts | Sigma | Mean | Median | Sigma |
| A | 13 | 254 | 9812 | 52.81 | 862 | 849 | 169.7 |
| A | 3 | 137 | 7690 | 40.31 | 862 | 849 | 169.7 |
| A | 0 | 226 | 7213 | 37.5 | 862 | 849 | 169.7 |
| B | 10 | 245 | 37404 | 227.74 | 867 | 848 | 160.5 |
| B | 12 | 111 | 19074 | 113.55 | 867 | 848 | 160.5 |
| B | 11 | 111 | 17493 | 103.7 | 867 | 848 | 160.5 |
| C | 3 | 233 | 5163680 | 28354.69 | 794 | 802 | 182.1 |
| C | 14 | 238 | 139936 | 764.13 | 794 | 802 | 182.1 |
| C | 2 | 16 | 25068 | 133.27 | 794 | 802 | 182.1 |
| D | 8 | 195 | 2606800 | 13741.17 | 808 | 788 | 189.6 |
| D | 1 | 52 | 694422 | 3657.44 | 808 | 788 | 189.6 |
| D | 2 | 234 | 22019 | 111.95 | 808 | 788 | 189.6 |
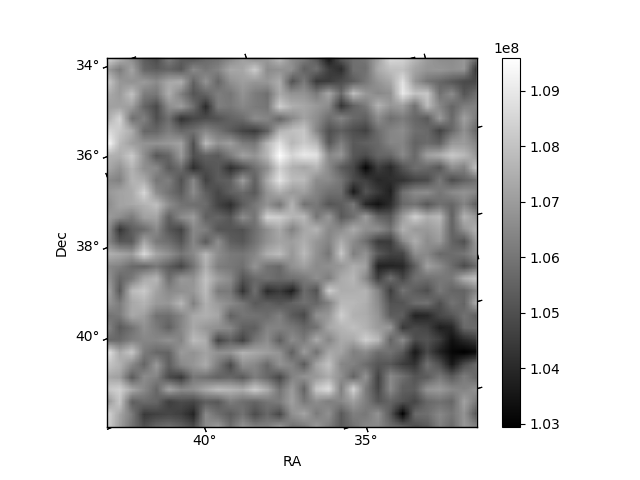
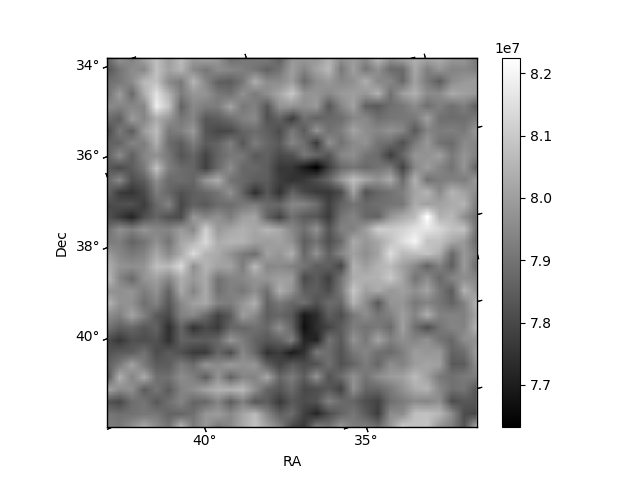
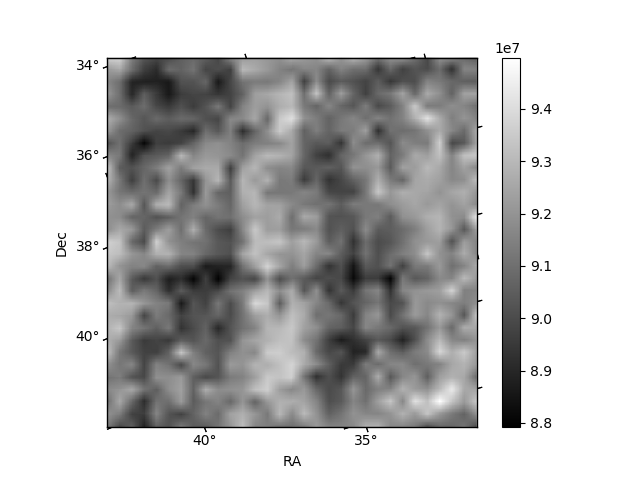
Histogram calculated using DETX and DETY for each event in the final _common_clean file
| Quadrant A | 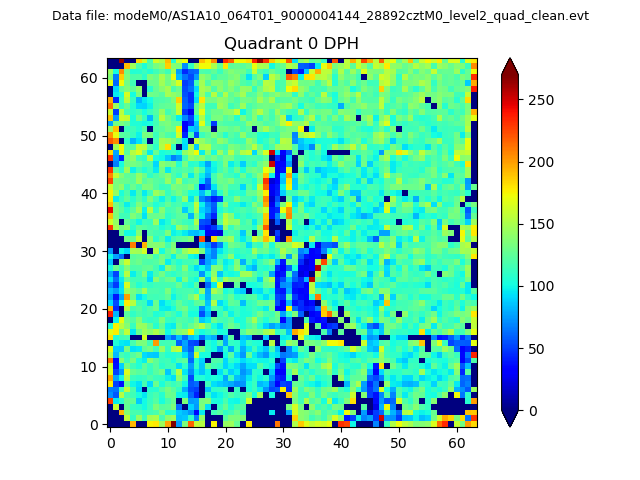 |
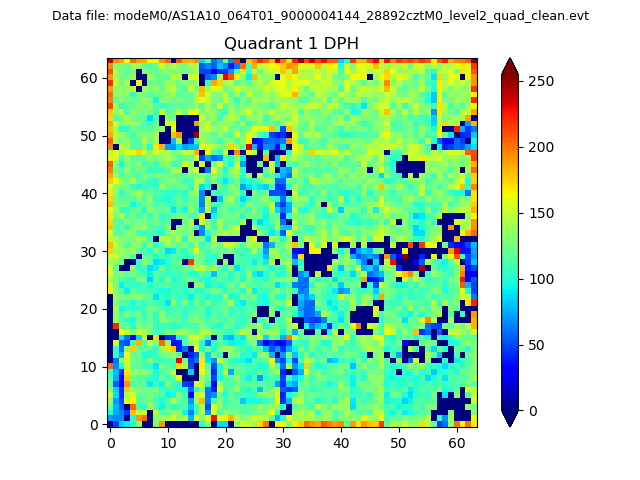 |
Quadrant B |
|---|---|---|---|
| Quadrant D | 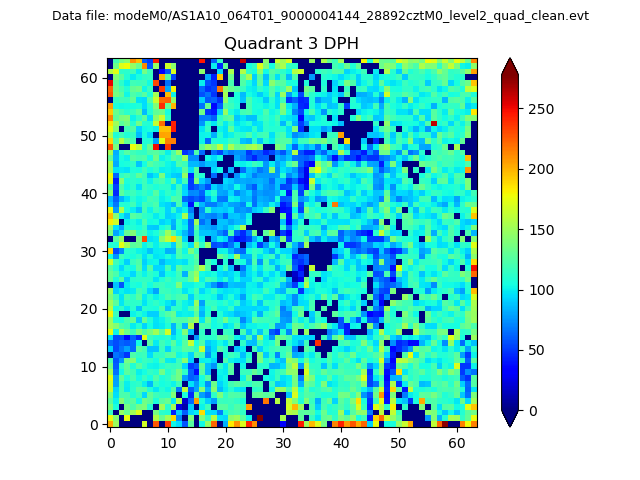 |
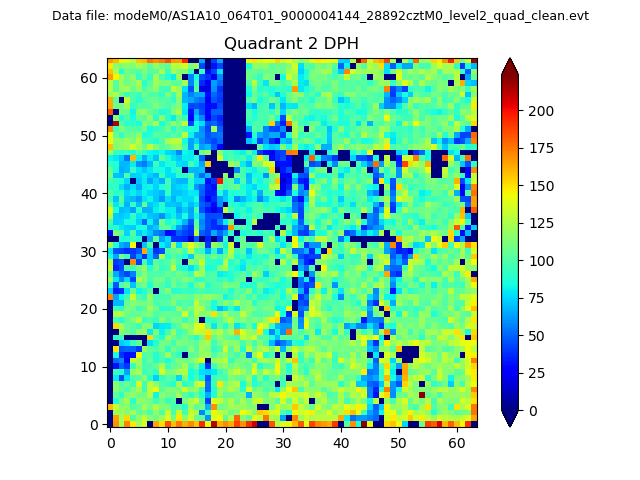 |
Quadrant C |
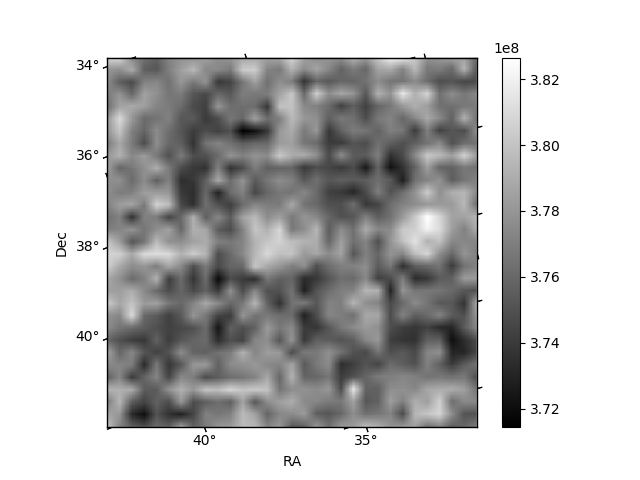
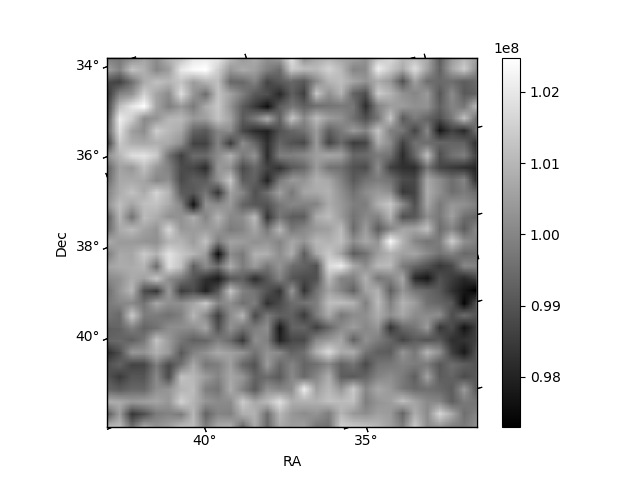
| Plot type | Count rate plots | Images |
|---|---|---|
| Comparison with Poisson distribution Blue bars denote a histogram of data divided into 1 sec bins. Red curve is a Poisson curve with rate = median count rate of data. |
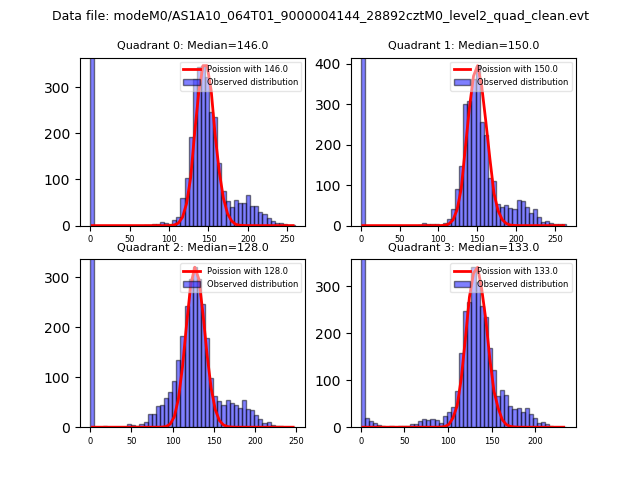 |
 |
| Quadrant-wise count rates Data is divided into 100 sec bins |
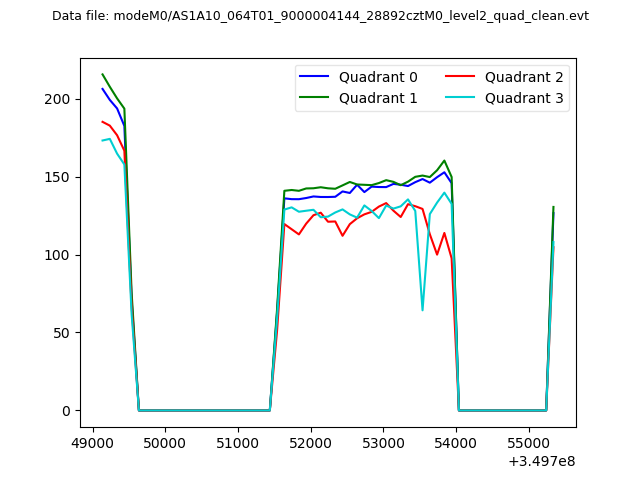 |
|
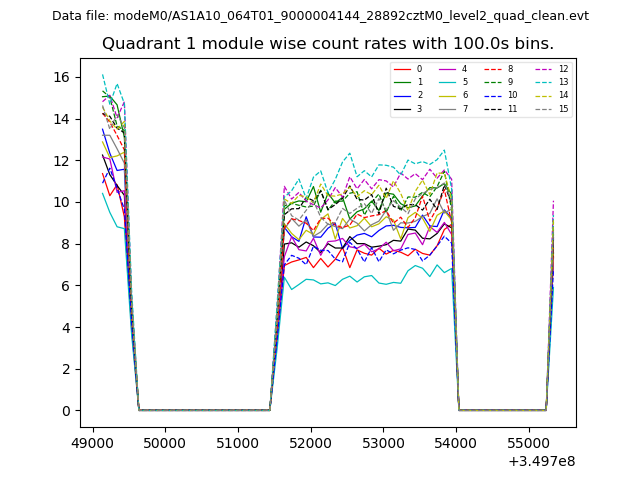
| Module-wise count rates for Quadrant A Data is divided into 100 sec bins |
 |
 |
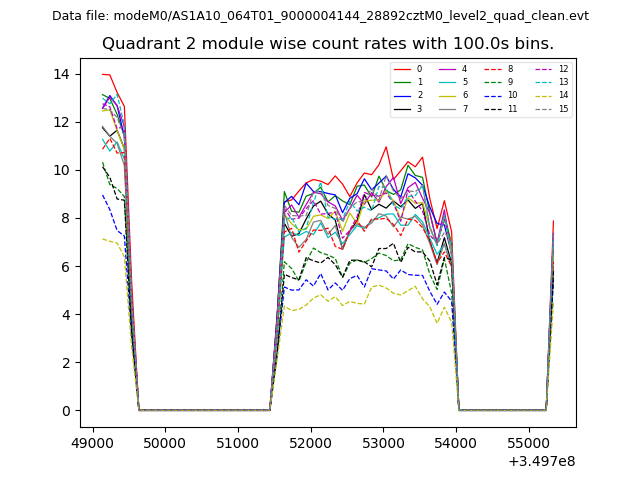
| Module-wise count rates for Quadrant B Data is divided into 100 sec bins |
 |
 |
| Module-wise count rates for Quadrant C Data is divided into 100 sec bins |
 |
 |
| Module-wise count rates for Quadrant D Data is divided into 100 sec bins |
 |
 |
| Parameter | Plot |
|---|---|
| CZT HV Monitor | 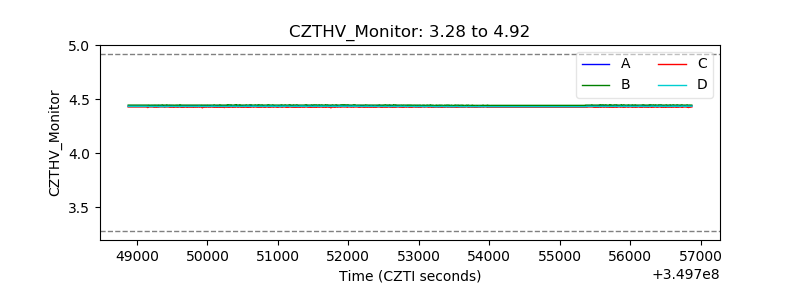 |
| D_VDD | 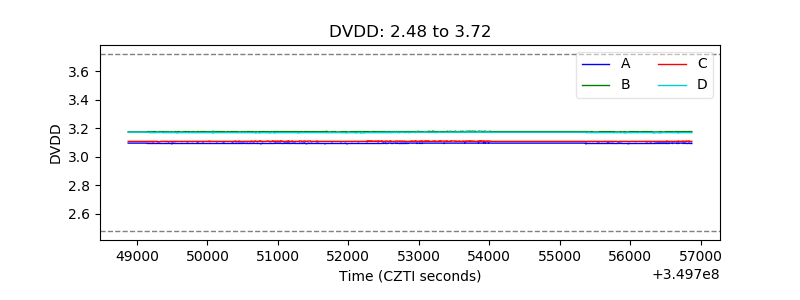 |
| Temperature 1 | 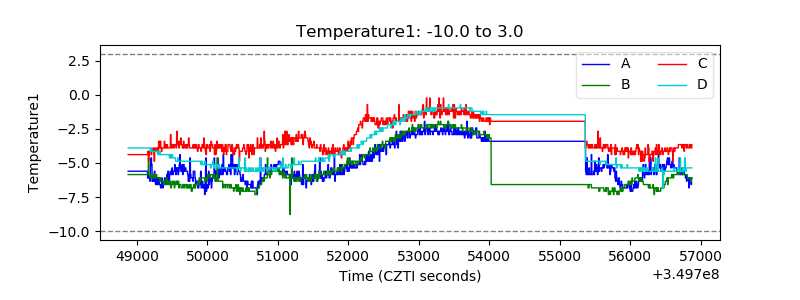 |
| Veto HV Monitor | 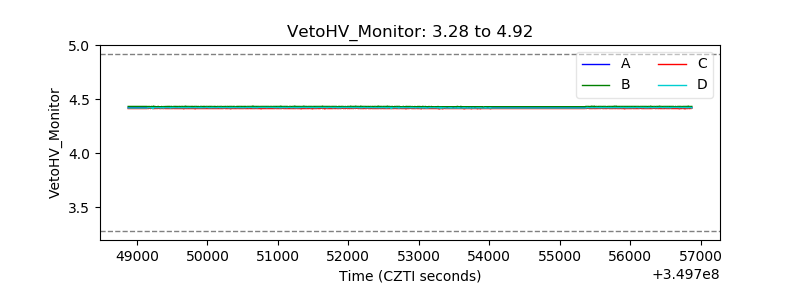 |
| Veto LLD |  |
| Alpha Counter | 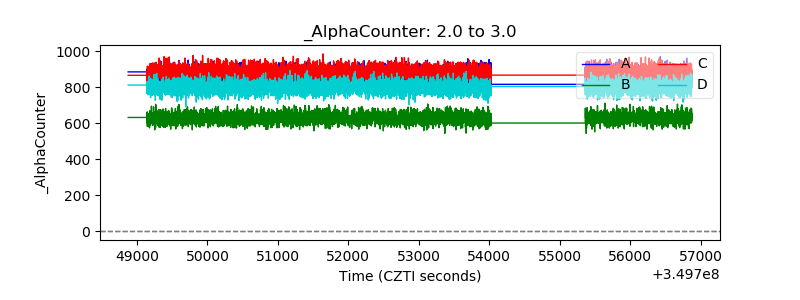 |
| _CPM_Rate | 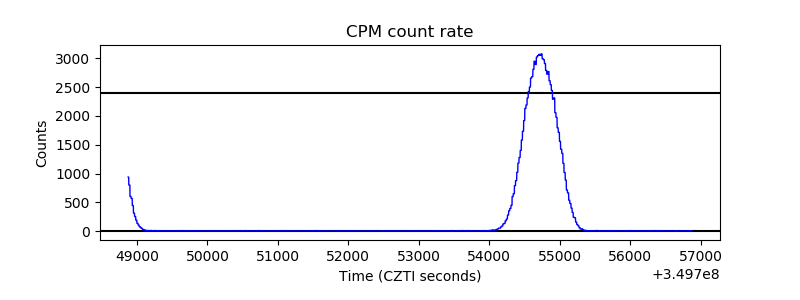 |
| CZT Counter | 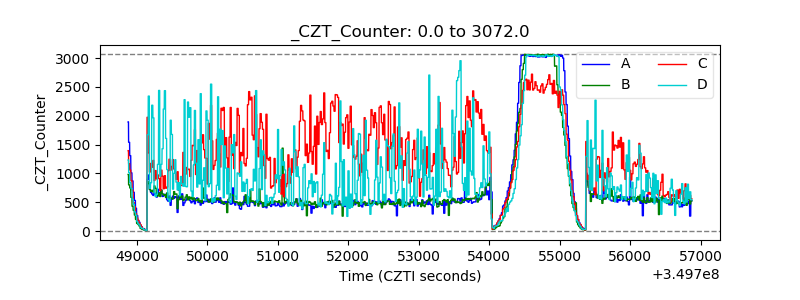 |
| +2.5 Volts monitor |  |
| +5 Volts monitor |  |
| _ROLL_ROT | 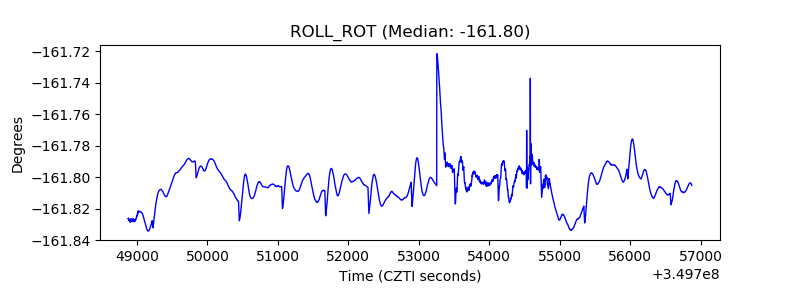 |
| _Roll_DEC | 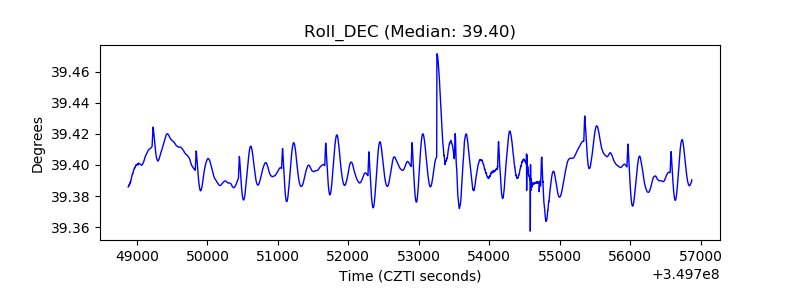 |
| _Roll_RA | 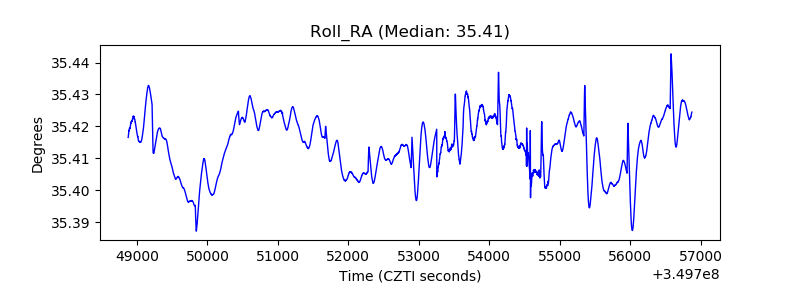 |
| Veto Counter |  |