| Param | Original file | Final file |
|---|---|---|
| Filename | modeM0/AS1A10_064T01_9000004144_28893cztM0_level2.evt | modeM0/AS1A10_064T01_9000004144_28893cztM0_level2_quad_clean.evt |
| Size (bytes) | 568,405,440 | 65,021,760 |
| Size | 542.1 MB | 62.0 MB |
| Events in quadrant A | 3,000,971 | 413,669 |
| Events in quadrant B | 3,135,130 | 420,514 |
| Events in quadrant C | 4,503,679 | 381,533 |
| Events in quadrant D | 6,174,022 | 339,376 |
| Mode M0 | |||
|---|---|---|---|
| Quadrant | BADHDUFLAG | Total packets | Discarded packets |
| A | 0 | 12307 | 1 |
| B | 0 | 12759 | 2 |
| C | 0 | 17554 | 1 |
| D | 0 | 22300 | 1 |
| Mode SS | |||
|---|---|---|---|
| Quadrant | BADHDUFLAG | Total packets | Discarded packets |
| A | 0 | 120 | 0 |
| B | 0 | 120 | 0 |
| C | 0 | 120 | 0 |
| D | 0 | 120 | 0 |
| Mode M9 | |||
|---|---|---|---|
| Quadrant | BADHDUFLAG | Total packets | Discarded packets |
| A | 0 | 13 | 0 |
| B | 0 | 13 | 0 |
| C | 0 | 13 | 0 |
| D | 0 | 13 | 0 |
| Quadrant | Total seconds | Saturated seconds | Saturation percentage |
|---|---|---|---|
| A | 5915 | 33 | 0.557904% |
| B | 5915 | 85 | 1.437025% |
| C | 5915 | 396 | 6.694844% |
| D | 5915 | 843 | 14.251902% |
Noise dominated data is calculated using 1-second bins in cleaned event files. If a bin has >2000 counts, and if more than 50% of those come from <1% of pixels, then it is considered to be noise-dominated and hence unusable.
| Quadrant | # 1 sec bins | Bins with >0 counts | Bins with >2000 counts | High rate bins dominated by noise | Noise dominated (total time) | Noise dominated (detector-on time) | Marked lightcurve |
|---|---|---|---|---|---|---|---|
| A | 7225 | 5915 | 0 | 0 | 0.00% | 0.00% | 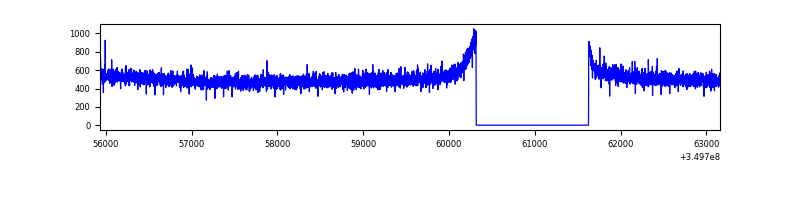 |
| B | 7225 | 5915 | 11 | 11 | 0.15% | 0.19% | 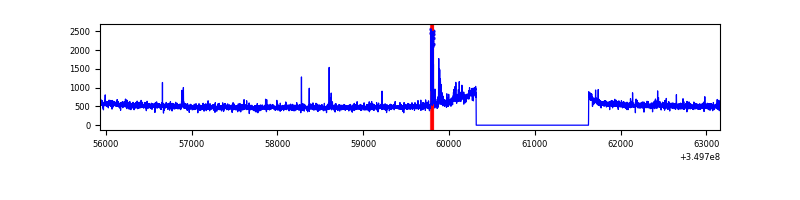 |
| C | 7225 | 5915 | 1 | 1 | 0.01% | 0.02% | 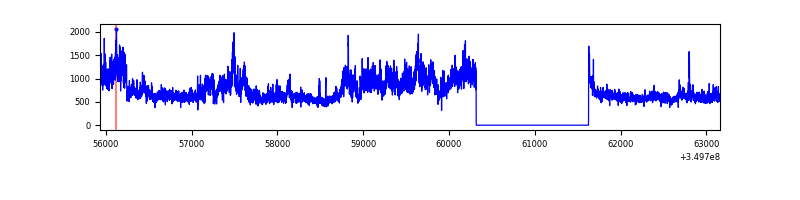 |
| D | 7225 | 5915 | 739 | 739 | 10.23% | 12.49% | 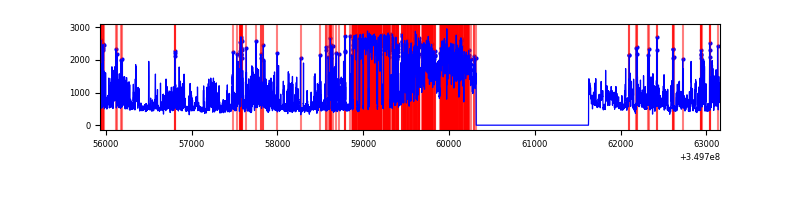 |
Top three noisy pixels from each quadrant. If the there are fewer than three noisy pixels in the level2.evt file, extra rows are filled as -1
| Pixel properties | Quadrant properties | ||||||
|---|---|---|---|---|---|---|---|
| Quadrant | DetID | PixID | Counts | Sigma | Mean | Median | Sigma |
| A | 13 | 254 | 9319 | 55.36 | 776 | 765 | 154.5 |
| A | 3 | 137 | 7058 | 40.73 | 776 | 765 | 154.5 |
| A | 0 | 226 | 6464 | 36.88 | 776 | 765 | 154.5 |
| B | 10 | 245 | 59327 | 404.69 | 773 | 756 | 144.7 |
| B | 15 | 33 | 46272 | 314.49 | 773 | 756 | 144.7 |
| B | 12 | 111 | 17454 | 115.37 | 773 | 756 | 144.7 |
| C | 3 | 233 | 1389004 | 8334.76 | 724 | 730 | 166.6 |
| C | 14 | 238 | 181414 | 1084.77 | 724 | 730 | 166.6 |
| C | 14 | 254 | 92418 | 550.47 | 724 | 730 | 166.6 |
| D | 8 | 195 | 2459754 | 14735.51 | 706 | 688 | 166.9 |
| D | 1 | 52 | 955589 | 5722.07 | 706 | 688 | 166.9 |
| D | 13 | 104 | 95320 | 567.07 | 706 | 688 | 166.9 |
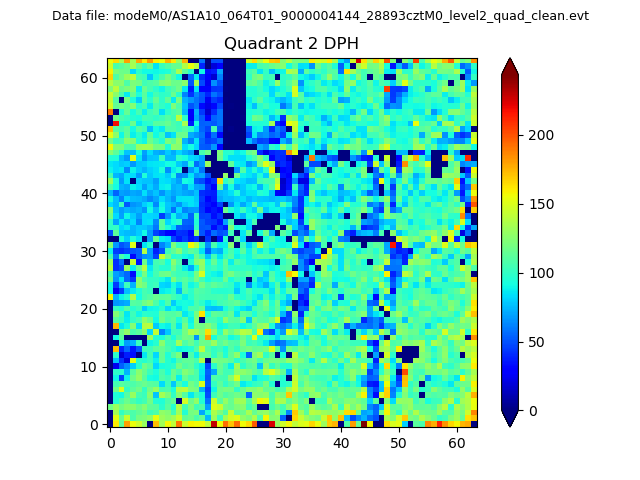
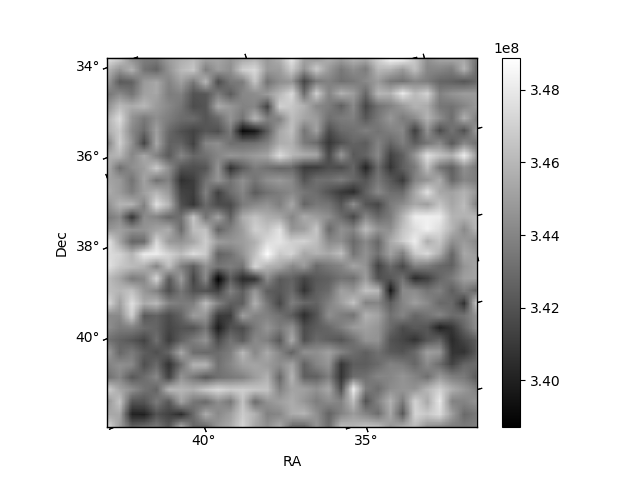
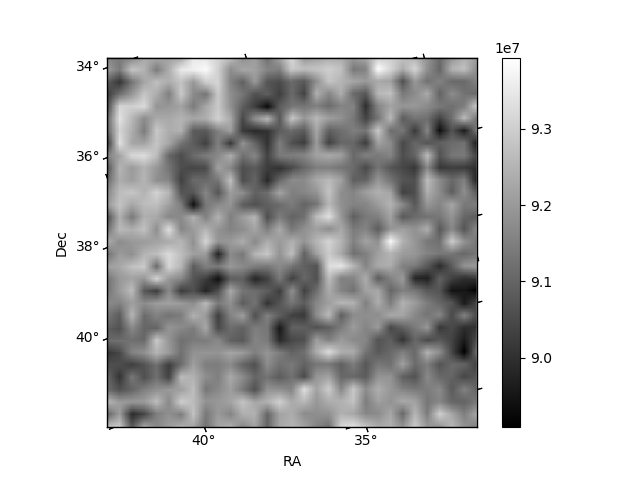
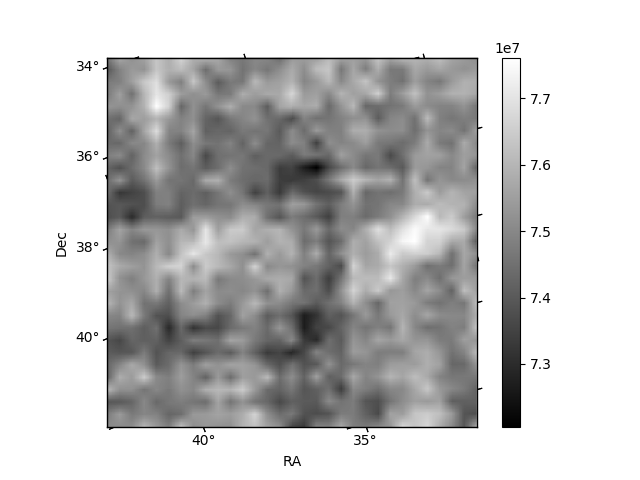
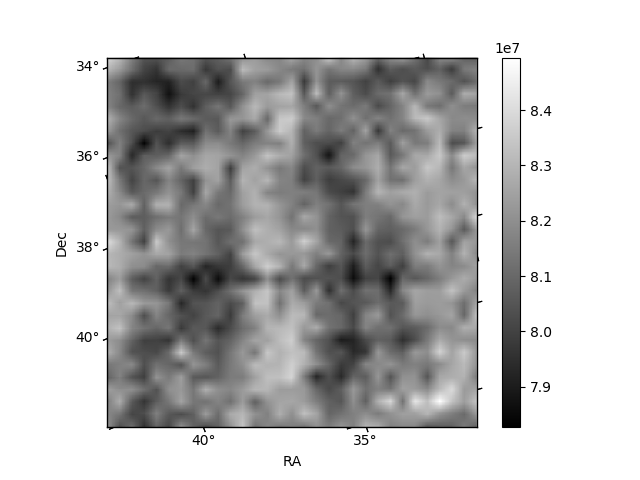
Histogram calculated using DETX and DETY for each event in the final _common_clean file
| Quadrant A | 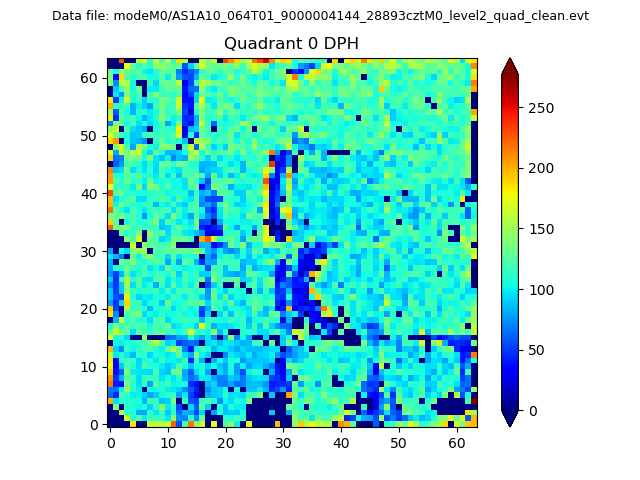 |
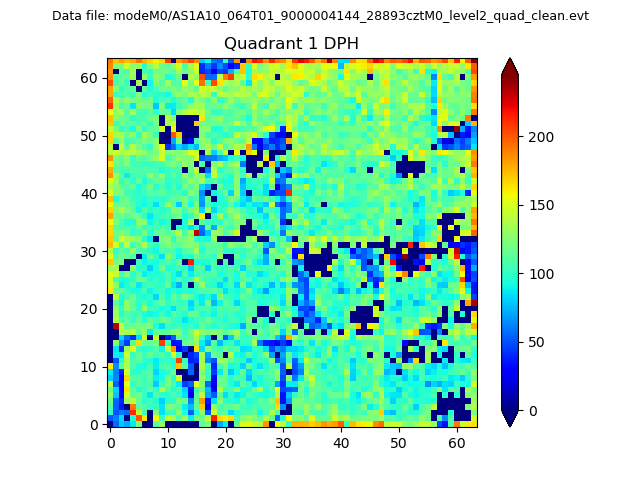 |
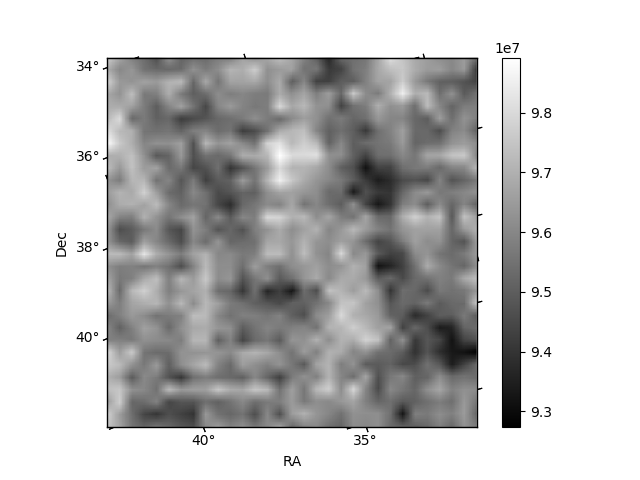
Quadrant B |
|---|---|---|---|
| Quadrant D | 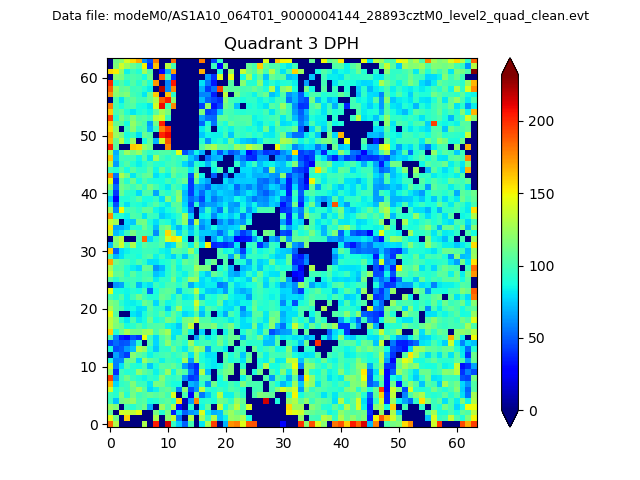 |
 |
Quadrant C |
| Plot type | Count rate plots | Images |
|---|---|---|
| Comparison with Poisson distribution Blue bars denote a histogram of data divided into 1 sec bins. Red curve is a Poisson curve with rate = median count rate of data. |
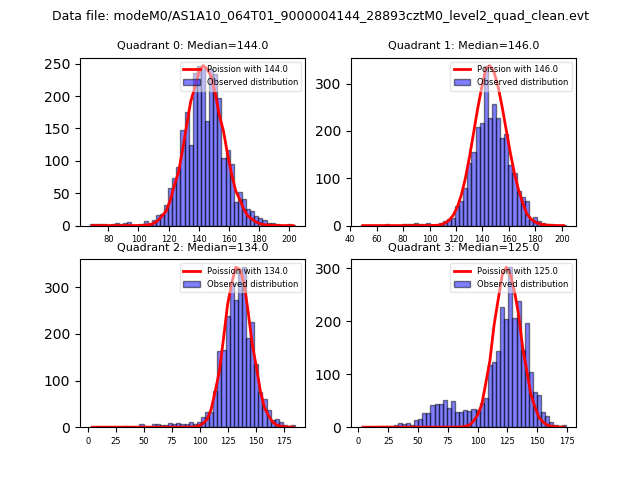 |
 |
| Quadrant-wise count rates Data is divided into 100 sec bins |
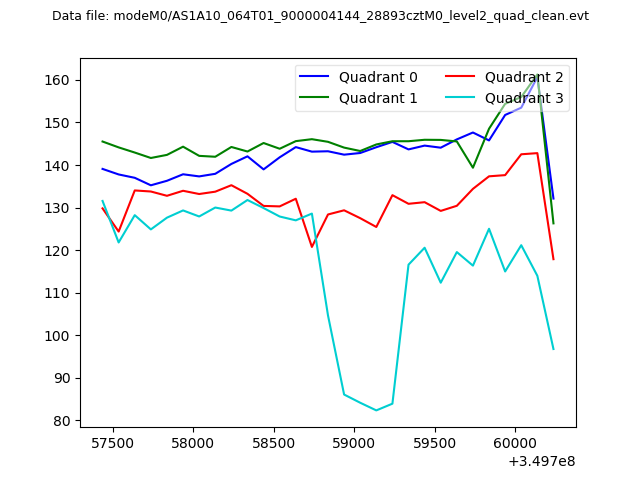 |
|
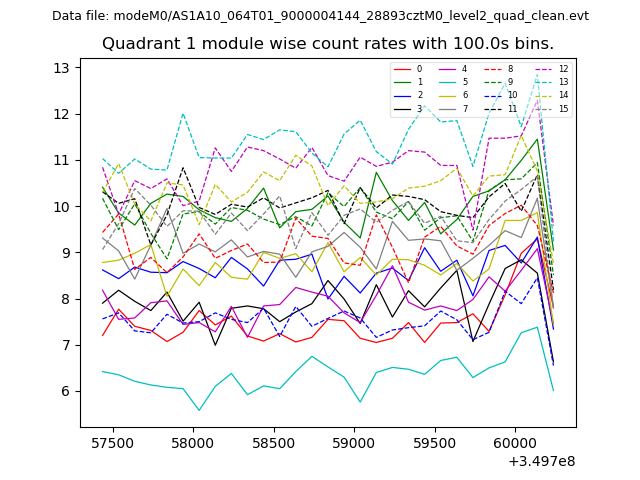
| Module-wise count rates for Quadrant A Data is divided into 100 sec bins |
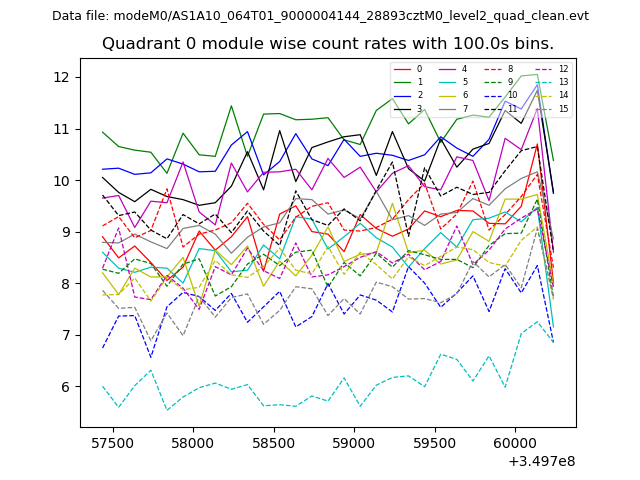 |
 |
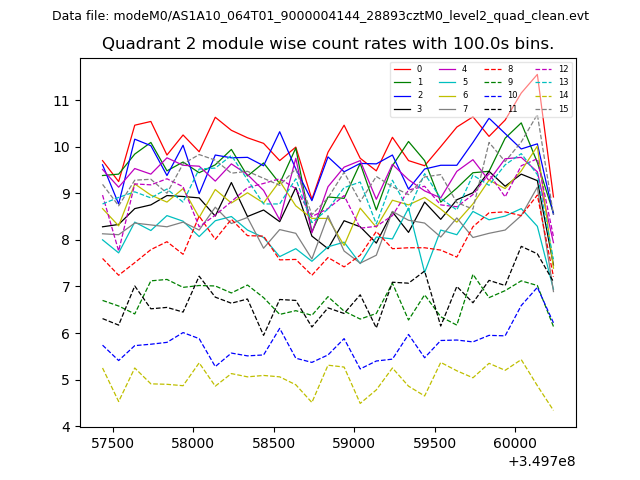
| Module-wise count rates for Quadrant B Data is divided into 100 sec bins |
 |
 |
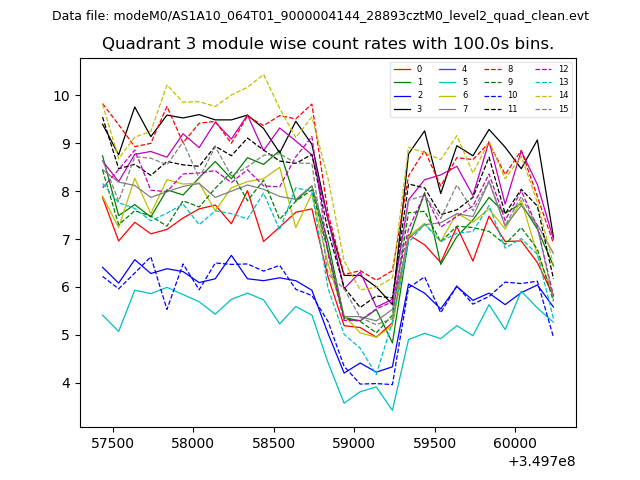
| Module-wise count rates for Quadrant C Data is divided into 100 sec bins |
 |
 |
| Module-wise count rates for Quadrant D Data is divided into 100 sec bins |
 |
 |
| Parameter | Plot |
|---|---|
| CZT HV Monitor | 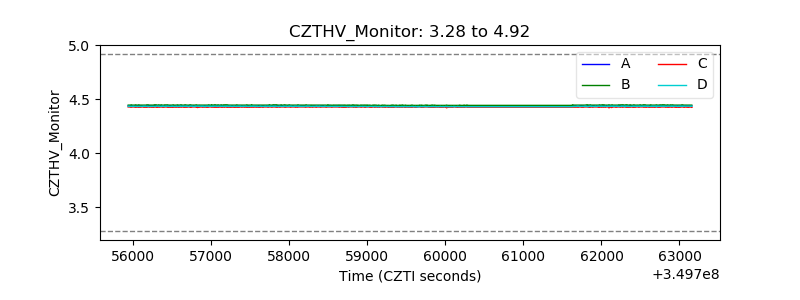 |
| D_VDD | 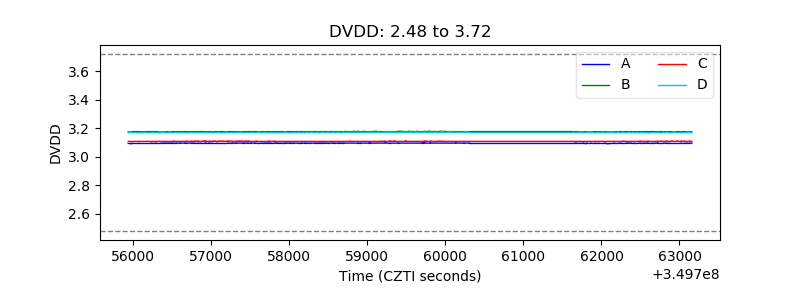 |
| Temperature 1 | 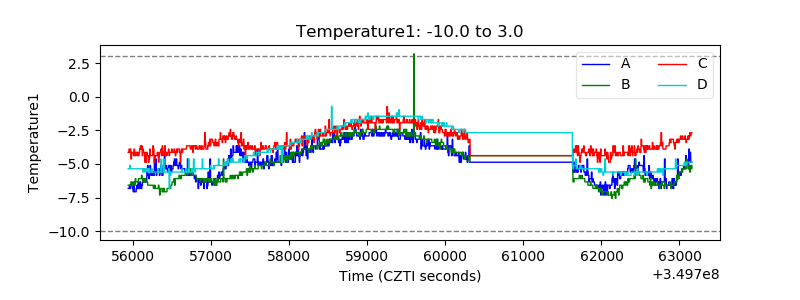 |
| Veto HV Monitor | 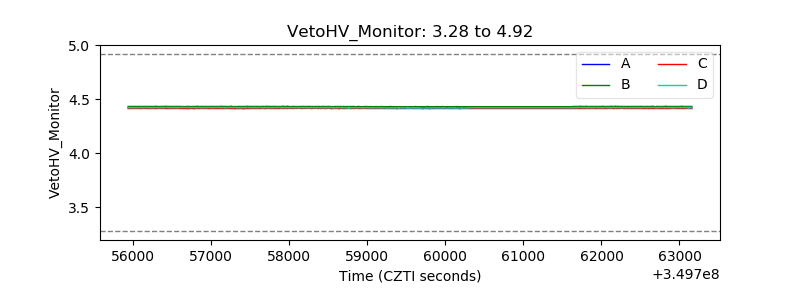 |
| Veto LLD | 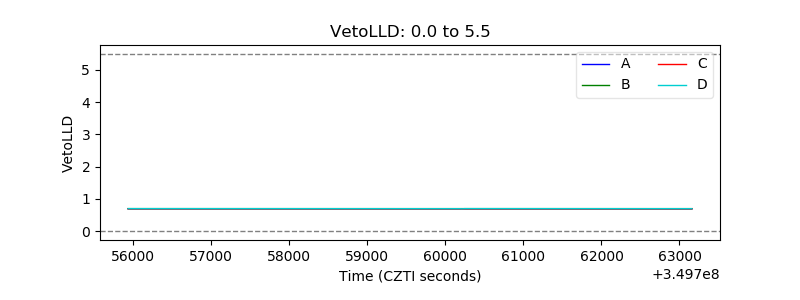 |
| Alpha Counter | 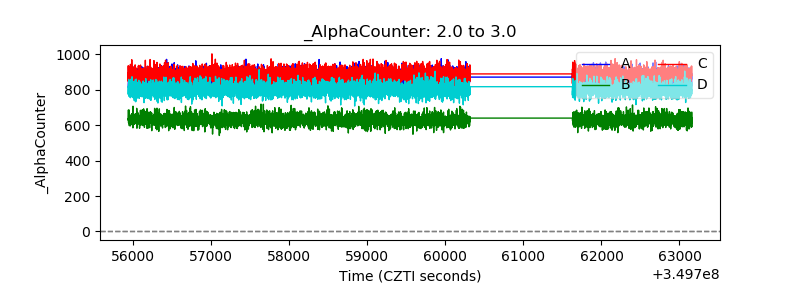 |
| _CPM_Rate | 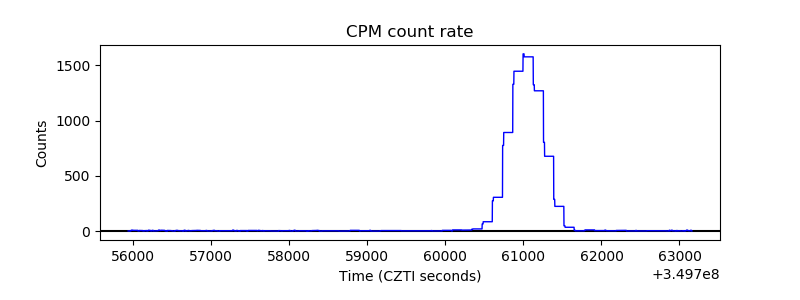 |
| CZT Counter | 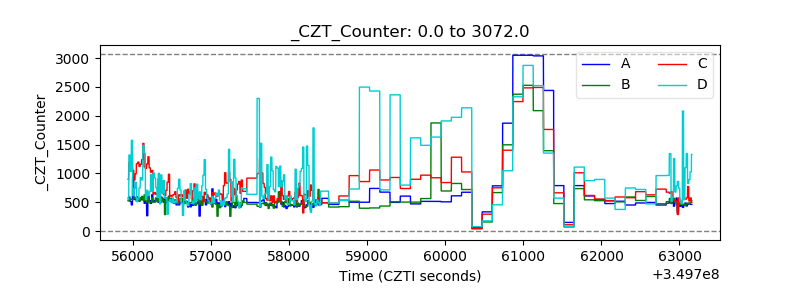 |
| +2.5 Volts monitor |  |
| +5 Volts monitor |  |
| _ROLL_ROT | 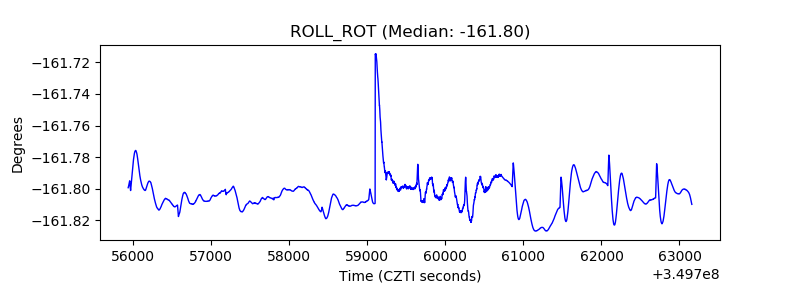 |
| _Roll_DEC | 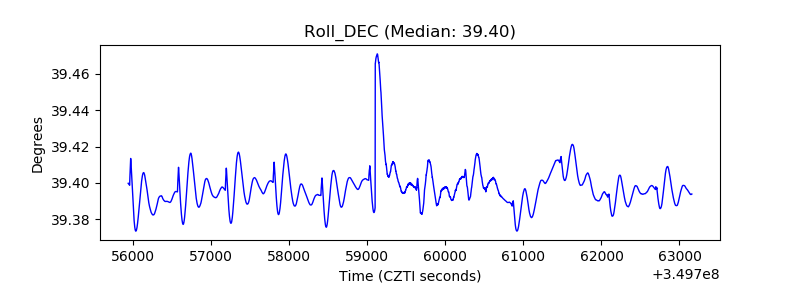 |
| _Roll_RA | 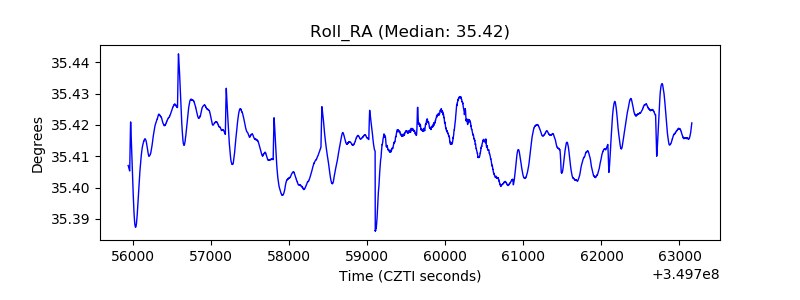 |
| Veto Counter | 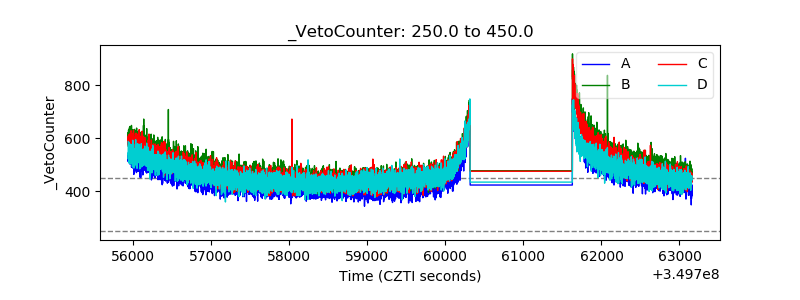 |