| Param | Original file | Final file |
|---|---|---|
| Filename | modeM0/AS1A10_064T01_9000004144_28894cztM0_level2.evt | modeM0/AS1A10_064T01_9000004144_28894cztM0_level2_quad_clean.evt |
| Size (bytes) | 623,793,600 | 77,670,720 |
| Size | 594.9 MB | 74.1 MB |
| Events in quadrant A | 3,016,993 | 505,718 |
| Events in quadrant B | 3,067,620 | 516,028 |
| Events in quadrant C | 6,911,339 | 450,334 |
| Events in quadrant D | 5,483,006 | 453,203 |
| Mode M0 | |||
|---|---|---|---|
| Quadrant | BADHDUFLAG | Total packets | Discarded packets |
| A | 0 | 12610 | 1 |
| B | 0 | 12720 | 1 |
| C | 0 | 24687 | 1 |
| D | 0 | 20502 | 1 |
| Mode SS | |||
|---|---|---|---|
| Quadrant | BADHDUFLAG | Total packets | Discarded packets |
| A | 0 | 124 | 0 |
| B | 0 | 124 | 0 |
| C | 0 | 124 | 0 |
| D | 0 | 124 | 0 |
| Mode M9 | |||
|---|---|---|---|
| Quadrant | BADHDUFLAG | Total packets | Discarded packets |
| A | 0 | 10 | 0 |
| B | 0 | 10 | 0 |
| C | 0 | 10 | 0 |
| D | 0 | 10 | 0 |
| Quadrant | Total seconds | Saturated seconds | Saturation percentage |
|---|---|---|---|
| A | 6103 | 63 | 1.032279% |
| B | 6104 | 94 | 1.539974% |
| C | 6104 | 1181 | 19.347969% |
| D | 6104 | 430 | 7.044561% |
Noise dominated data is calculated using 1-second bins in cleaned event files. If a bin has >2000 counts, and if more than 50% of those come from <1% of pixels, then it is considered to be noise-dominated and hence unusable.
| Quadrant | # 1 sec bins | Bins with >0 counts | Bins with >2000 counts | High rate bins dominated by noise | Noise dominated (total time) | Noise dominated (detector-on time) | Marked lightcurve |
|---|---|---|---|---|---|---|---|
| A | 7183 | 6103 | 0 | 0 | 0.00% | 0.00% | 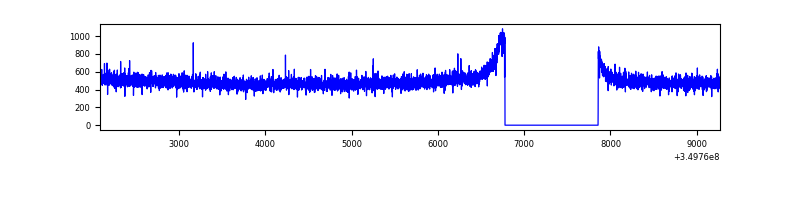 |
| B | 7184 | 6104 | 0 | 0 | 0.00% | 0.00% | 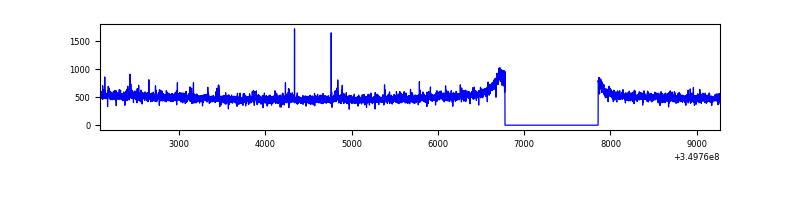 |
| C | 7183 | 6103 | 554 | 554 | 7.71% | 9.08% | 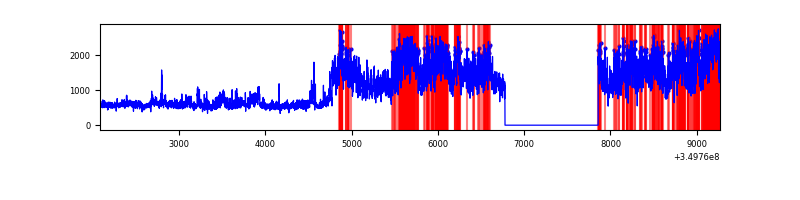 |
| D | 7184 | 6104 | 383 | 383 | 5.33% | 6.27% | 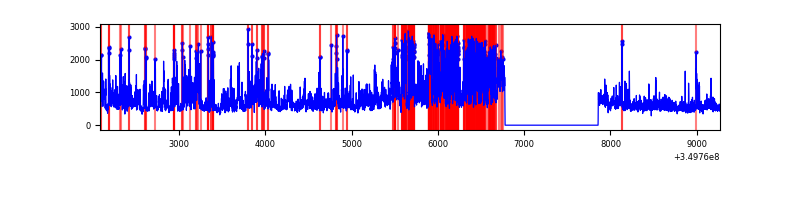 |
Top three noisy pixels from each quadrant. If the there are fewer than three noisy pixels in the level2.evt file, extra rows are filled as -1
| Pixel properties | Quadrant properties | ||||||
|---|---|---|---|---|---|---|---|
| Quadrant | DetID | PixID | Counts | Sigma | Mean | Median | Sigma |
| A | 13 | 254 | 9491 | 55.9 | 780 | 765 | 156.1 |
| A | 3 | 137 | 7546 | 43.44 | 780 | 765 | 156.1 |
| A | 0 | 226 | 6516 | 36.84 | 780 | 765 | 156.1 |
| B | 12 | 111 | 17899 | 115.91 | 776 | 756 | 147.9 |
| B | 11 | 111 | 16593 | 107.08 | 776 | 756 | 147.9 |
| B | 14 | 111 | 15063 | 96.73 | 776 | 756 | 147.9 |
| C | 3 | 233 | 3931202 | 23962.21 | 709 | 716 | 164.0 |
| C | 14 | 238 | 135498 | 821.7 | 709 | 716 | 164.0 |
| C | 15 | 208 | 33034 | 197.03 | 709 | 716 | 164.0 |
| D | 8 | 195 | 1659804 | 9516.12 | 732 | 715 | 174.3 |
| D | 1 | 52 | 1039636 | 5958.99 | 732 | 715 | 174.3 |
| D | 2 | 234 | 21376 | 118.51 | 732 | 715 | 174.3 |
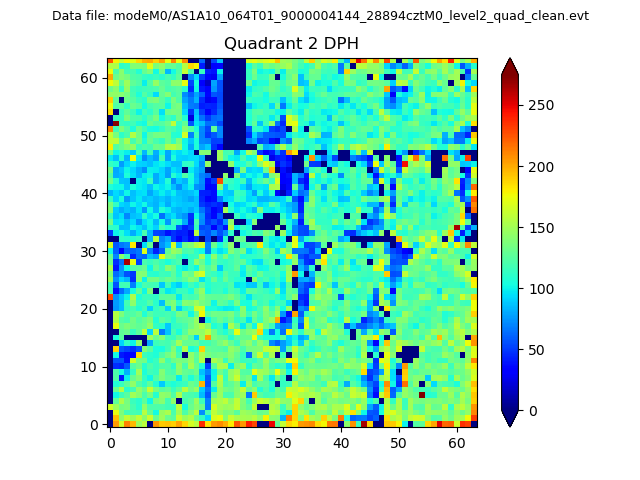
Histogram calculated using DETX and DETY for each event in the final _common_clean file
| Quadrant A | 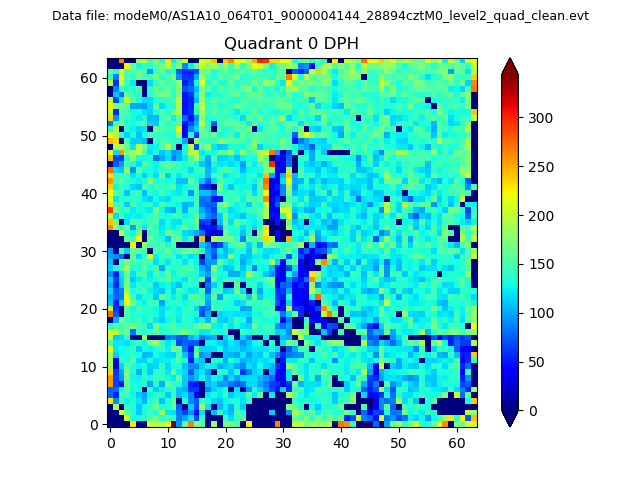 |
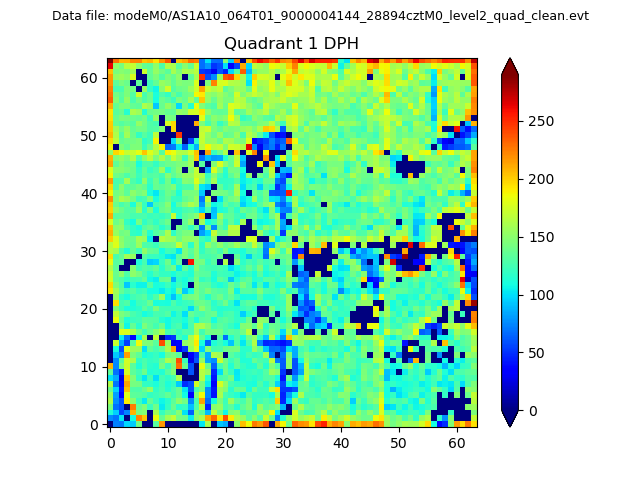 |
Quadrant B |
|---|---|---|---|
| Quadrant D | 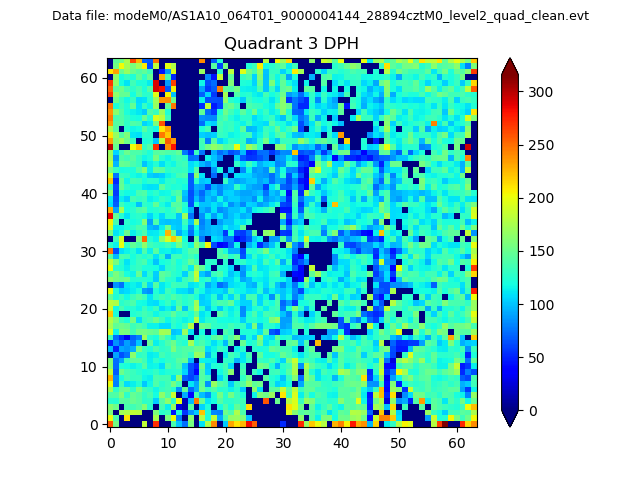 |
 |
Quadrant C |
| Plot type | Count rate plots | Images |
|---|---|---|
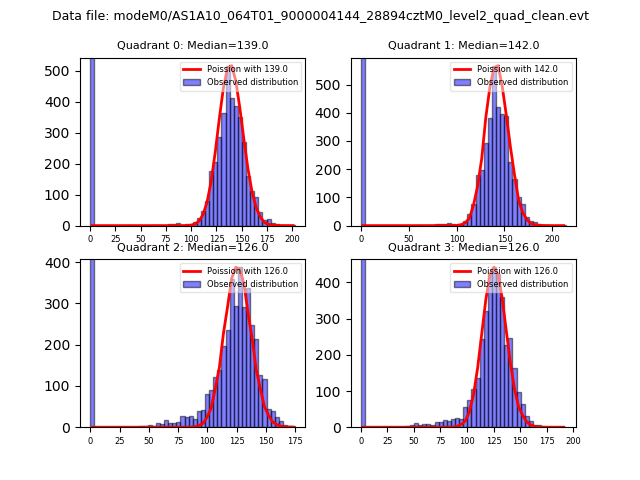
| Comparison with Poisson distribution Blue bars denote a histogram of data divided into 1 sec bins. Red curve is a Poisson curve with rate = median count rate of data. |
 |
 |
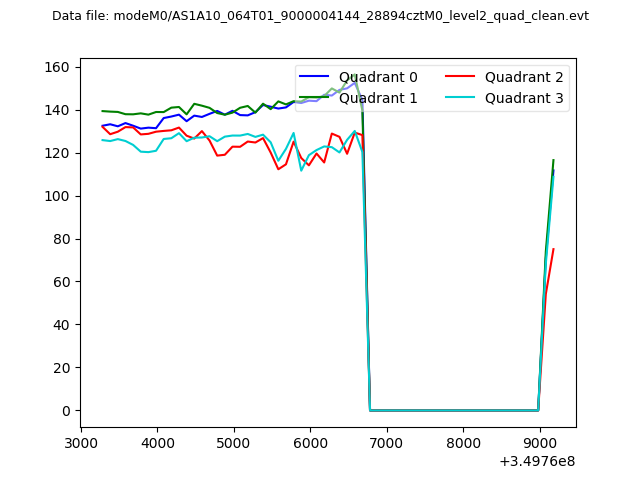
| Quadrant-wise count rates Data is divided into 100 sec bins |
 |
|
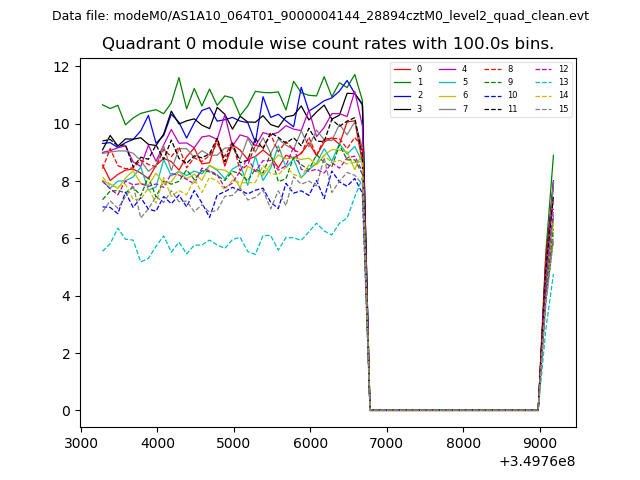
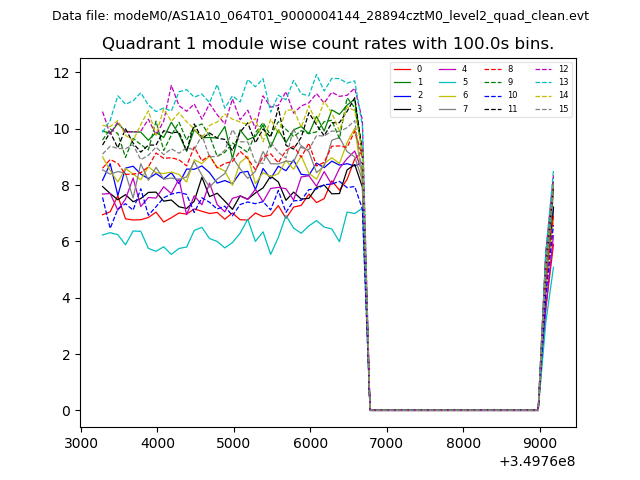
| Module-wise count rates for Quadrant A Data is divided into 100 sec bins |
 |
 |
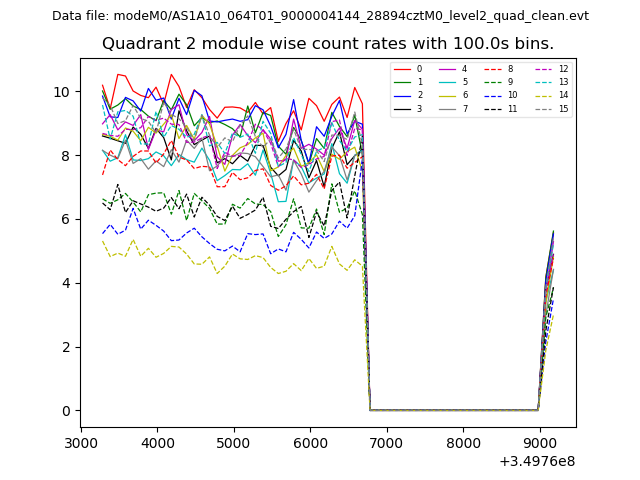
| Module-wise count rates for Quadrant B Data is divided into 100 sec bins |
 |
 |
| Module-wise count rates for Quadrant C Data is divided into 100 sec bins |
 |
 |
| Module-wise count rates for Quadrant D Data is divided into 100 sec bins |
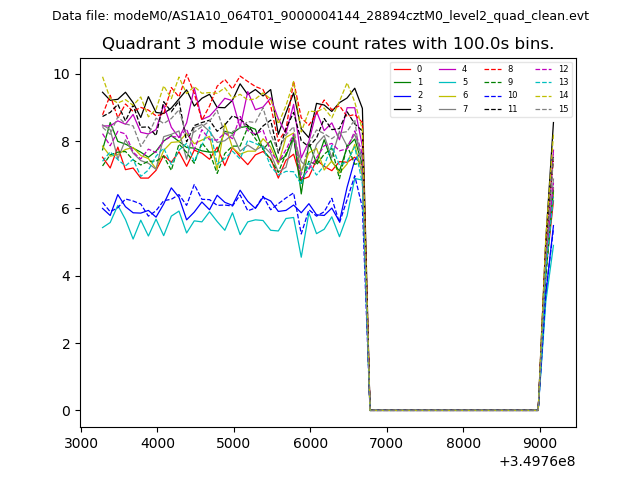 |
 |
| Parameter | Plot |
|---|---|
| CZT HV Monitor | 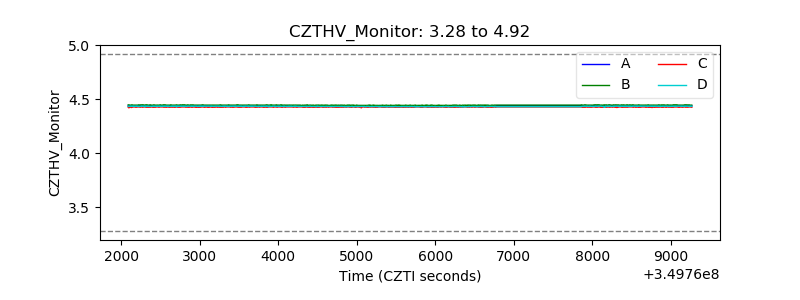 |
| D_VDD | 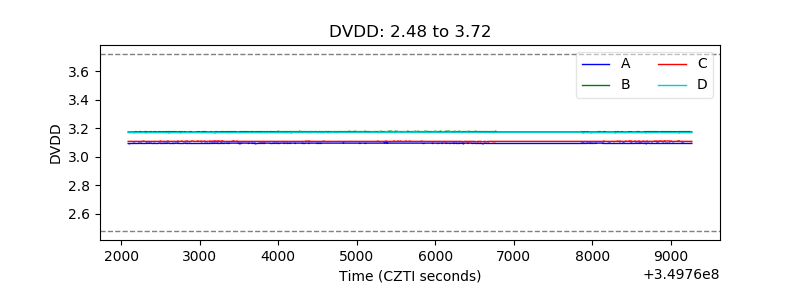 |
| Temperature 1 | 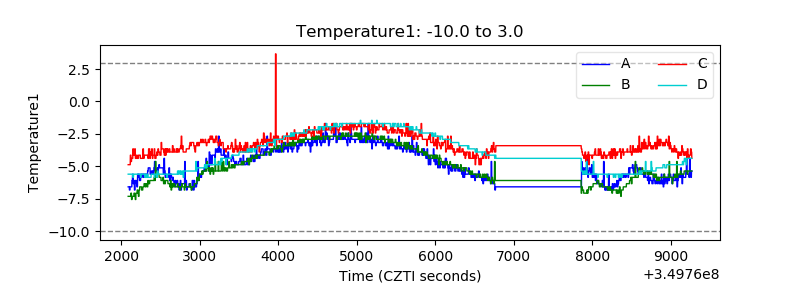 |
| Veto HV Monitor | 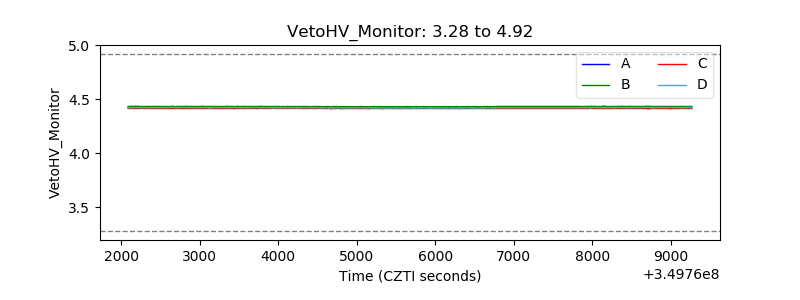 |
| Veto LLD | 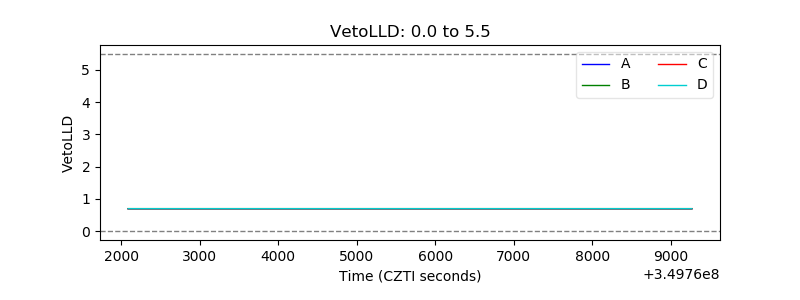 |
| Alpha Counter | 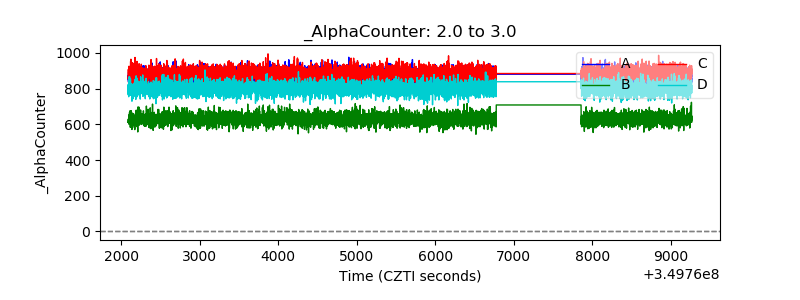 |
| _CPM_Rate | 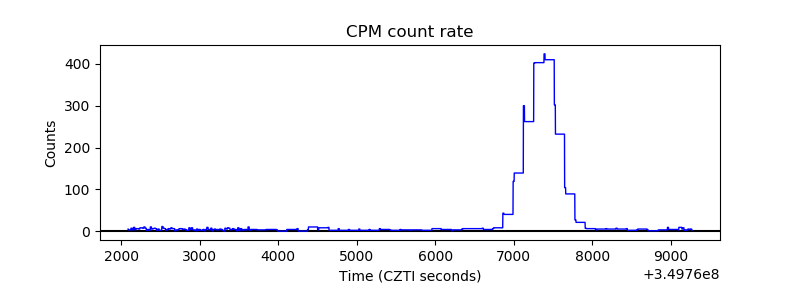 |
| CZT Counter | 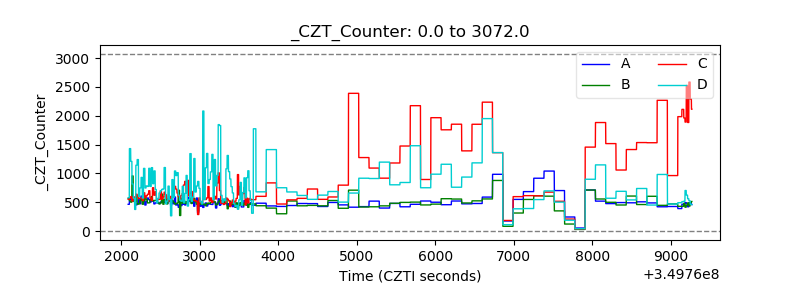 |
| +2.5 Volts monitor |  |
| +5 Volts monitor |  |
| _ROLL_ROT | 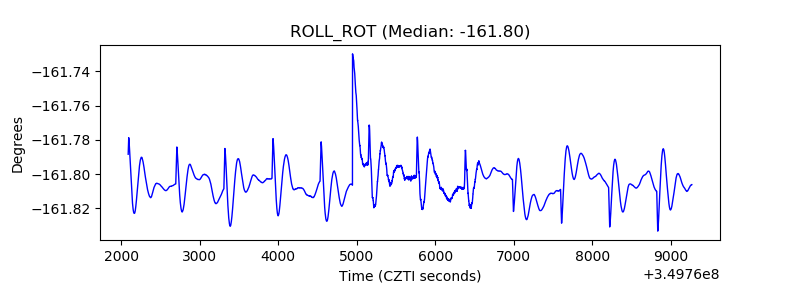 |
| _Roll_DEC | 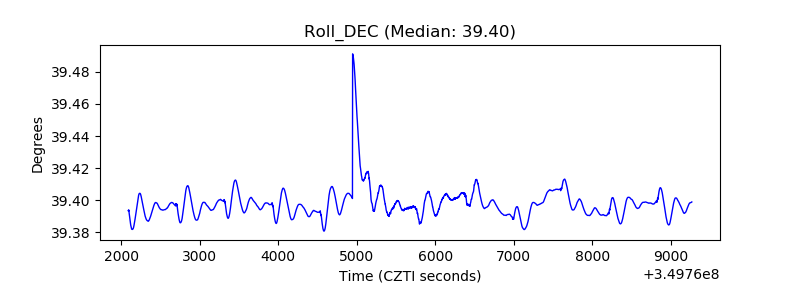 |
| _Roll_RA | 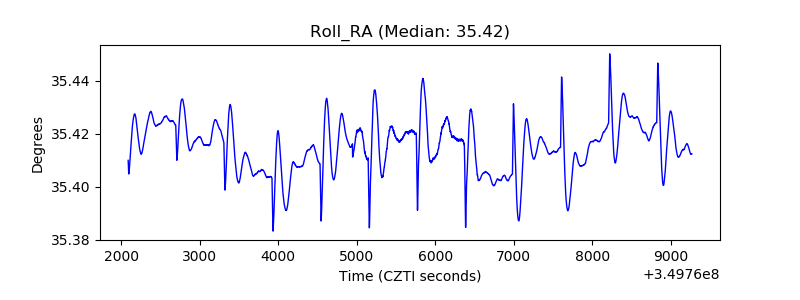 |
| Veto Counter | 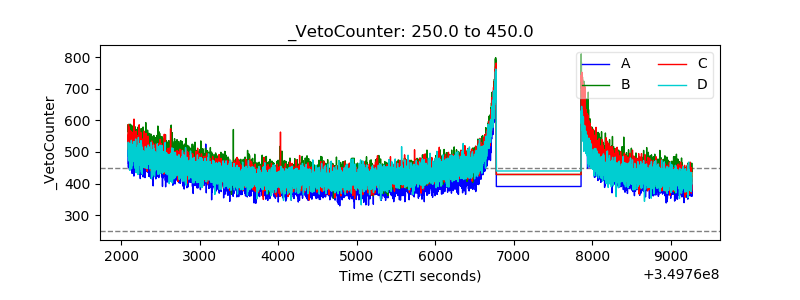 |