| Param | Original file | Final file |
|---|---|---|
| Filename | modeM0/AS1A10_064T01_9000004144_28896cztM0_level2.evt | modeM0/AS1A10_064T01_9000004144_28896cztM0_level2_quad_clean.evt |
| Size (bytes) | 580,132,800 | 93,836,160 |
| Size | 553.3 MB | 89.5 MB |
| Events in quadrant A | 3,152,008 | 614,659 |
| Events in quadrant B | 3,208,817 | 624,884 |
| Events in quadrant C | 5,707,716 | 574,737 |
| Events in quadrant D | 5,047,553 | 560,888 |
| Mode M0 | |||
|---|---|---|---|
| Quadrant | BADHDUFLAG | Total packets | Discarded packets |
| A | 0 | 13748 | 1 |
| B | 0 | 13843 | 1 |
| C | 0 | 21703 | 1 |
| D | 0 | 19268 | 1 |
| Mode SS | |||
|---|---|---|---|
| Quadrant | BADHDUFLAG | Total packets | Discarded packets |
| A | 0 | 136 | 0 |
| B | 0 | 136 | 0 |
| C | 0 | 136 | 0 |
| D | 0 | 136 | 0 |
| Mode M9 | |||
|---|---|---|---|
| Quadrant | BADHDUFLAG | Total packets | Discarded packets |
| A | 0 | 2 | 0 |
| B | 0 | 2 | 0 |
| C | 0 | 2 | 0 |
| D | 0 | 2 | 0 |
| Quadrant | Total seconds | Saturated seconds | Saturation percentage |
|---|---|---|---|
| A | 6688 | 170 | 2.541866% |
| B | 6688 | 186 | 2.781100% |
| C | 6689 | 426 | 6.368665% |
| D | 6689 | 530 | 7.923456% |
Noise dominated data is calculated using 1-second bins in cleaned event files. If a bin has >2000 counts, and if more than 50% of those come from <1% of pixels, then it is considered to be noise-dominated and hence unusable.
| Quadrant | # 1 sec bins | Bins with >0 counts | Bins with >2000 counts | High rate bins dominated by noise | Noise dominated (total time) | Noise dominated (detector-on time) | Marked lightcurve |
|---|---|---|---|---|---|---|---|
| A | 6938 | 6688 | 0 | 0 | 0.00% | 0.00% | 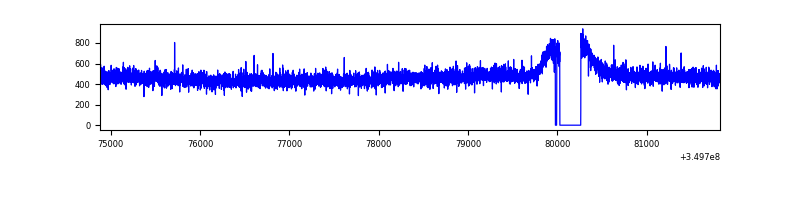 |
| B | 6938 | 6688 | 0 | 0 | 0.00% | 0.00% | 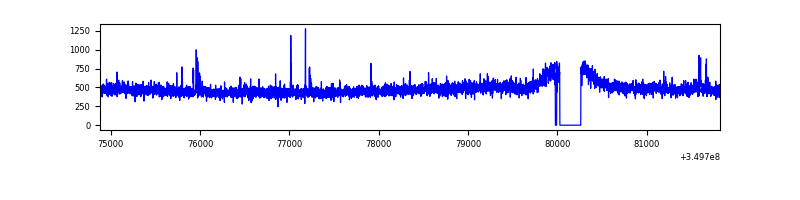 |
| C | 6939 | 6689 | 36 | 36 | 0.52% | 0.54% | 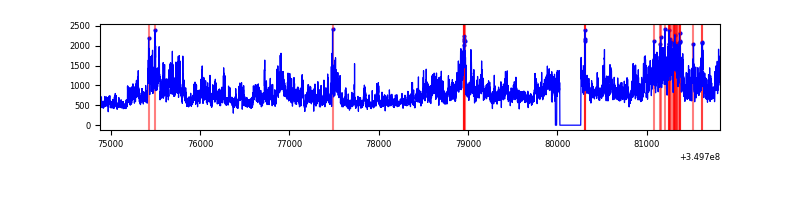 |
| D | 6939 | 6689 | 411 | 411 | 5.92% | 6.14% | 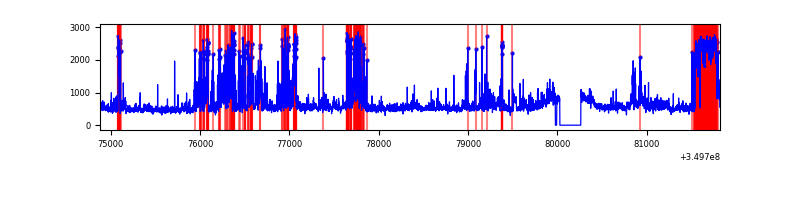 |
Top three noisy pixels from each quadrant. If the there are fewer than three noisy pixels in the level2.evt file, extra rows are filled as -1
| Pixel properties | Quadrant properties | ||||||
|---|---|---|---|---|---|---|---|
| Quadrant | DetID | PixID | Counts | Sigma | Mean | Median | Sigma |
| A | 13 | 254 | 10365 | 57.69 | 817 | 798 | 165.8 |
| A | 3 | 137 | 8251 | 44.94 | 817 | 798 | 165.8 |
| A | 0 | 226 | 6862 | 36.57 | 817 | 798 | 165.8 |
| B | 0 | 190 | 24050 | 148.69 | 807 | 783 | 156.5 |
| B | 12 | 111 | 19284 | 118.23 | 807 | 783 | 156.5 |
| B | 11 | 111 | 17786 | 108.66 | 807 | 783 | 156.5 |
| C | 3 | 233 | 2539975 | 14147.44 | 767 | 771 | 179.5 |
| C | 14 | 238 | 126852 | 702.47 | 767 | 771 | 179.5 |
| C | 2 | 114 | 15694 | 83.15 | 767 | 771 | 179.5 |
| D | 1 | 52 | 1380608 | 7419.9 | 777 | 756 | 186.0 |
| D | 8 | 195 | 700416 | 3762.29 | 777 | 756 | 186.0 |
| D | 2 | 234 | 26445 | 138.14 | 777 | 756 | 186.0 |
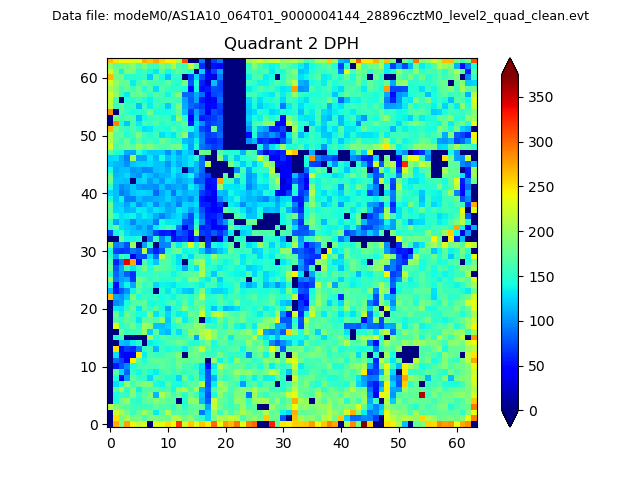
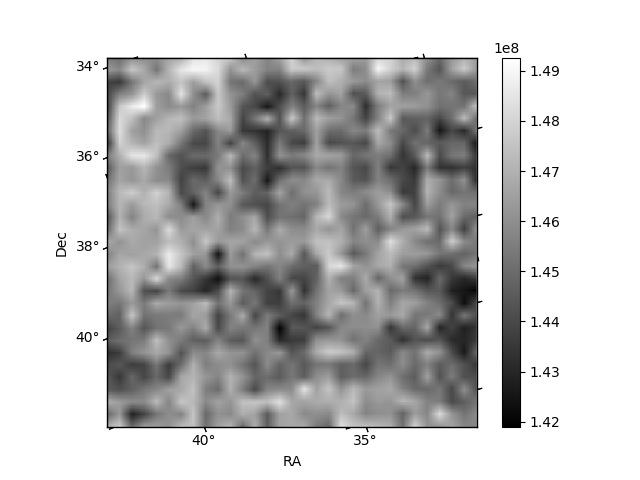
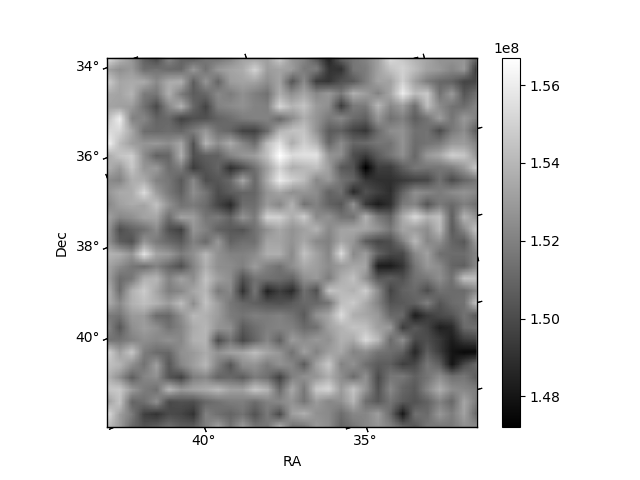
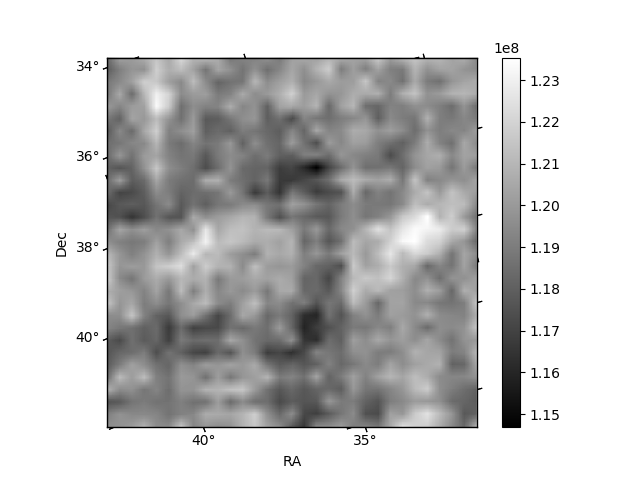
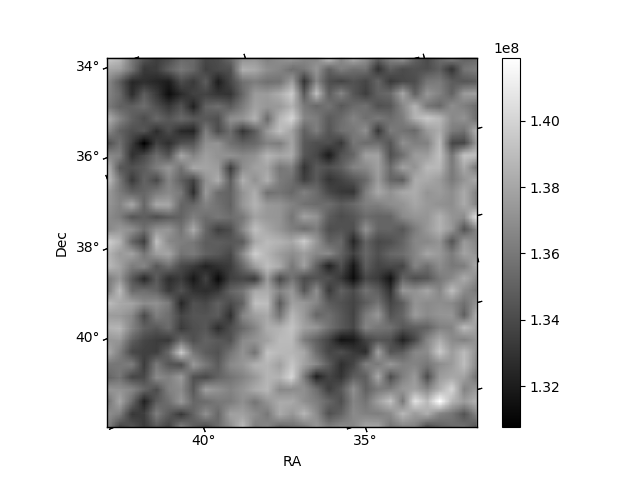
Histogram calculated using DETX and DETY for each event in the final _common_clean file
| Quadrant A | 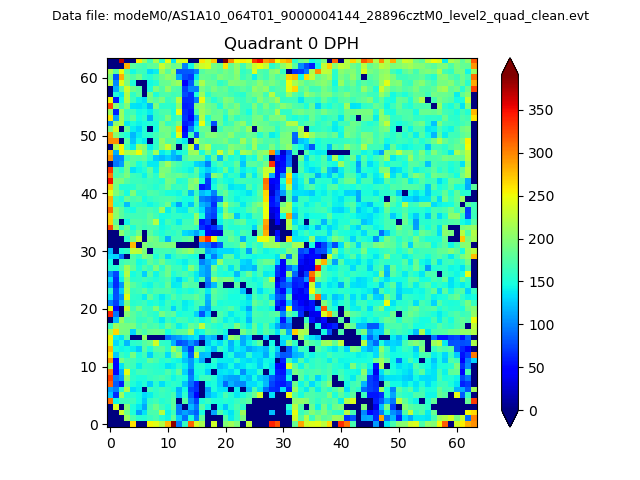 |
 |
Quadrant B |
|---|---|---|---|
| Quadrant D |  |
 |
Quadrant C |
| Plot type | Count rate plots | Images |
|---|---|---|
| Comparison with Poisson distribution Blue bars denote a histogram of data divided into 1 sec bins. Red curve is a Poisson curve with rate = median count rate of data. |
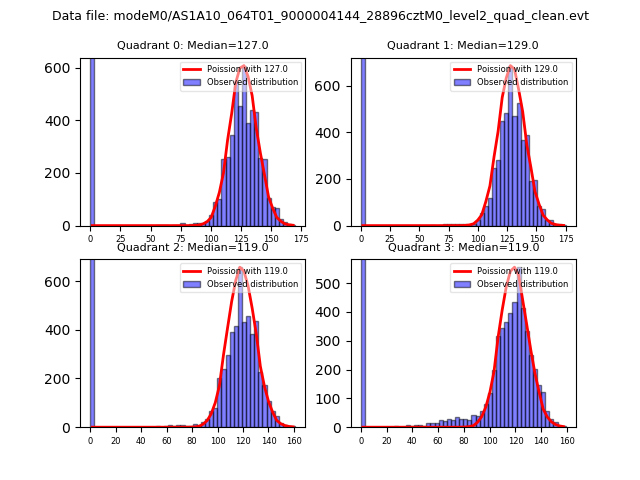 |
 |
| Quadrant-wise count rates Data is divided into 100 sec bins |
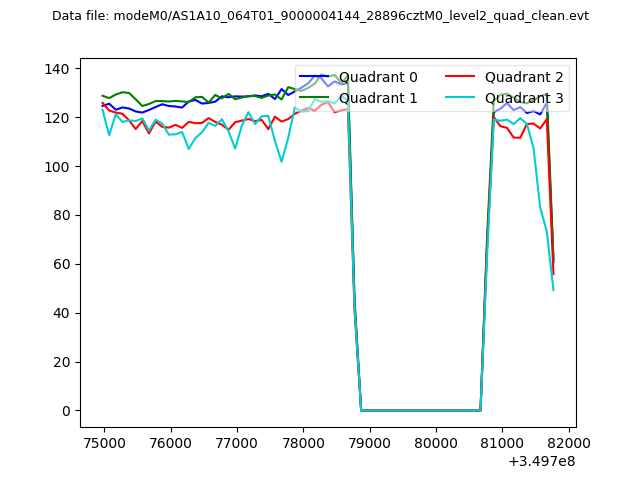 |
|
| Module-wise count rates for Quadrant A Data is divided into 100 sec bins |
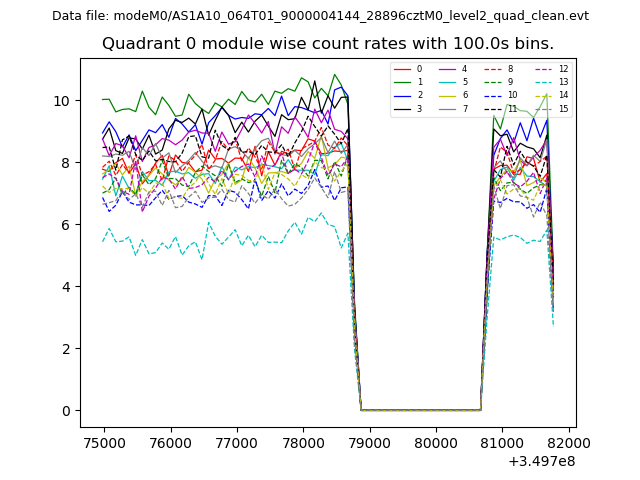 |
 |
| Module-wise count rates for Quadrant B Data is divided into 100 sec bins |
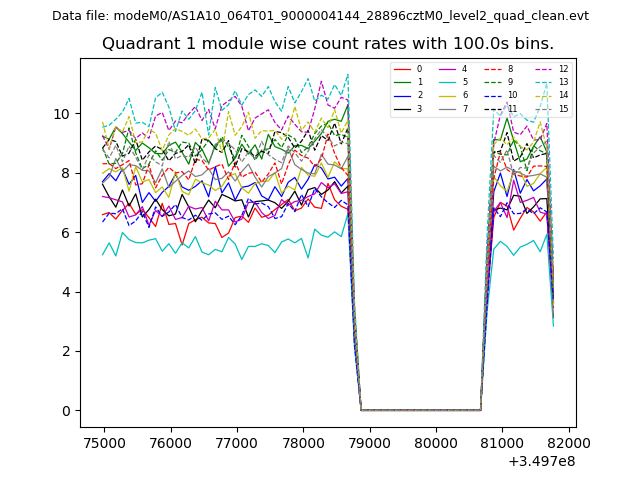 |
 |
| Module-wise count rates for Quadrant C Data is divided into 100 sec bins |
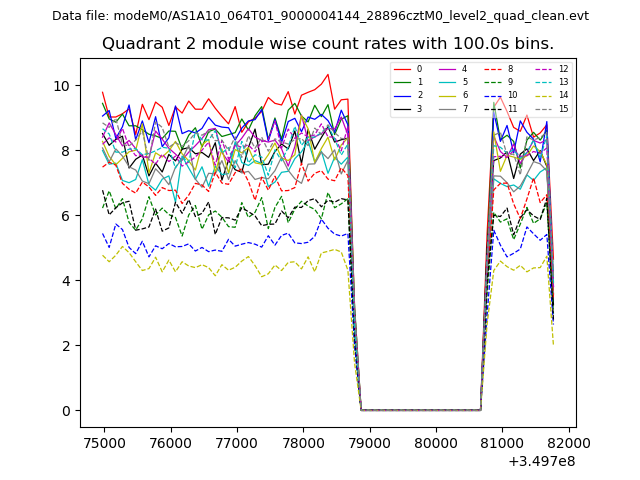 |
 |
| Module-wise count rates for Quadrant D Data is divided into 100 sec bins |
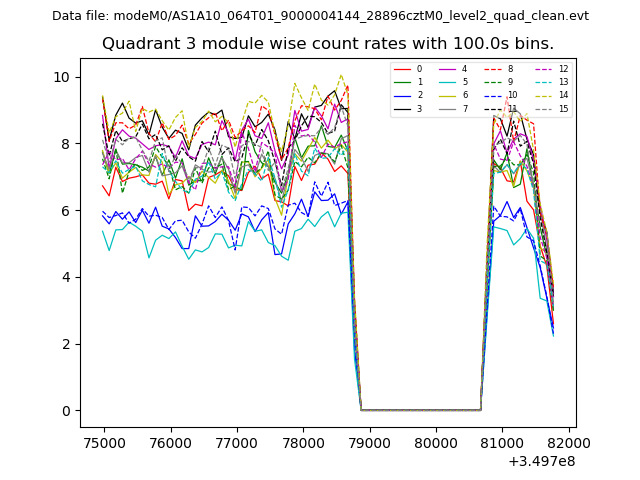 |
 |
| Parameter | Plot |
|---|---|
| CZT HV Monitor |  |
| D_VDD | 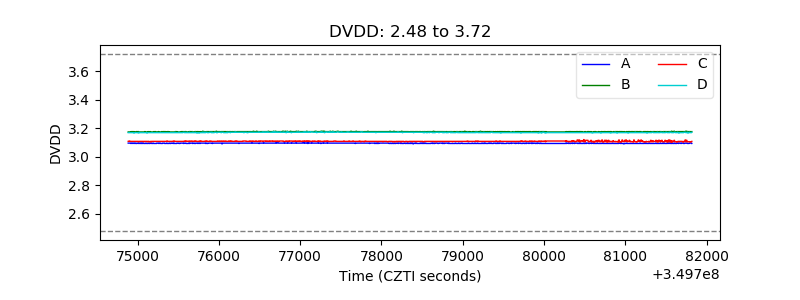 |
| Temperature 1 | 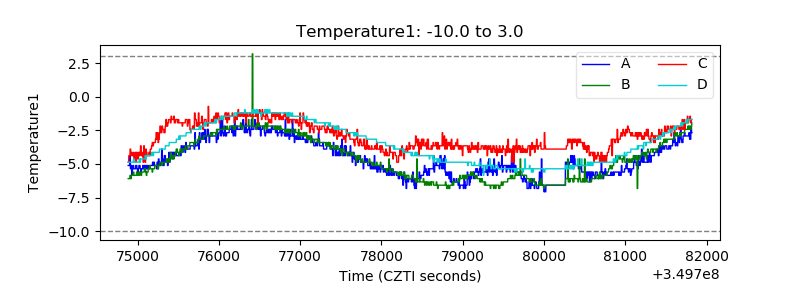 |
| Veto HV Monitor | 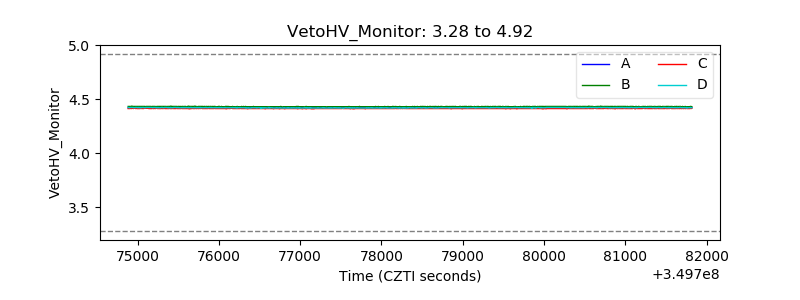 |
| Veto LLD | 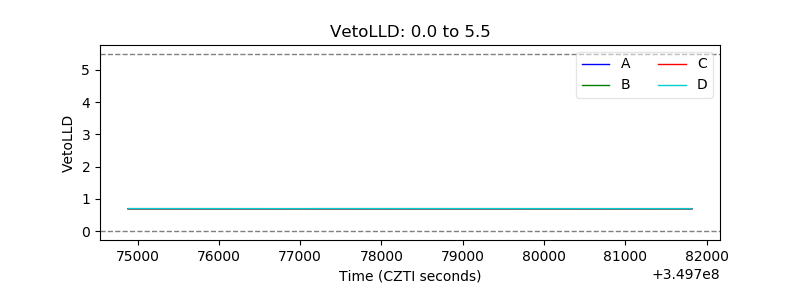 |
| Alpha Counter | 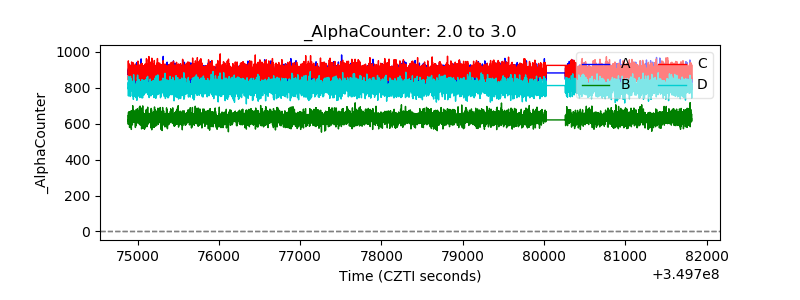 |
| _CPM_Rate | 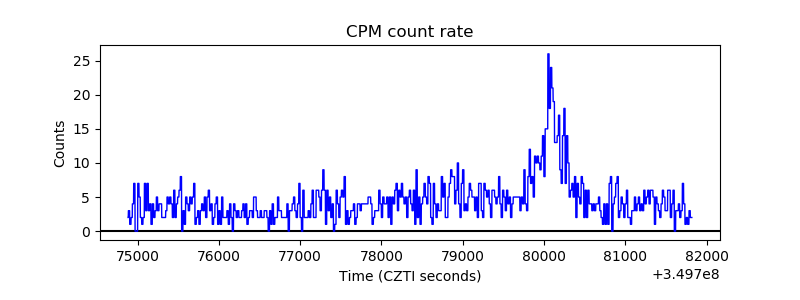 |
| CZT Counter | 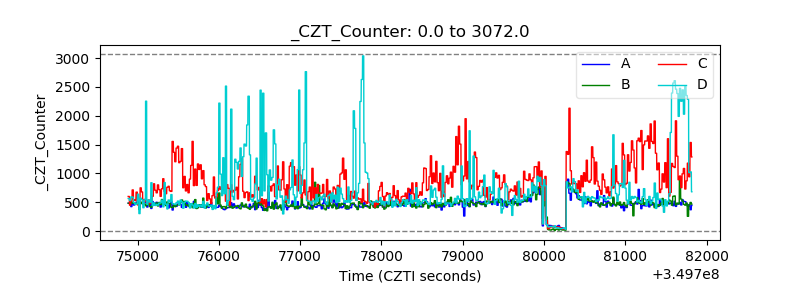 |
| +2.5 Volts monitor |  |
| +5 Volts monitor |  |
| _ROLL_ROT | 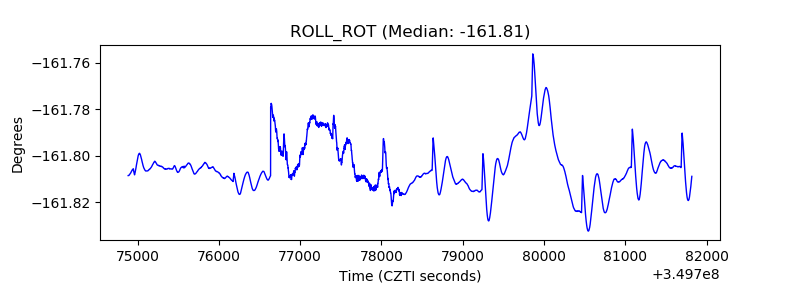 |
| _Roll_DEC | 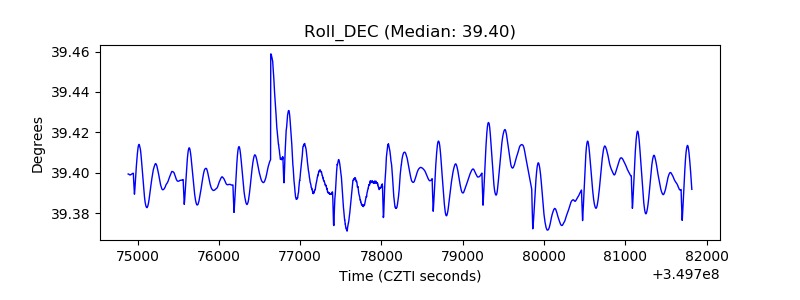 |
| _Roll_RA | 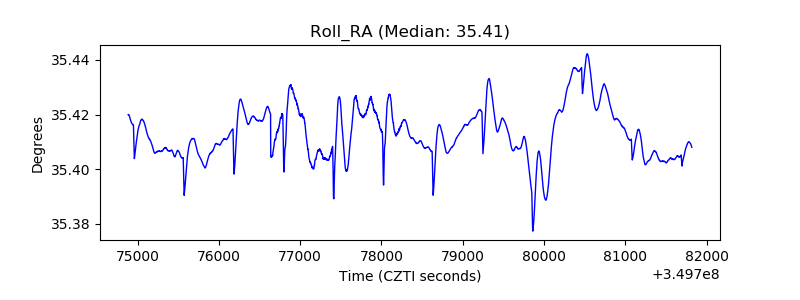 |
| Veto Counter | 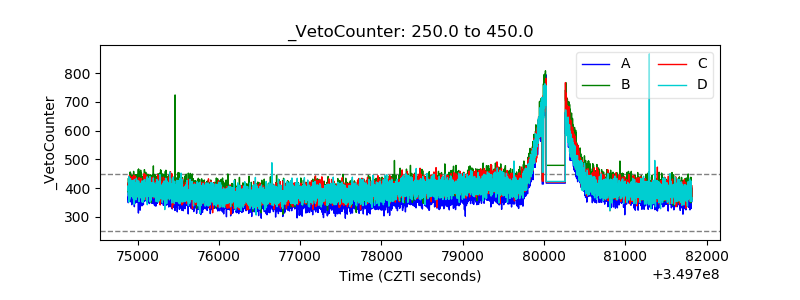 |