| Param | Original file | Final file |
|---|---|---|
| Filename | modeM0/AS1A10_064T01_9000004144_28897cztM0_level2.evt | modeM0/AS1A10_064T01_9000004144_28897cztM0_level2_quad_clean.evt |
| Size (bytes) | 946,690,560 | 98,591,040 |
| Size | 902.8 MB | 94.0 MB |
| Events in quadrant A | 3,644,267 | 675,675 |
| Events in quadrant B | 3,717,540 | 687,703 |
| Events in quadrant C | 7,792,045 | 613,039 |
| Events in quadrant D | 12,999,843 | 474,864 |
| Mode M0 | |||
|---|---|---|---|
| Quadrant | BADHDUFLAG | Total packets | Discarded packets |
| A | 0 | 15835 | 1 |
| B | 0 | 15976 | 1 |
| C | 0 | 28747 | 3 |
| D | 0 | 43697 | 1 |
| Mode SS | |||
|---|---|---|---|
| Quadrant | BADHDUFLAG | Total packets | Discarded packets |
| A | 0 | 156 | 0 |
| B | 0 | 156 | 0 |
| C | 0 | 156 | 0 |
| D | 0 | 156 | 0 |
| Mode M9 | |||
|---|---|---|---|
| Quadrant | BADHDUFLAG | Total packets | Discarded packets |
| A | 0 | 2 | 0 |
| B | 0 | 2 | 0 |
| C | 0 | 2 | 0 |
| D | 0 | 2 | 0 |
| Quadrant | Total seconds | Saturated seconds | Saturation percentage |
|---|---|---|---|
| A | 7655 | 148 | 1.933377% |
| B | 7656 | 173 | 2.259666% |
| C | 7655 | 818 | 10.685826% |
| D | 7655 | 4315 | 56.368387% |
Noise dominated data is calculated using 1-second bins in cleaned event files. If a bin has >2000 counts, and if more than 50% of those come from <1% of pixels, then it is considered to be noise-dominated and hence unusable.
| Quadrant | # 1 sec bins | Bins with >0 counts | Bins with >2000 counts | High rate bins dominated by noise | Noise dominated (total time) | Noise dominated (detector-on time) | Marked lightcurve |
|---|---|---|---|---|---|---|---|
| A | 7850 | 7655 | 0 | 0 | 0.00% | 0.00% | 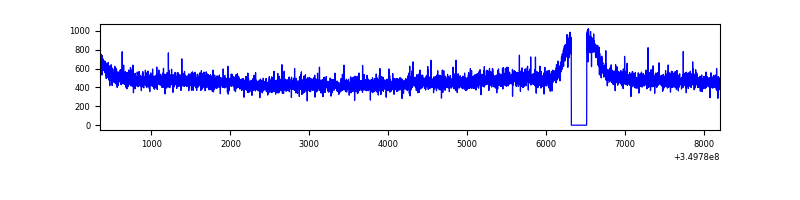 |
| B | 7851 | 7656 | 1 | 1 | 0.01% | 0.01% | 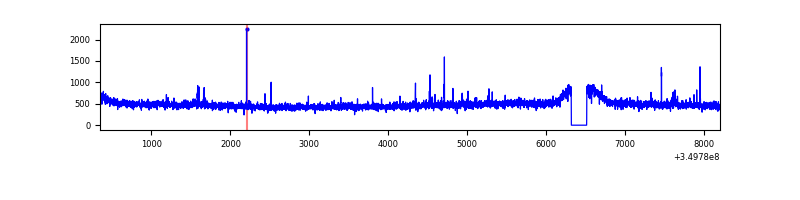 |
| C | 7850 | 7656 | 431 | 431 | 5.49% | 5.63% | 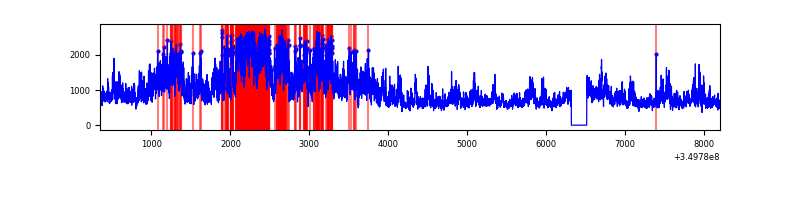 |
| D | 7849 | 7654 | 4011 | 4011 | 51.10% | 52.40% | 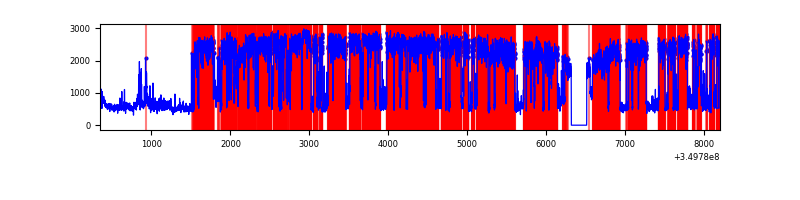 |
Top three noisy pixels from each quadrant. If the there are fewer than three noisy pixels in the level2.evt file, extra rows are filled as -1
| Pixel properties | Quadrant properties | ||||||
|---|---|---|---|---|---|---|---|
| Quadrant | DetID | PixID | Counts | Sigma | Mean | Median | Sigma |
| A | 13 | 254 | 12975 | 62.49 | 944 | 922 | 192.9 |
| A | 3 | 137 | 9494 | 44.44 | 944 | 922 | 192.9 |
| A | 0 | 226 | 7979 | 36.59 | 944 | 922 | 192.9 |
| B | 10 | 245 | 24547 | 129.81 | 934 | 909 | 182.1 |
| B | 12 | 111 | 22976 | 121.18 | 934 | 909 | 182.1 |
| B | 0 | 190 | 21319 | 112.08 | 934 | 909 | 182.1 |
| C | 3 | 233 | 4174602 | 19934.21 | 878 | 882 | 209.4 |
| C | 14 | 238 | 145934 | 692.79 | 878 | 882 | 209.4 |
| C | 2 | 114 | 18104 | 82.25 | 878 | 882 | 209.4 |
| D | 8 | 195 | 8671447 | 48200.82 | 748 | 726 | 179.9 |
| D | 1 | 52 | 1476979 | 8206.54 | 748 | 726 | 179.9 |
| D | 2 | 234 | 24320 | 131.16 | 748 | 726 | 179.9 |
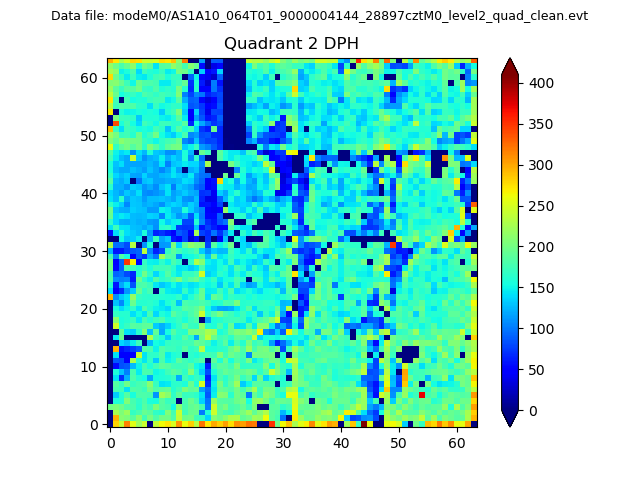
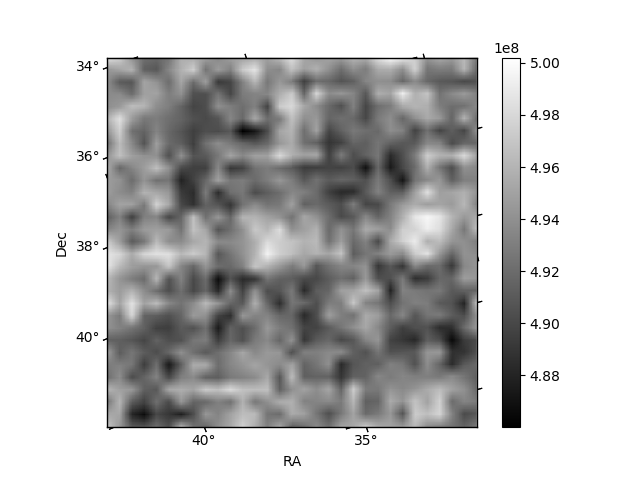
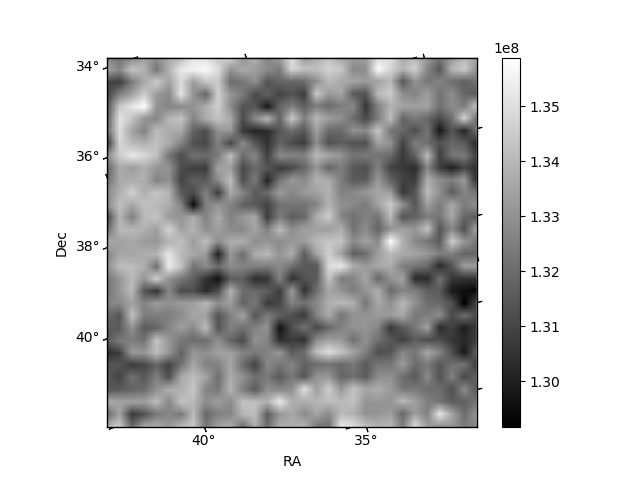
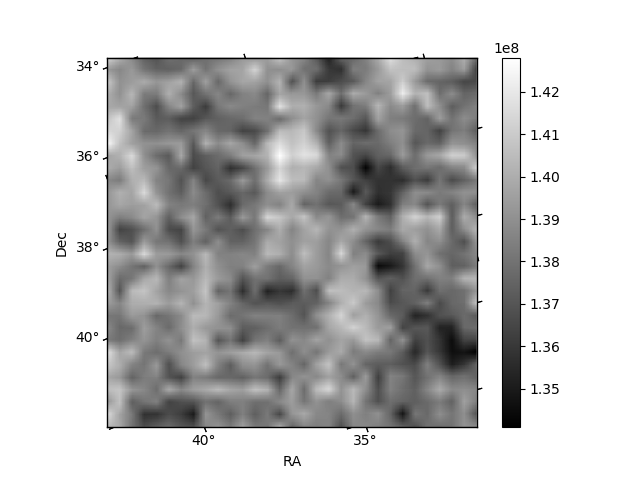
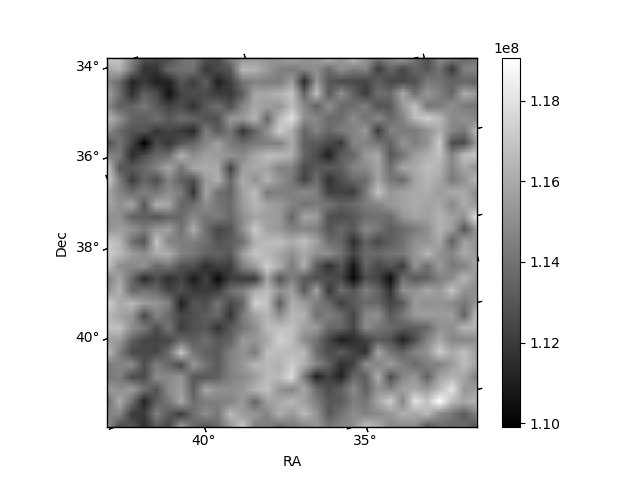
Histogram calculated using DETX and DETY for each event in the final _common_clean file
| Quadrant A | 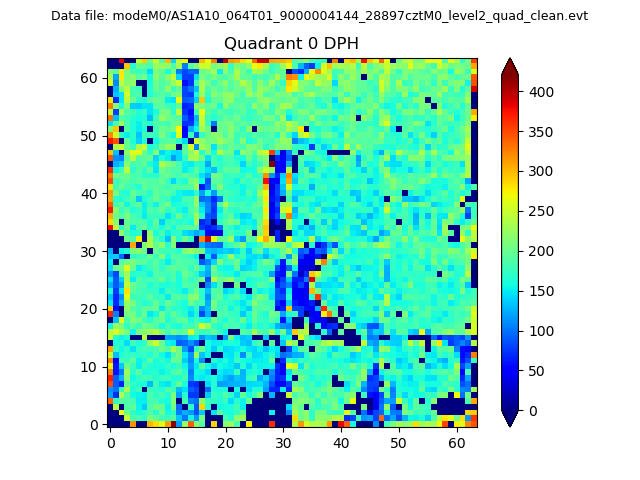 |
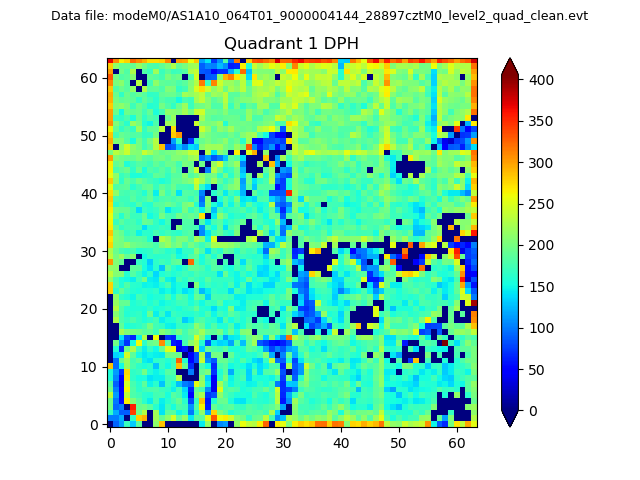 |
Quadrant B |
|---|---|---|---|
| Quadrant D | 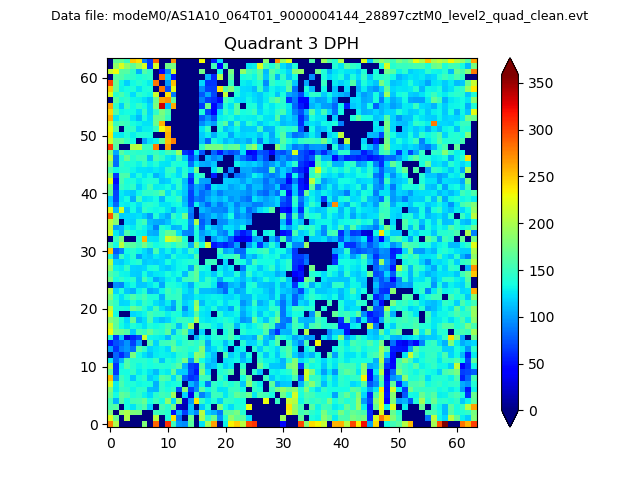 |
 |
Quadrant C |
| Plot type | Count rate plots | Images |
|---|---|---|
| Comparison with Poisson distribution Blue bars denote a histogram of data divided into 1 sec bins. Red curve is a Poisson curve with rate = median count rate of data. |
 |
 |
| Quadrant-wise count rates Data is divided into 100 sec bins |
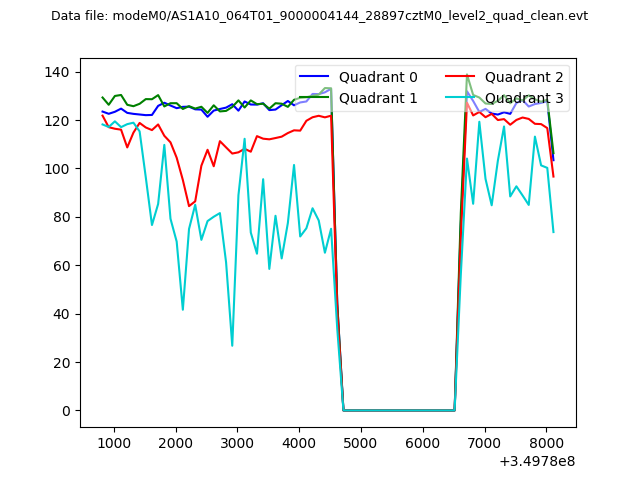 |
|
| Module-wise count rates for Quadrant A Data is divided into 100 sec bins |
 |
 |
| Module-wise count rates for Quadrant B Data is divided into 100 sec bins |
 |
 |
| Module-wise count rates for Quadrant C Data is divided into 100 sec bins |
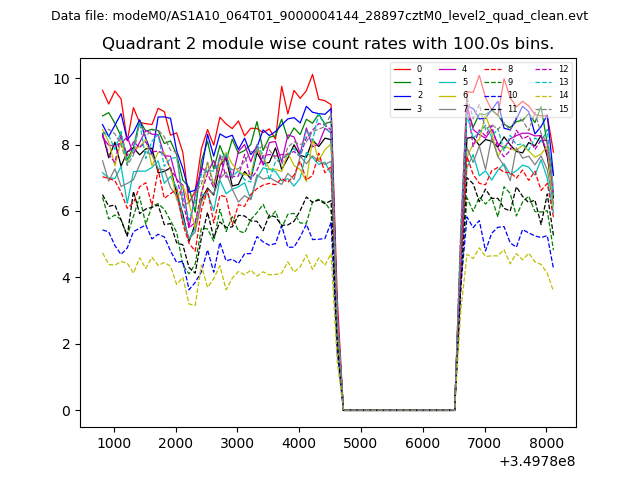 |
 |
| Module-wise count rates for Quadrant D Data is divided into 100 sec bins |
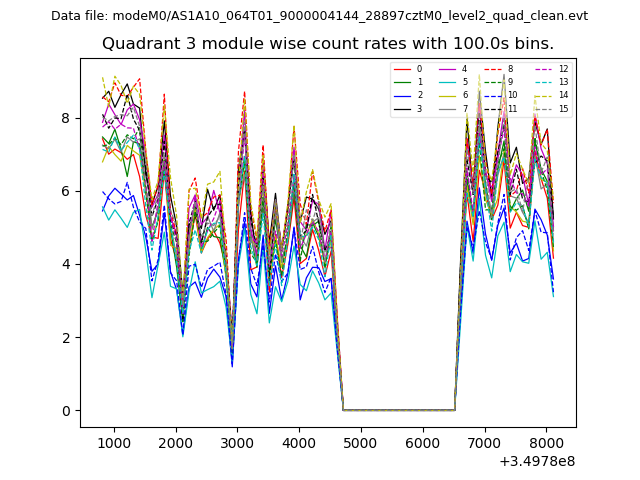 |
 |
| Parameter | Plot |
|---|---|
| CZT HV Monitor | 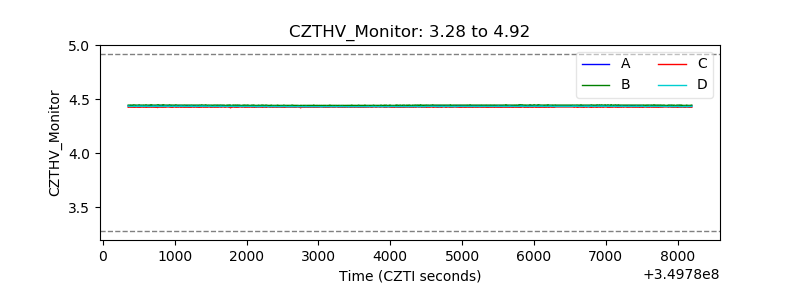 |
| D_VDD | 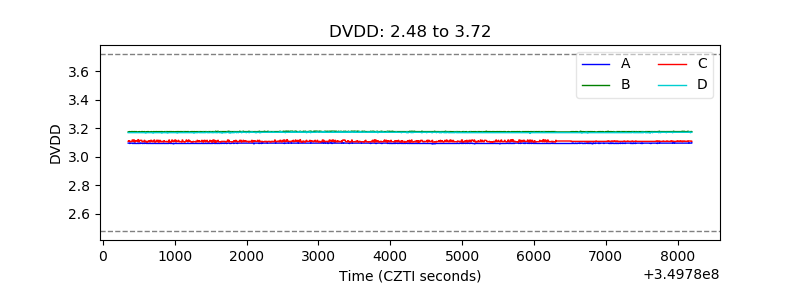 |
| Temperature 1 |  |
| Veto HV Monitor | 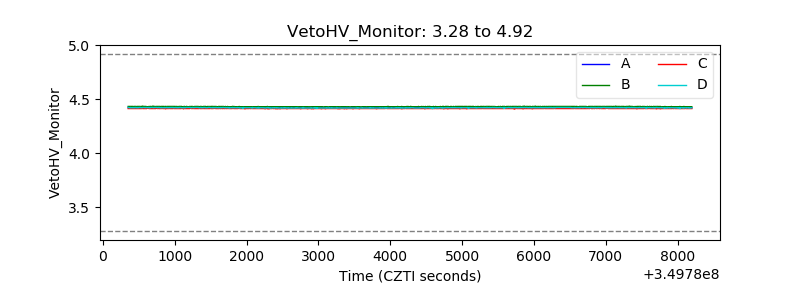 |
| Veto LLD |  |
| Alpha Counter | 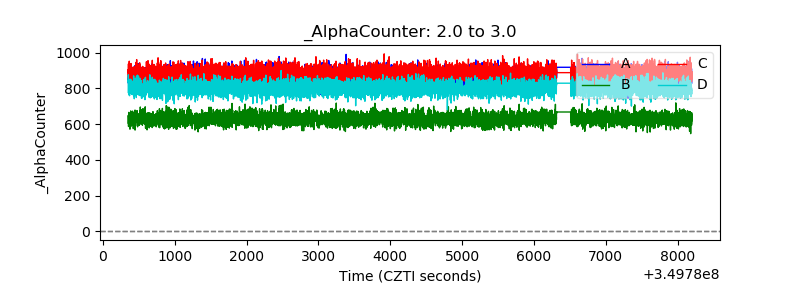 |
| _CPM_Rate | 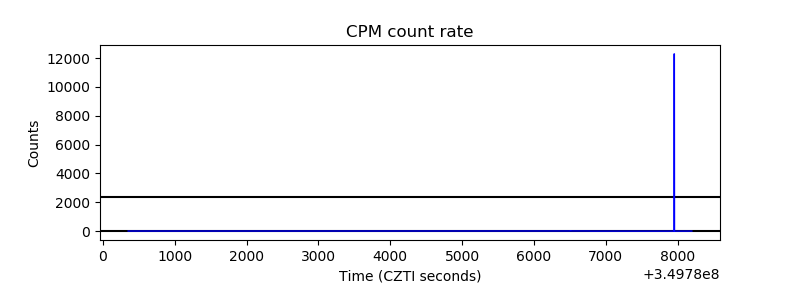 |
| CZT Counter | 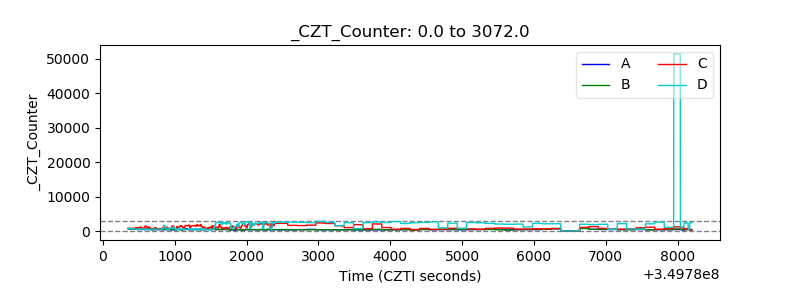 |
| +2.5 Volts monitor |  |
| +5 Volts monitor |  |
| _ROLL_ROT |  |
| _Roll_DEC | 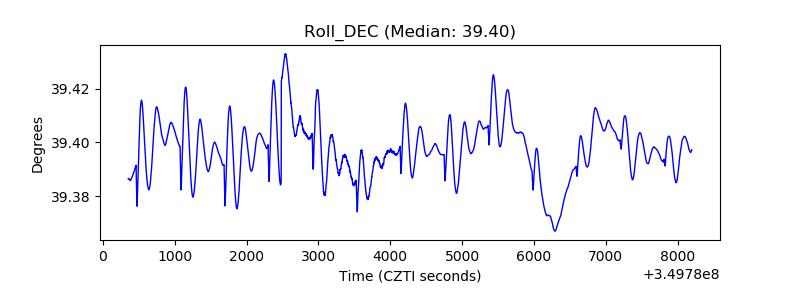 |
| _Roll_RA | 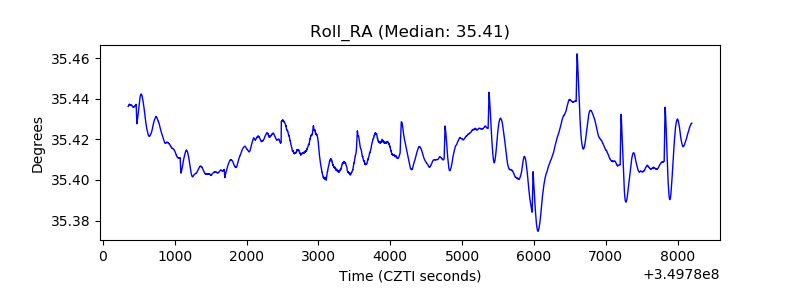 |
| Veto Counter | 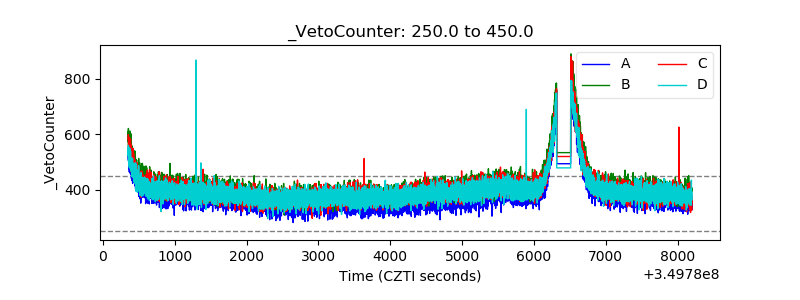 |