| Param | Original file | Final file |
|---|---|---|
| Filename | modeM0/AS1A10_064T01_9000004144_28900cztM0_level2.evt | modeM0/AS1A10_064T01_9000004144_28900cztM0_level2_quad_clean.evt |
| Size (bytes) | 1,424,764,800 | 137,338,560 |
| Size | 1.3 GB | 131.0 MB |
| Events in quadrant A | 5,335,295 | 938,253 |
| Events in quadrant B | 5,429,438 | 949,365 |
| Events in quadrant C | 13,357,880 | 819,646 |
| Events in quadrant D | 18,254,570 | 655,524 |
| Mode M0 | |||
|---|---|---|---|
| Quadrant | BADHDUFLAG | Total packets | Discarded packets |
| A | 0 | 23539 | 2 |
| B | 0 | 23676 | 2 |
| C | 0 | 48034 | 2 |
| D | 0 | 62205 | 2 |
| Mode SS | |||
|---|---|---|---|
| Quadrant | BADHDUFLAG | Total packets | Discarded packets |
| A | 0 | 234 | 0 |
| B | 0 | 234 | 0 |
| C | 0 | 234 | 0 |
| D | 0 | 234 | 0 |
| Mode M9 | |||
|---|---|---|---|
| Quadrant | BADHDUFLAG | Total packets | Discarded packets |
| A | 0 | 10 | 0 |
| B | 0 | 10 | 0 |
| C | 0 | 10 | 0 |
| D | 0 | 10 | 0 |
| Quadrant | Total seconds | Saturated seconds | Saturation percentage |
|---|---|---|---|
| A | 11474 | 144 | 1.255011% |
| B | 11474 | 158 | 1.377026% |
| C | 11474 | 1996 | 17.395851% |
| D | 11474 | 5157 | 44.945093% |
Noise dominated data is calculated using 1-second bins in cleaned event files. If a bin has >2000 counts, and if more than 50% of those come from <1% of pixels, then it is considered to be noise-dominated and hence unusable.
| Quadrant | # 1 sec bins | Bins with >0 counts | Bins with >2000 counts | High rate bins dominated by noise | Noise dominated (total time) | Noise dominated (detector-on time) | Marked lightcurve |
|---|---|---|---|---|---|---|---|
| A | 12444 | 11474 | 0 | 0 | 0.00% | 0.00% | 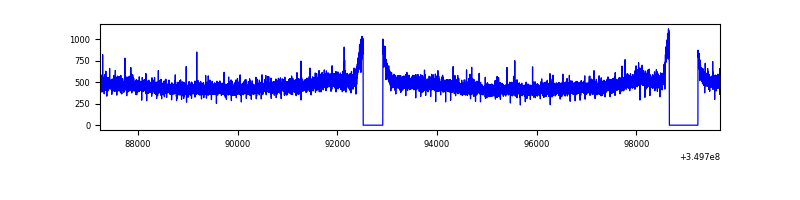 |
| B | 12444 | 11474 | 2 | 2 | 0.02% | 0.02% | 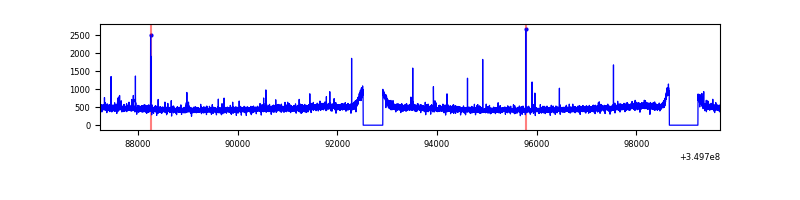 |
| C | 12444 | 11474 | 1244 | 1244 | 10.00% | 10.84% | 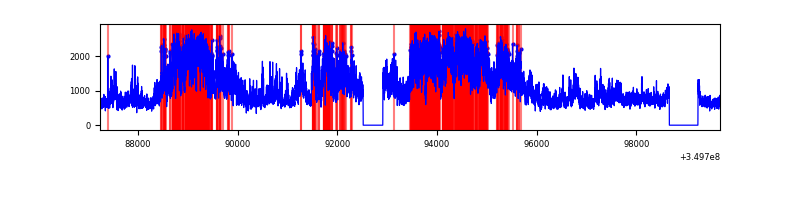 |
| D | 12444 | 11474 | 4969 | 4969 | 39.93% | 43.31% | 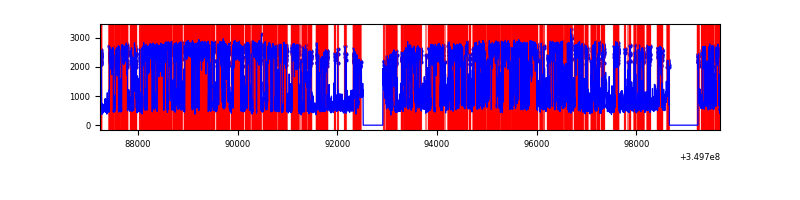 |
Top three noisy pixels from each quadrant. If the there are fewer than three noisy pixels in the level2.evt file, extra rows are filled as -1
| Pixel properties | Quadrant properties | ||||||
|---|---|---|---|---|---|---|---|
| Quadrant | DetID | PixID | Counts | Sigma | Mean | Median | Sigma |
| A | 13 | 254 | 19870 | 66.58 | 1381 | 1347 | 278.2 |
| A | 3 | 137 | 13622 | 44.12 | 1381 | 1347 | 278.2 |
| A | 0 | 226 | 11856 | 37.77 | 1381 | 1347 | 278.2 |
| B | 12 | 111 | 33321 | 121.21 | 1368 | 1330 | 263.9 |
| B | 11 | 111 | 30081 | 108.93 | 1368 | 1330 | 263.9 |
| B | 14 | 111 | 27245 | 98.19 | 1368 | 1330 | 263.9 |
| C | 3 | 233 | 8135505 | 27104.24 | 1273 | 1281 | 300.1 |
| C | 14 | 238 | 213086 | 705.76 | 1273 | 1281 | 300.1 |
| C | 2 | 114 | 26868 | 85.26 | 1273 | 1281 | 300.1 |
| D | 8 | 195 | 12617005 | 47514.58 | 1115 | 1082 | 265.5 |
| D | 1 | 52 | 1381952 | 5200.69 | 1115 | 1082 | 265.5 |
| D | 2 | 234 | 40124 | 147.04 | 1115 | 1082 | 265.5 |
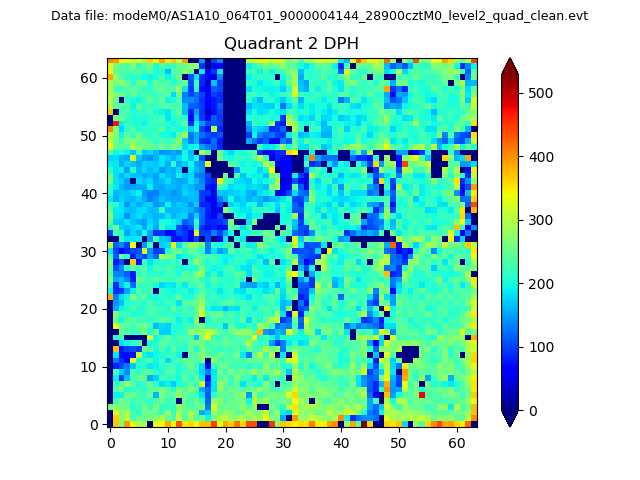
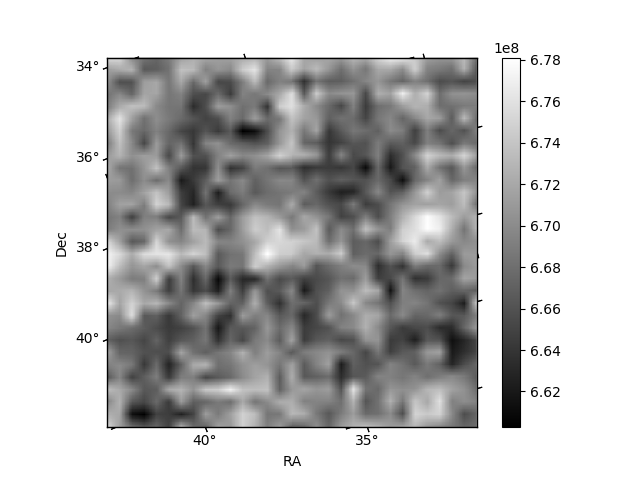
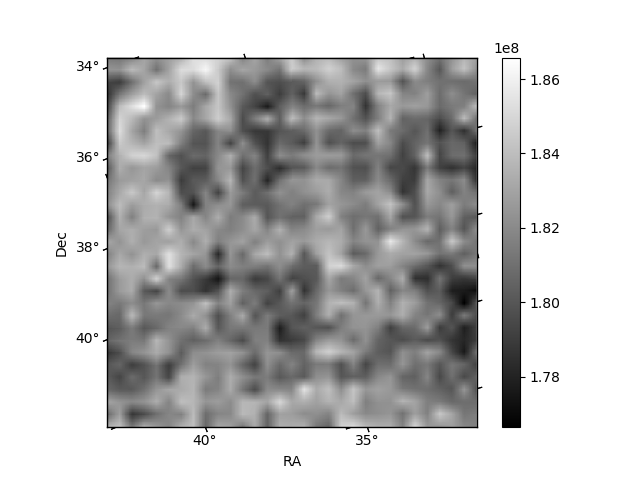
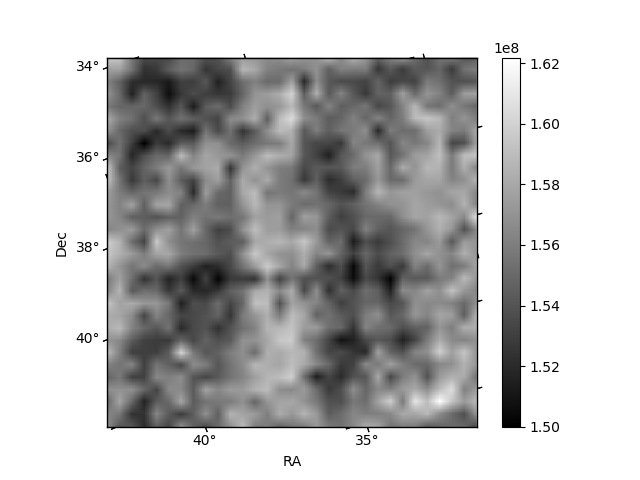
Histogram calculated using DETX and DETY for each event in the final _common_clean file
| Quadrant A | 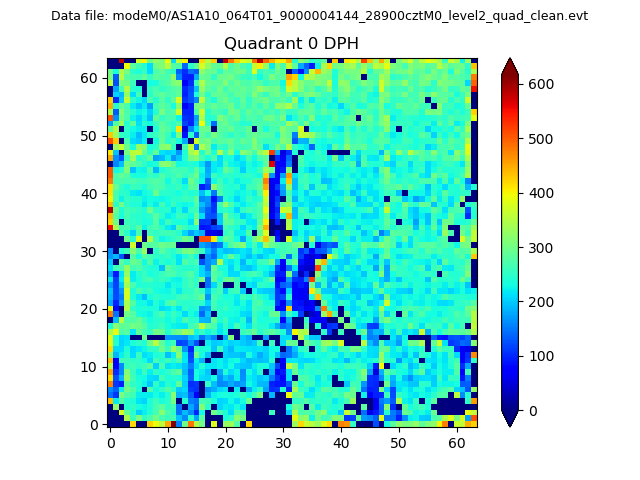 |
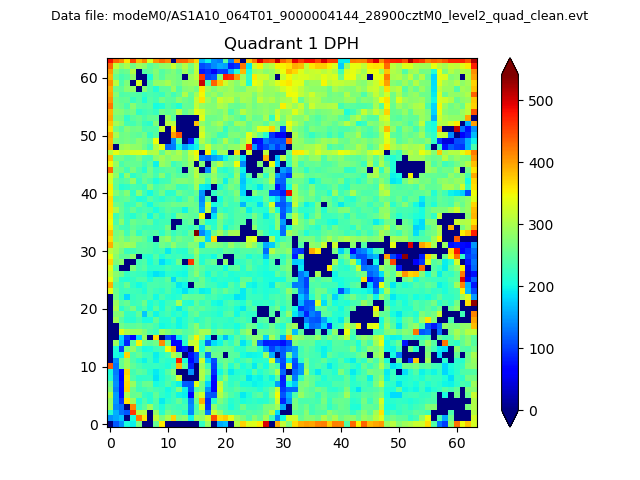 |
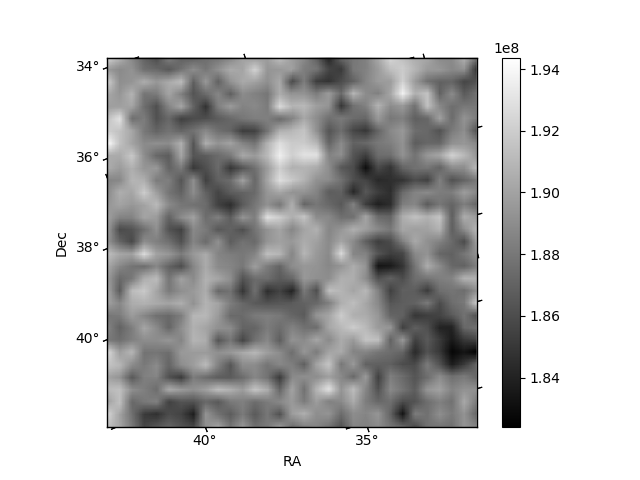
Quadrant B |
|---|---|---|---|
| Quadrant D | 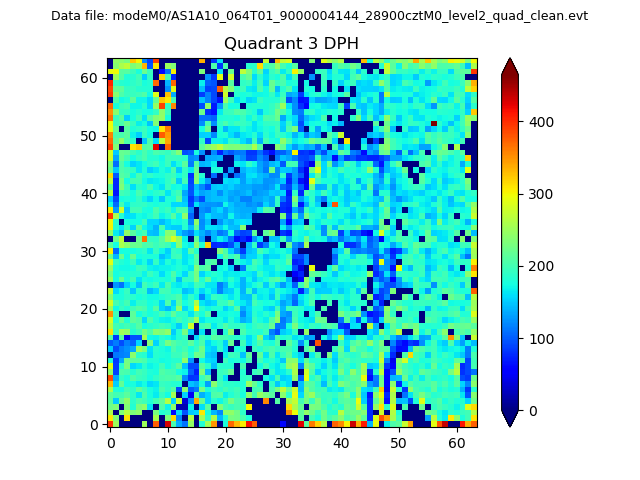 |
 |
Quadrant C |
| Plot type | Count rate plots | Images |
|---|---|---|
| Comparison with Poisson distribution Blue bars denote a histogram of data divided into 1 sec bins. Red curve is a Poisson curve with rate = median count rate of data. |
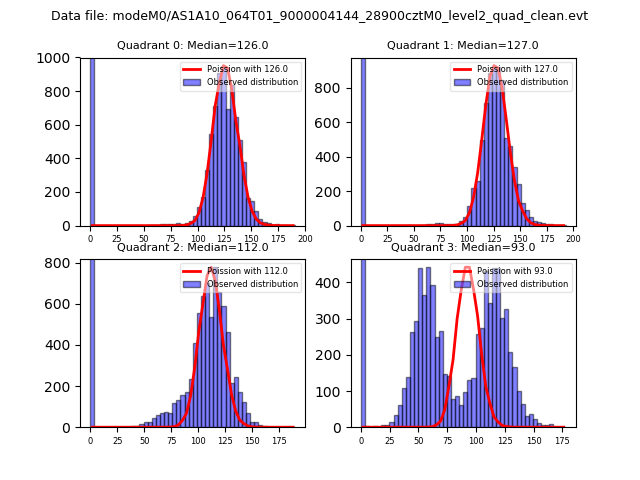 |
 |
| Quadrant-wise count rates Data is divided into 100 sec bins |
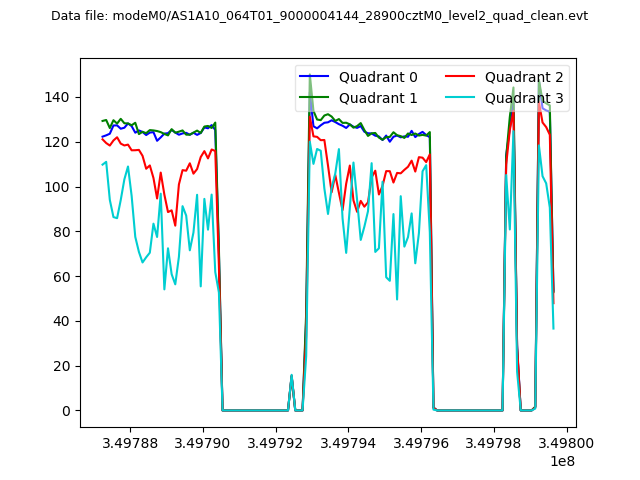 |
|
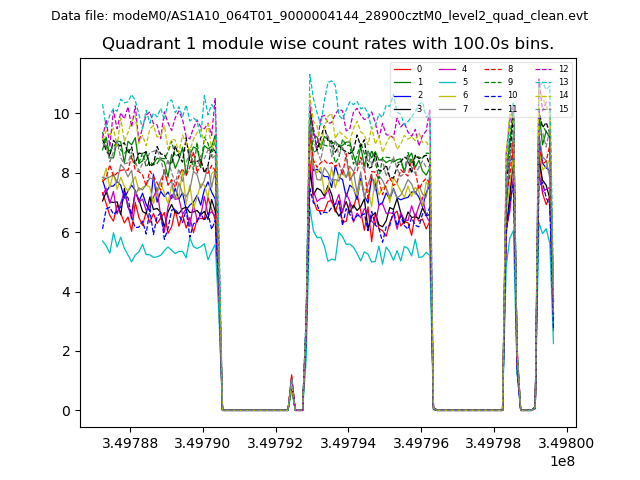
| Module-wise count rates for Quadrant A Data is divided into 100 sec bins |
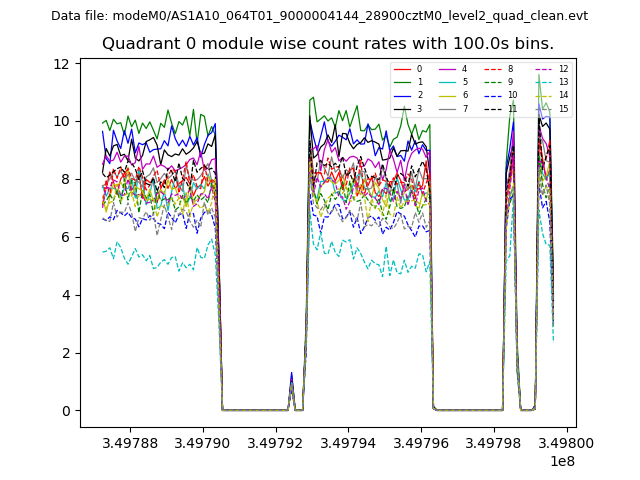 |
 |
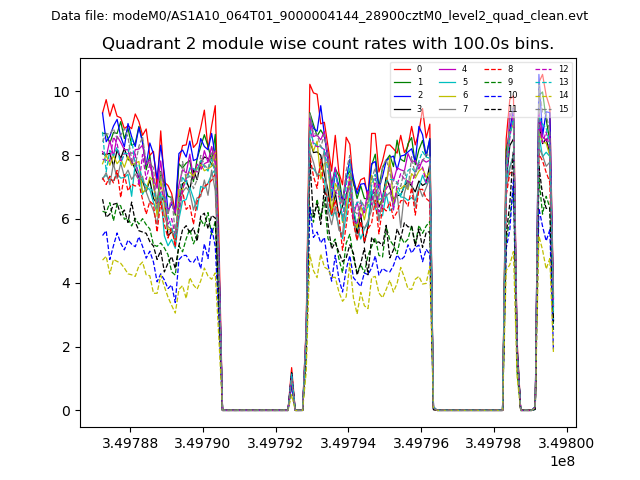
| Module-wise count rates for Quadrant B Data is divided into 100 sec bins |
 |
 |
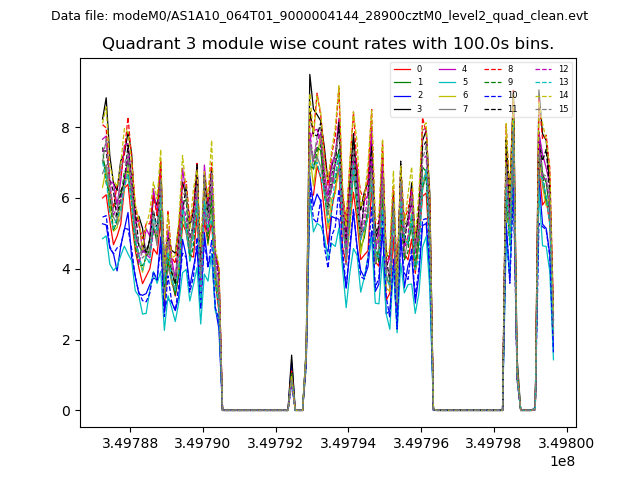
| Module-wise count rates for Quadrant C Data is divided into 100 sec bins |
 |
 |
| Module-wise count rates for Quadrant D Data is divided into 100 sec bins |
 |
 |
| Parameter | Plot |
|---|---|
| CZT HV Monitor | 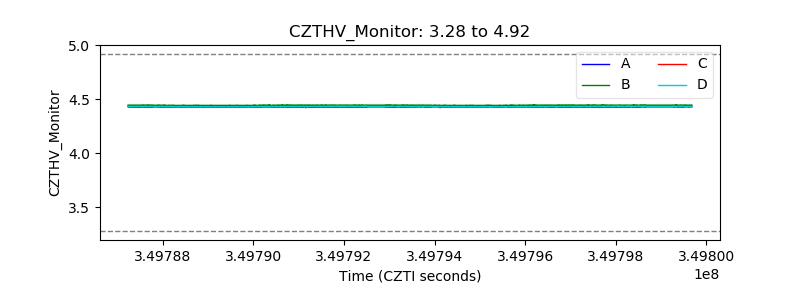 |
| D_VDD | 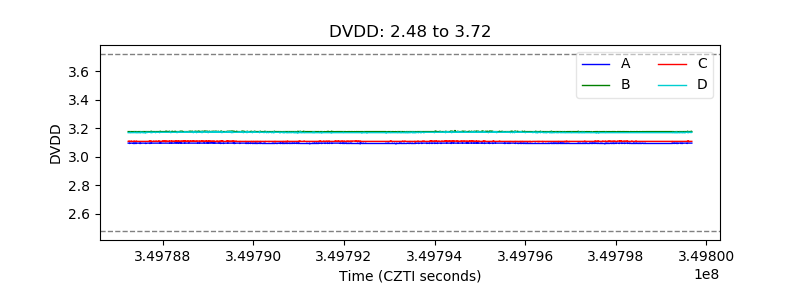 |
| Temperature 1 | 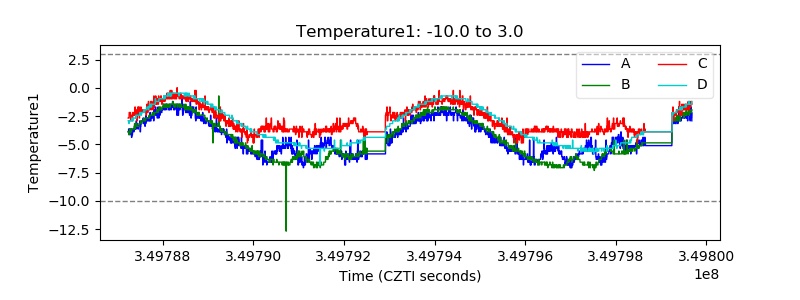 |
| Veto HV Monitor |  |
| Veto LLD | 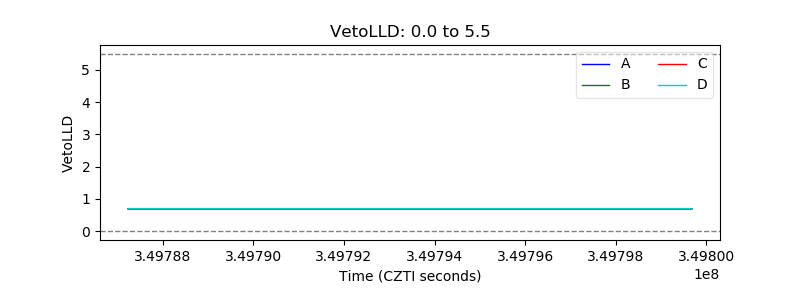 |
| Alpha Counter | 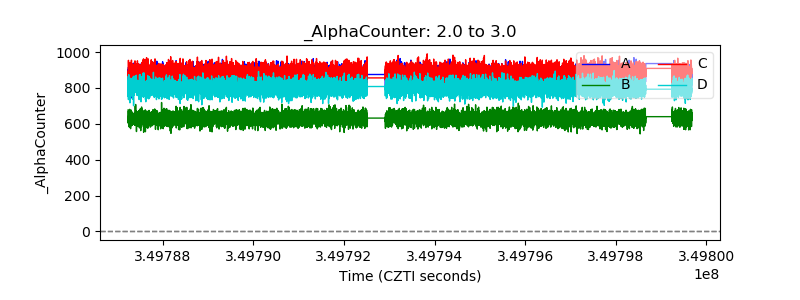 |
| _CPM_Rate | 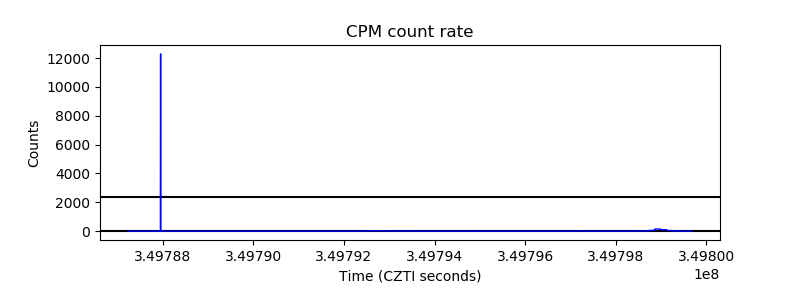 |
| CZT Counter |  |
| +2.5 Volts monitor |  |
| +5 Volts monitor |  |
| _ROLL_ROT | 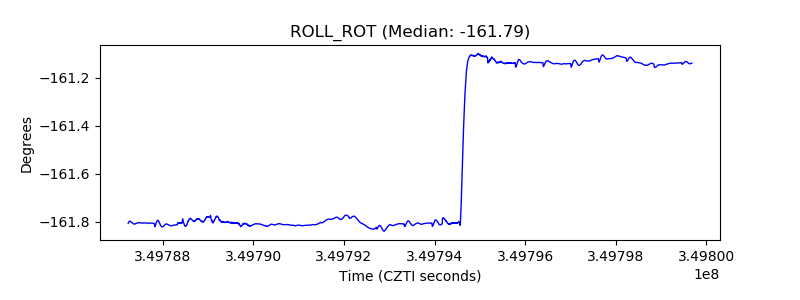 |
| _Roll_DEC |  |
| _Roll_RA | 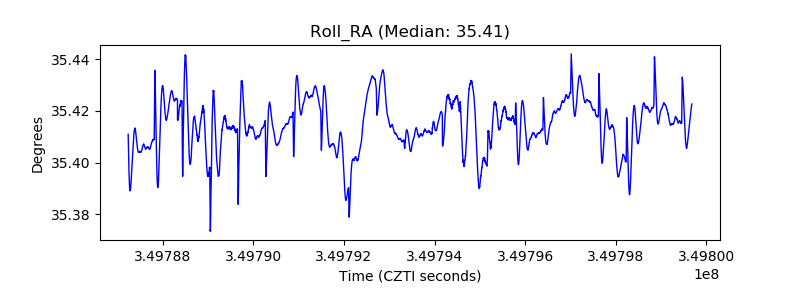 |
| Veto Counter | 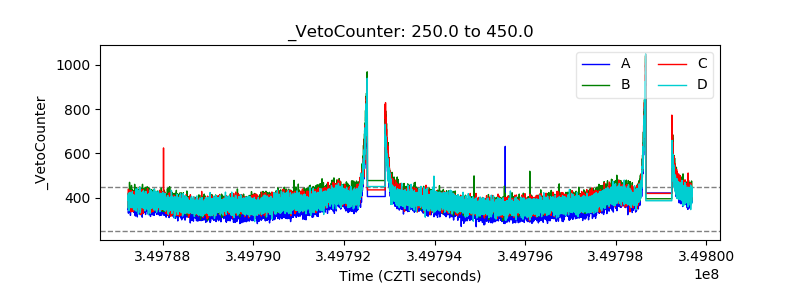 |