| Param | Original file | Final file |
|---|---|---|
| Filename | modeM0/AS1A10_064T01_9000004144_28901cztM0_level2.evt | modeM0/AS1A10_064T01_9000004144_28901cztM0_level2_quad_clean.evt |
| Size (bytes) | 1,271,574,720 | 160,395,840 |
| Size | 1.2 GB | 153.0 MB |
| Events in quadrant A | 5,741,080 | 1,077,761 |
| Events in quadrant B | 5,869,633 | 1,091,442 |
| Events in quadrant C | 10,442,920 | 1,001,673 |
| Events in quadrant D | 15,627,242 | 835,331 |
| Mode M0 | |||
|---|---|---|---|
| Quadrant | BADHDUFLAG | Total packets | Discarded packets |
| A | 0 | 25220 | 2 |
| B | 0 | 25568 | 2 |
| C | 0 | 40007 | 4 |
| D | 0 | 54749 | 2 |
| Mode SS | |||
|---|---|---|---|
| Quadrant | BADHDUFLAG | Total packets | Discarded packets |
| A | 0 | 250 | 0 |
| B | 0 | 250 | 0 |
| C | 0 | 250 | 0 |
| D | 0 | 250 | 0 |
| Mode M9 | |||
|---|---|---|---|
| Quadrant | BADHDUFLAG | Total packets | Discarded packets |
| A | 0 | 17 | 0 |
| B | 0 | 17 | 0 |
| C | 0 | 17 | 0 |
| D | 0 | 17 | 0 |
| Quadrant | Total seconds | Saturated seconds | Saturation percentage |
|---|---|---|---|
| A | 12295 | 56 | 0.455470% |
| B | 12296 | 69 | 0.561158% |
| C | 12295 | 570 | 4.636031% |
| D | 12295 | 4100 | 33.346889% |
Noise dominated data is calculated using 1-second bins in cleaned event files. If a bin has >2000 counts, and if more than 50% of those come from <1% of pixels, then it is considered to be noise-dominated and hence unusable.
| Quadrant | # 1 sec bins | Bins with >0 counts | Bins with >2000 counts | High rate bins dominated by noise | Noise dominated (total time) | Noise dominated (detector-on time) | Marked lightcurve |
|---|---|---|---|---|---|---|---|
| A | 13970 | 12295 | 10 | 10 | 0.07% | 0.08% | 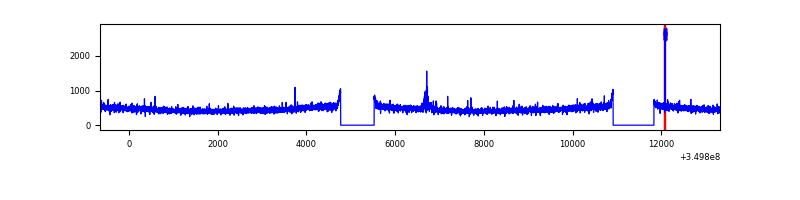 |
| B | 13971 | 12296 | 2 | 2 | 0.01% | 0.02% | 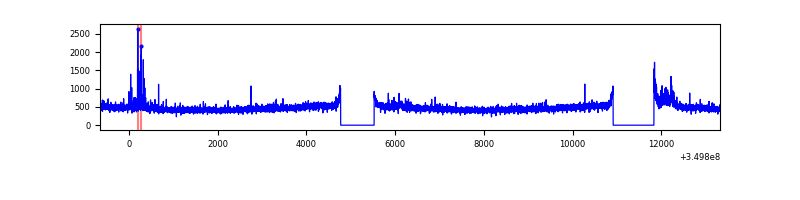 |
| C | 13970 | 12295 | 141 | 141 | 1.01% | 1.15% | 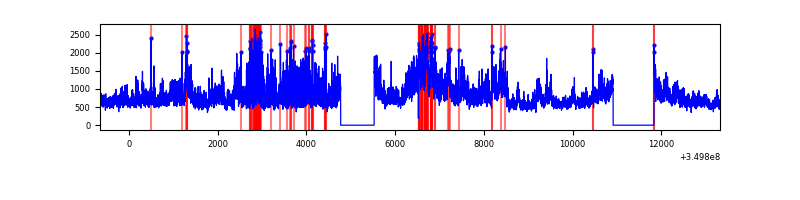 |
| D | 13970 | 12295 | 3919 | 3919 | 28.05% | 31.87% | 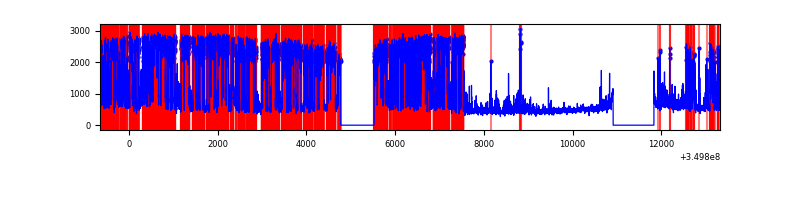 |
Top three noisy pixels from each quadrant. If the there are fewer than three noisy pixels in the level2.evt file, extra rows are filled as -1
| Pixel properties | Quadrant properties | ||||||
|---|---|---|---|---|---|---|---|
| Quadrant | DetID | PixID | Counts | Sigma | Mean | Median | Sigma |
| A | 6 | 16 | 38928 | 127.13 | 1470 | 1439 | 294.9 |
| A | 13 | 170 | 26336 | 84.43 | 1470 | 1439 | 294.9 |
| A | 13 | 254 | 23683 | 75.43 | 1470 | 1439 | 294.9 |
| B | 15 | 33 | 97209 | 342.89 | 1460 | 1421 | 279.4 |
| B | 15 | 32 | 48234 | 167.58 | 1460 | 1421 | 279.4 |
| B | 12 | 111 | 34522 | 118.49 | 1460 | 1421 | 279.4 |
| C | 3 | 233 | 4671242 | 14284.86 | 1396 | 1405 | 326.9 |
| C | 14 | 238 | 230486 | 700.75 | 1396 | 1405 | 326.9 |
| C | 15 | 208 | 61602 | 184.14 | 1396 | 1405 | 326.9 |
| D | 8 | 195 | 9241572 | 30980.37 | 1260 | 1227 | 298.3 |
| D | 1 | 52 | 1582169 | 5300.47 | 1260 | 1227 | 298.3 |
| D | 2 | 234 | 42648 | 138.87 | 1260 | 1227 | 298.3 |
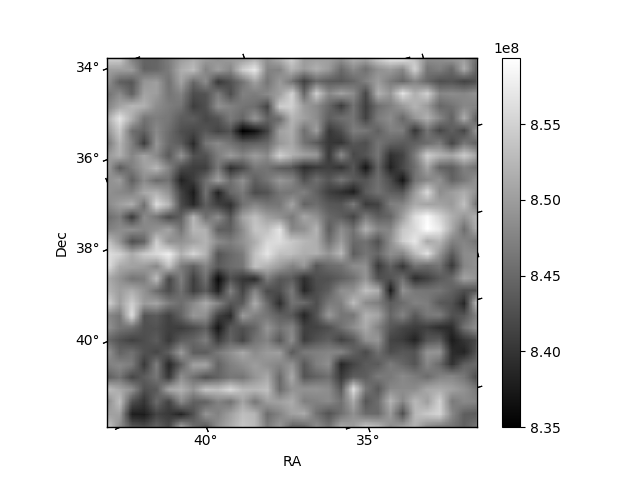
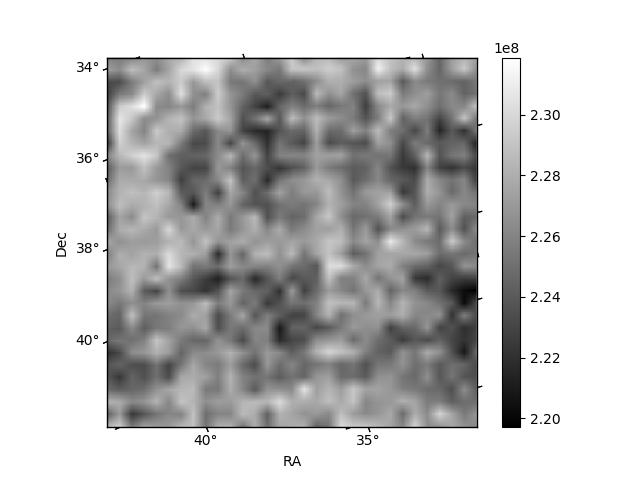
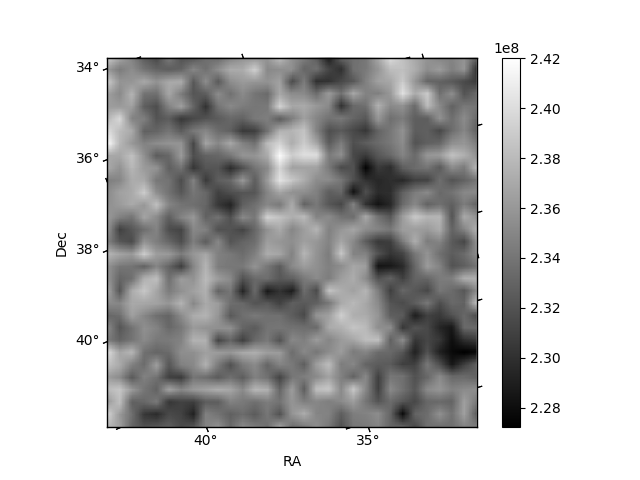
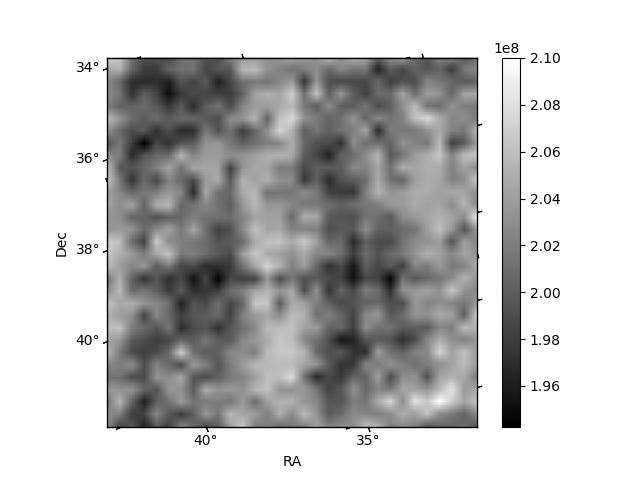
Histogram calculated using DETX and DETY for each event in the final _common_clean file
| Quadrant A | 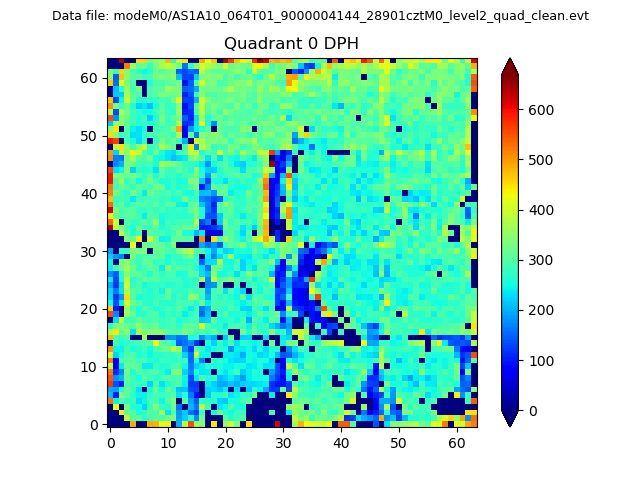 |
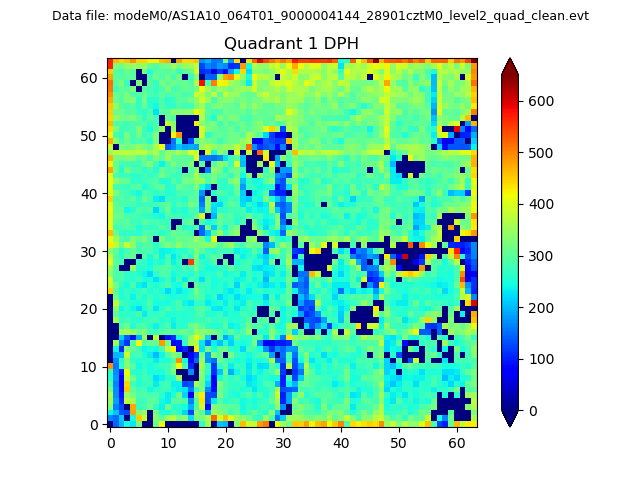 |
Quadrant B |
|---|---|---|---|
| Quadrant D |  |
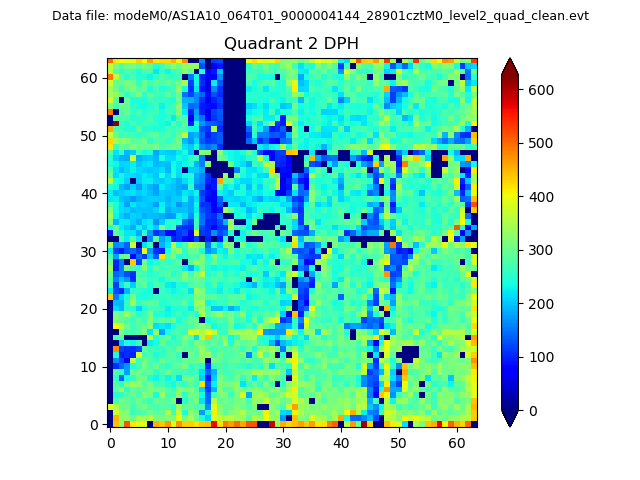 |
Quadrant C |
| Plot type | Count rate plots | Images |
|---|---|---|
| Comparison with Poisson distribution Blue bars denote a histogram of data divided into 1 sec bins. Red curve is a Poisson curve with rate = median count rate of data. |
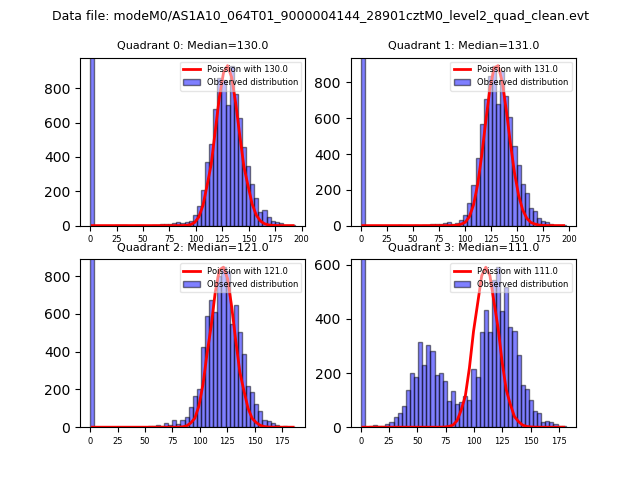 |
 |
| Quadrant-wise count rates Data is divided into 100 sec bins |
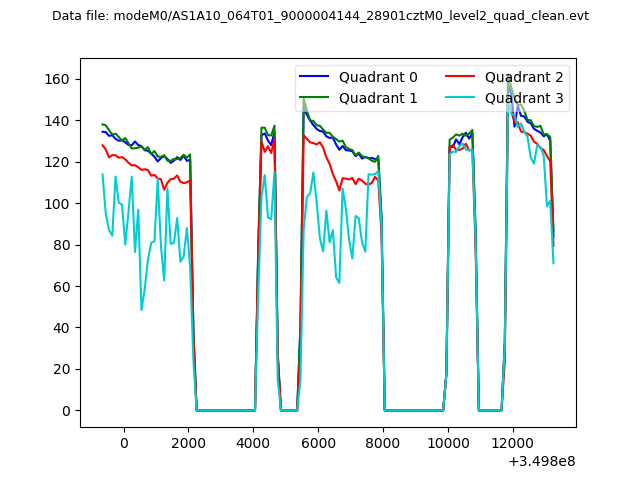 |
|
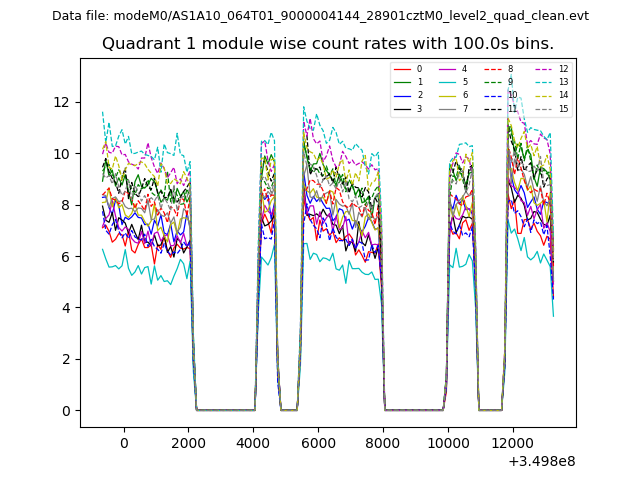
| Module-wise count rates for Quadrant A Data is divided into 100 sec bins |
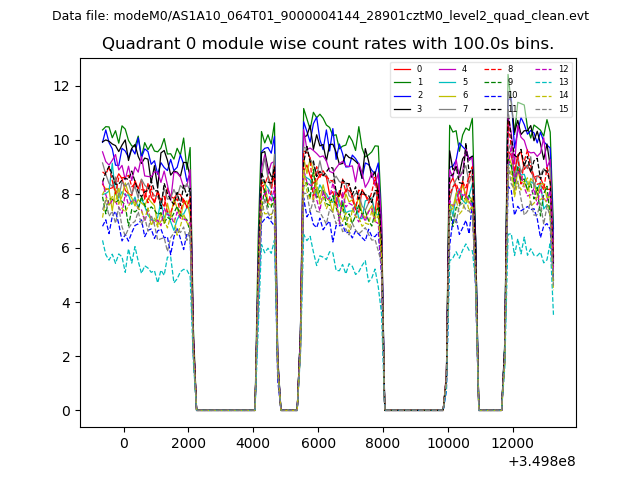 |
 |
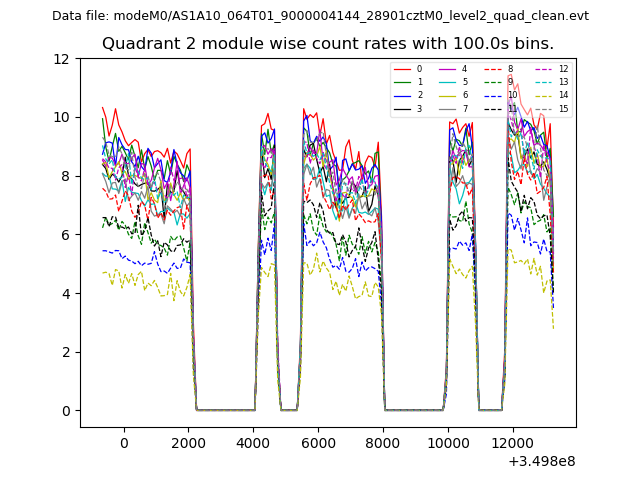
| Module-wise count rates for Quadrant B Data is divided into 100 sec bins |
 |
 |
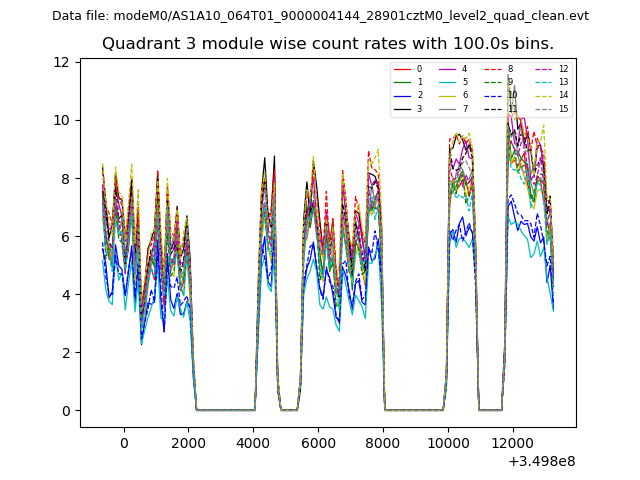
| Module-wise count rates for Quadrant C Data is divided into 100 sec bins |
 |
 |
| Module-wise count rates for Quadrant D Data is divided into 100 sec bins |
 |
 |
| Parameter | Plot |
|---|---|
| CZT HV Monitor | 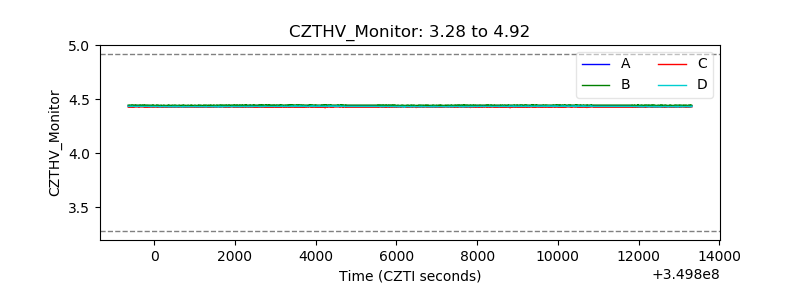 |
| D_VDD | 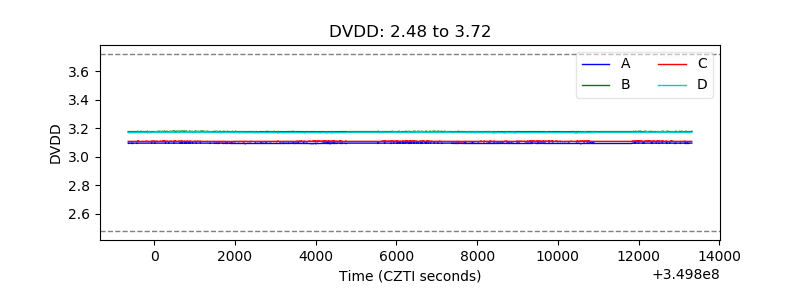 |
| Temperature 1 | 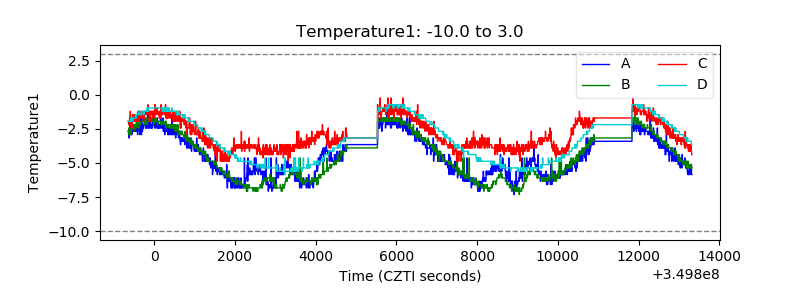 |
| Veto HV Monitor | 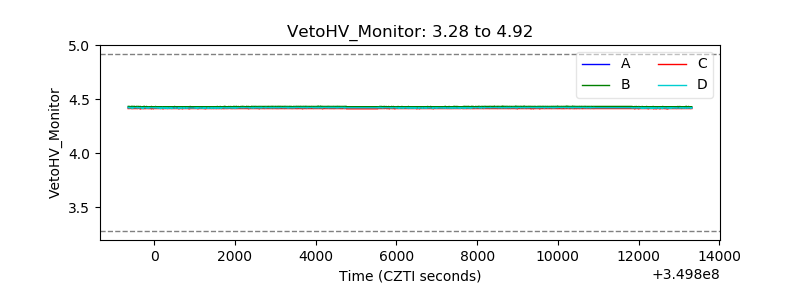 |
| Veto LLD |  |
| Alpha Counter | 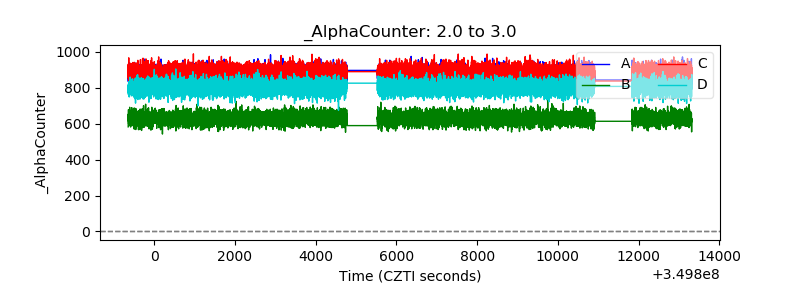 |
| _CPM_Rate | 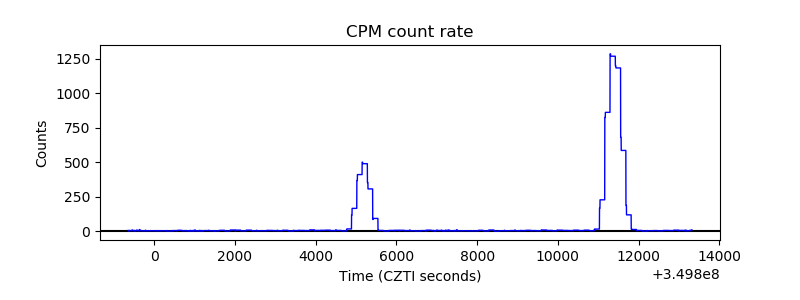 |
| CZT Counter | 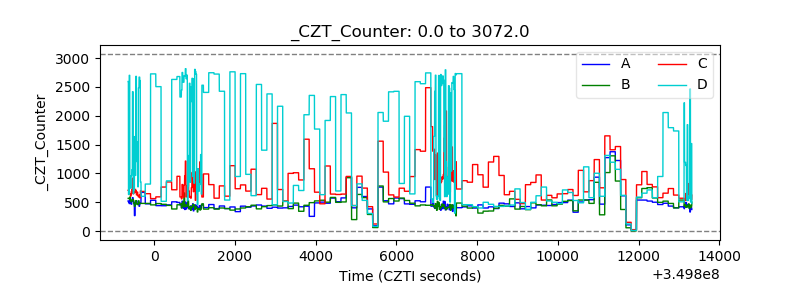 |
| +2.5 Volts monitor |  |
| +5 Volts monitor |  |
| _ROLL_ROT | 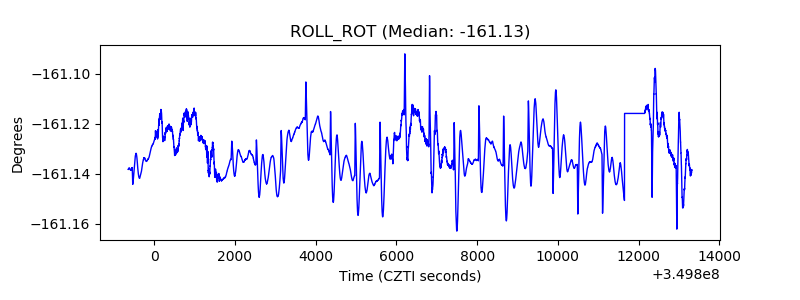 |
| _Roll_DEC | 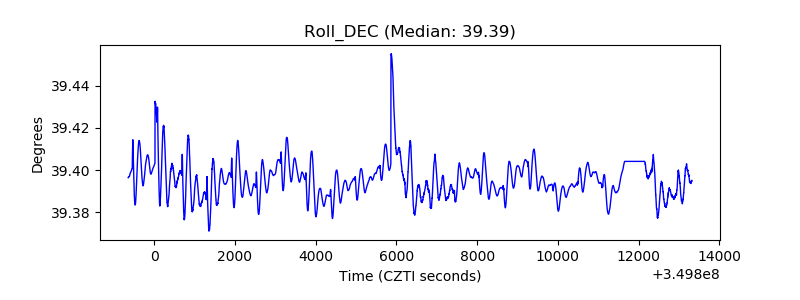 |
| _Roll_RA | 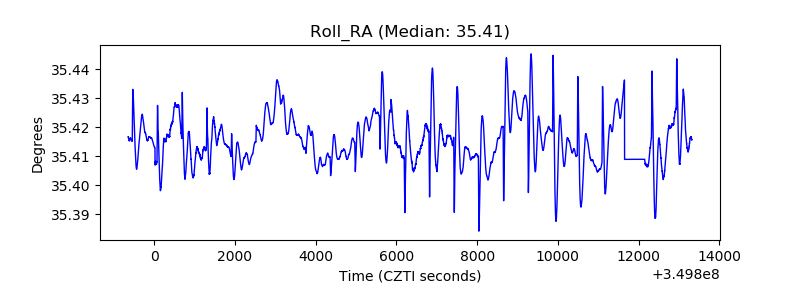 |
| Veto Counter | 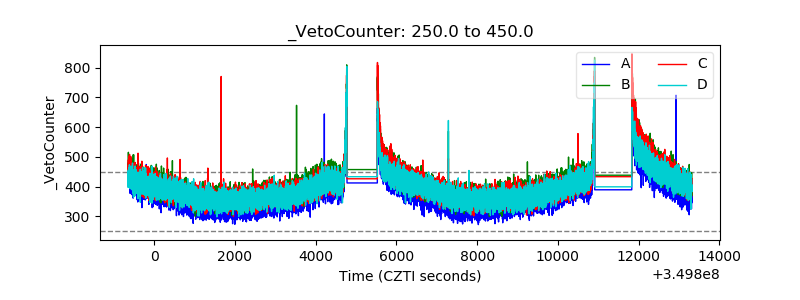 |