| Param | Original file | Final file |
|---|---|---|
| Filename | modeM0/AS1A10_064T01_9000004144_28902cztM0_level2.evt | modeM0/AS1A10_064T01_9000004144_28902cztM0_level2_quad_clean.evt |
| Size (bytes) | 529,323,840 | 96,814,080 |
| Size | 504.8 MB | 92.3 MB |
| Events in quadrant A | 3,134,492 | 634,774 |
| Events in quadrant B | 3,253,599 | 648,617 |
| Events in quadrant C | 4,557,326 | 601,994 |
| Events in quadrant D | 4,639,987 | 588,621 |
| Mode M0 | |||
|---|---|---|---|
| Quadrant | BADHDUFLAG | Total packets | Discarded packets |
| A | 0 | 13580 | 2 |
| B | 0 | 14001 | 2 |
| C | 0 | 18153 | 2 |
| D | 0 | 18234 | 8 |
| Mode SS | |||
|---|---|---|---|
| Quadrant | BADHDUFLAG | Total packets | Discarded packets |
| A | 0 | 132 | 0 |
| B | 0 | 132 | 0 |
| C | 0 | 132 | 0 |
| D | 0 | 132 | 0 |
| Mode M9 | |||
|---|---|---|---|
| Quadrant | BADHDUFLAG | Total packets | Discarded packets |
| A | 0 | 11 | 0 |
| B | 0 | 12 | 0 |
| C | 0 | 12 | 0 |
| D | 0 | 12 | 0 |
| Quadrant | Total seconds | Saturated seconds | Saturation percentage |
|---|---|---|---|
| A | 6569 | 40 | 0.608921% |
| B | 6569 | 49 | 0.745928% |
| C | 6569 | 165 | 2.511798% |
| D | 6568 | 407 | 6.196711% |
Noise dominated data is calculated using 1-second bins in cleaned event files. If a bin has >2000 counts, and if more than 50% of those come from <1% of pixels, then it is considered to be noise-dominated and hence unusable.
| Quadrant | # 1 sec bins | Bins with >0 counts | Bins with >2000 counts | High rate bins dominated by noise | Noise dominated (total time) | Noise dominated (detector-on time) | Marked lightcurve |
|---|---|---|---|---|---|---|---|
| A | 7633 | 6568 | 10 | 10 | 0.13% | 0.15% | 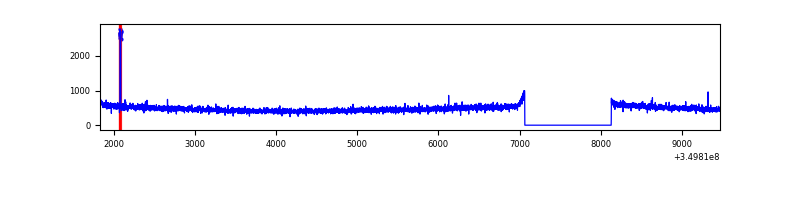 |
| B | 7634 | 6569 | 1 | 1 | 0.01% | 0.02% | 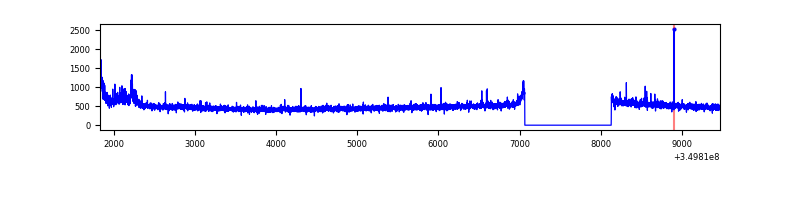 |
| C | 7634 | 6569 | 5 | 5 | 0.07% | 0.08% | 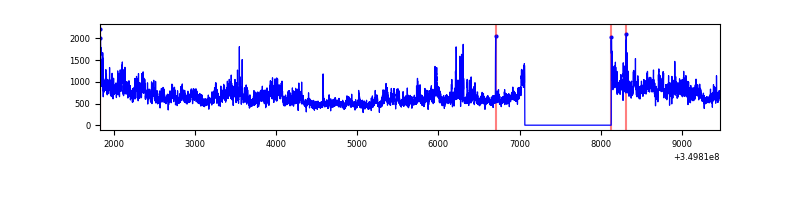 |
| D | 7632 | 6567 | 297 | 297 | 3.89% | 4.52% | 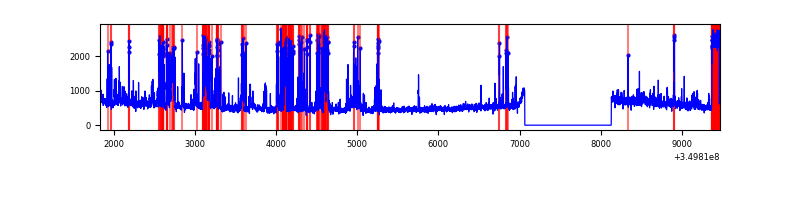 |
Top three noisy pixels from each quadrant. If the there are fewer than three noisy pixels in the level2.evt file, extra rows are filled as -1
| Pixel properties | Quadrant properties | ||||||
|---|---|---|---|---|---|---|---|
| Quadrant | DetID | PixID | Counts | Sigma | Mean | Median | Sigma |
| A | 13 | 170 | 25776 | 154.67 | 804 | 785 | 161.6 |
| A | 13 | 254 | 13061 | 75.98 | 804 | 785 | 161.6 |
| A | 3 | 137 | 7614 | 42.26 | 804 | 785 | 161.6 |
| B | 15 | 33 | 88850 | 577.08 | 802 | 780 | 152.6 |
| B | 12 | 111 | 18441 | 115.72 | 802 | 780 | 152.6 |
| B | 11 | 111 | 16773 | 104.79 | 802 | 780 | 152.6 |
| C | 3 | 233 | 1385496 | 7650.4 | 775 | 779 | 181.0 |
| C | 14 | 238 | 124263 | 682.23 | 775 | 779 | 181.0 |
| C | 2 | 114 | 15759 | 82.76 | 775 | 779 | 181.0 |
| D | 1 | 52 | 1104133 | 5988.77 | 770 | 747 | 184.2 |
| D | 8 | 195 | 583229 | 3161.49 | 770 | 747 | 184.2 |
| D | 2 | 234 | 26701 | 140.87 | 770 | 747 | 184.2 |
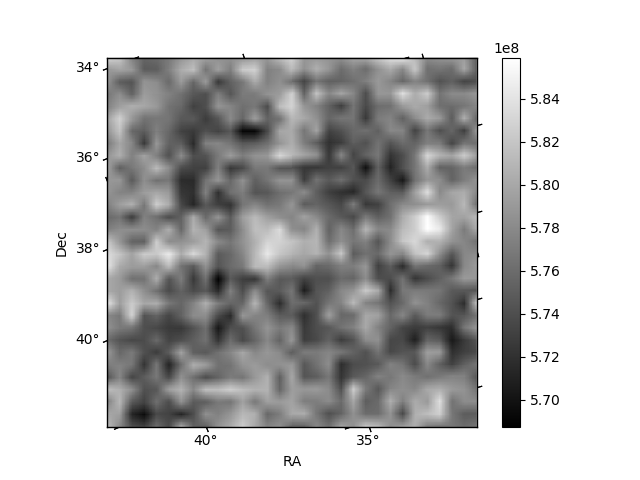
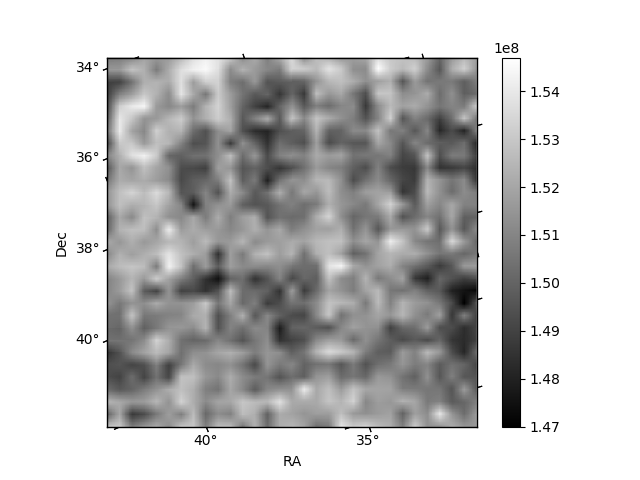
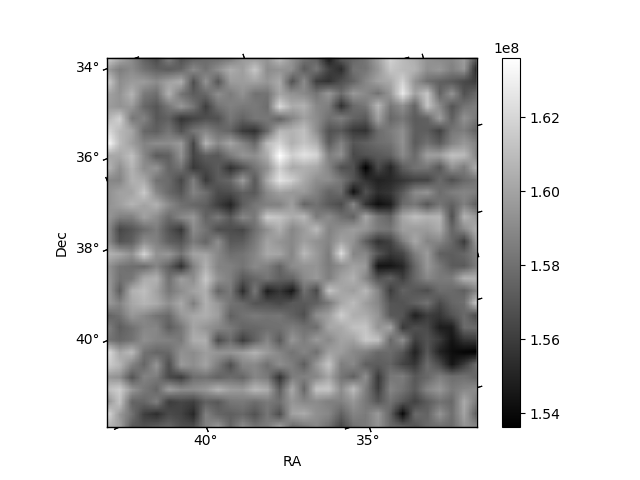
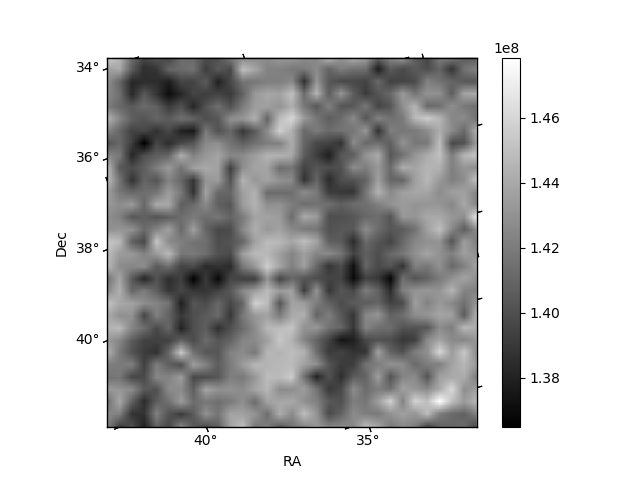
Histogram calculated using DETX and DETY for each event in the final _common_clean file
| Quadrant A | 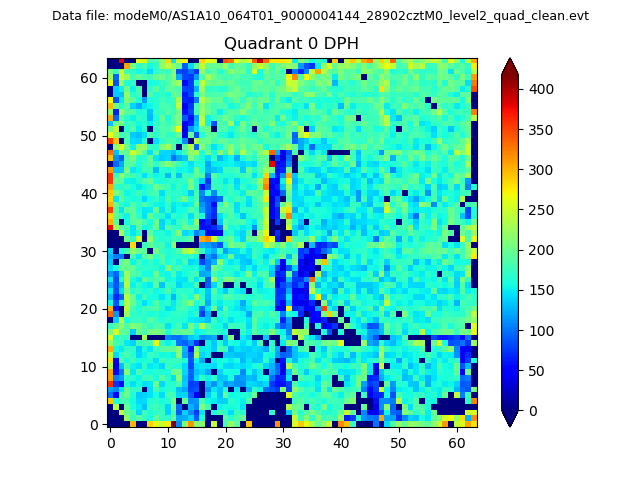 |
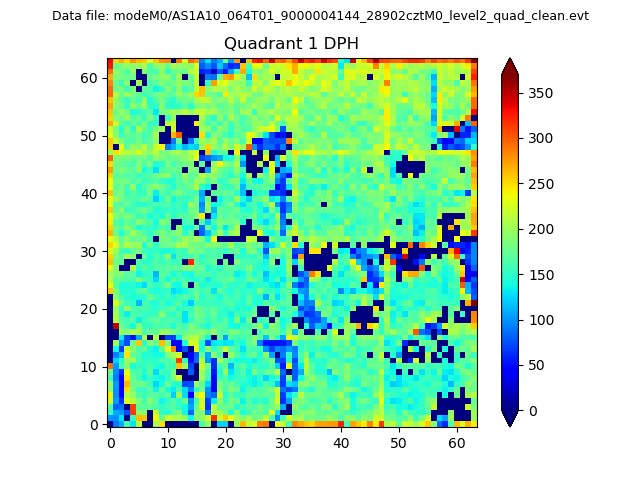 |
Quadrant B |
|---|---|---|---|
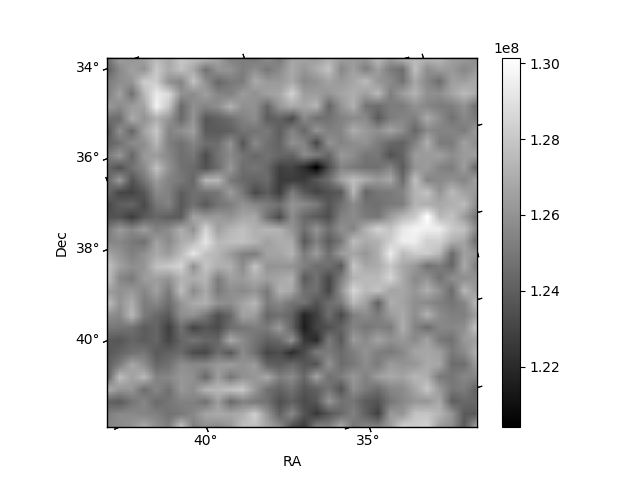
| Quadrant D |  |
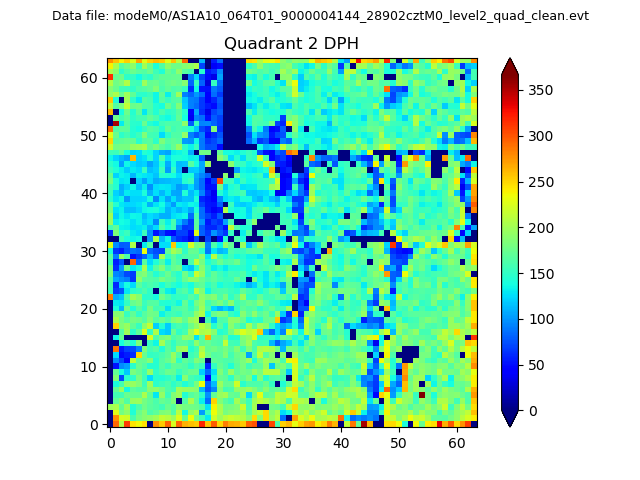 |
Quadrant C |
| Plot type | Count rate plots | Images |
|---|---|---|
| Comparison with Poisson distribution Blue bars denote a histogram of data divided into 1 sec bins. Red curve is a Poisson curve with rate = median count rate of data. |
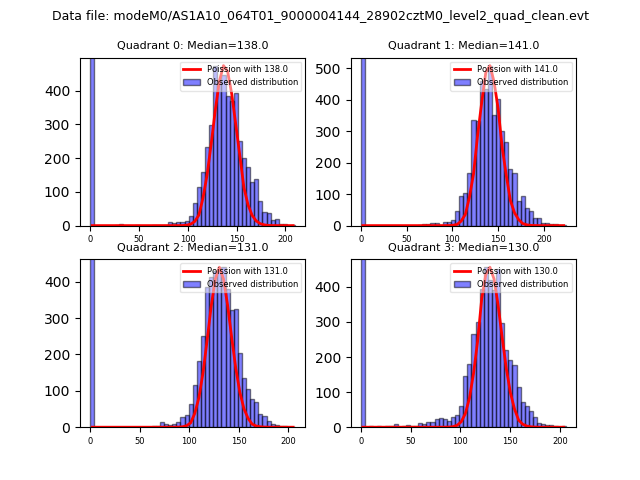 |
 |
| Quadrant-wise count rates Data is divided into 100 sec bins |
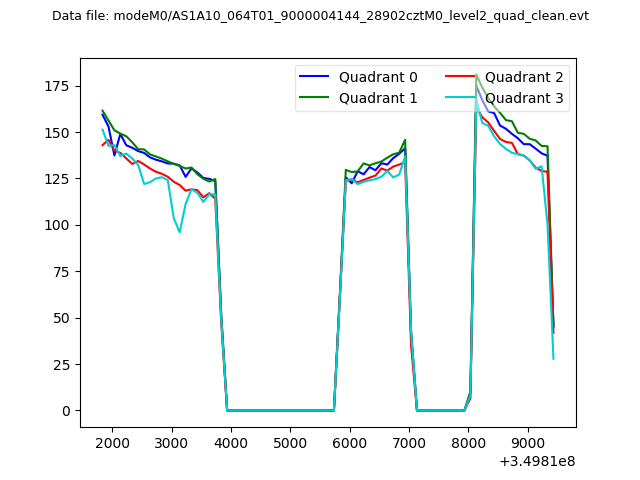 |
|
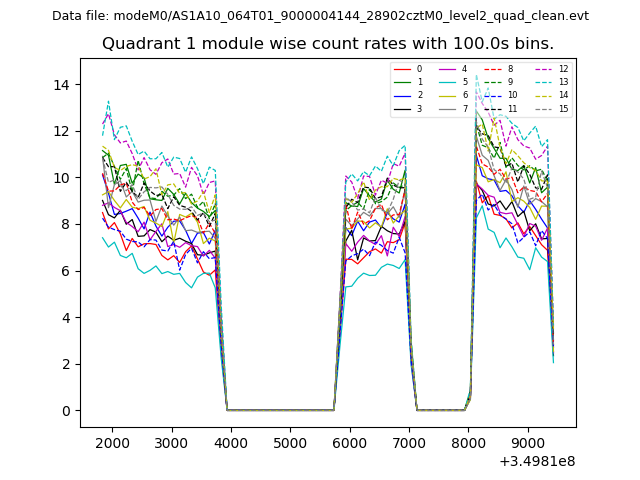
| Module-wise count rates for Quadrant A Data is divided into 100 sec bins |
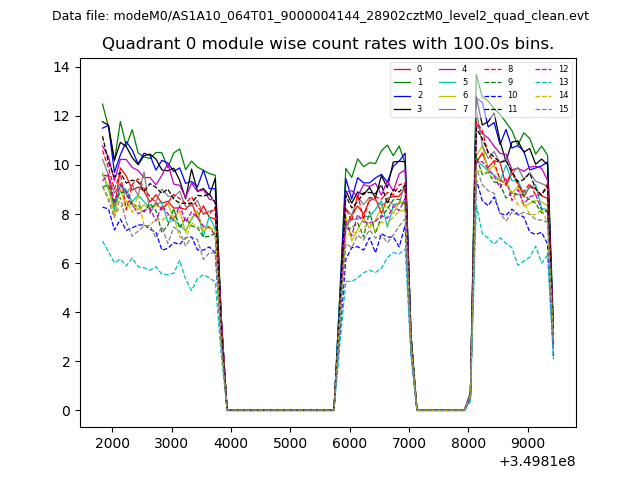 |
 |
| Module-wise count rates for Quadrant B Data is divided into 100 sec bins |
 |
 |
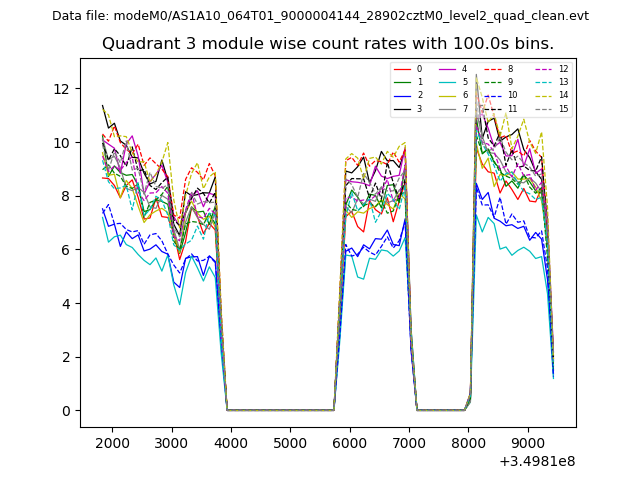
| Module-wise count rates for Quadrant C Data is divided into 100 sec bins |
 |
 |
| Module-wise count rates for Quadrant D Data is divided into 100 sec bins |
 |
 |
| Parameter | Plot |
|---|---|
| CZT HV Monitor |  |
| D_VDD | 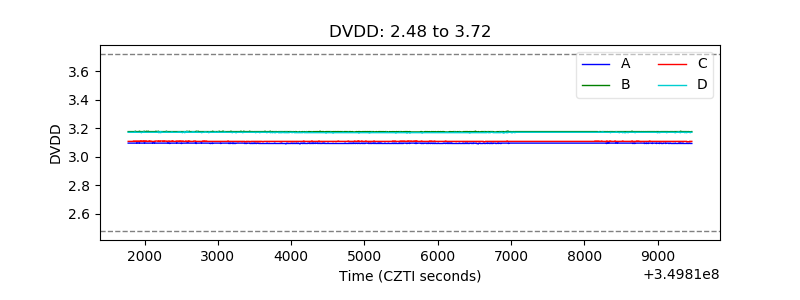 |
| Temperature 1 |  |
| Veto HV Monitor | 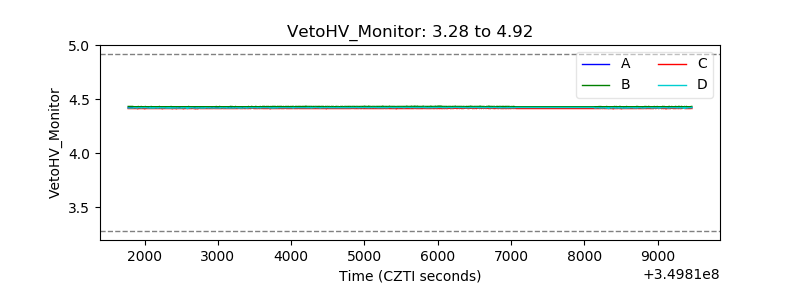 |
| Veto LLD | 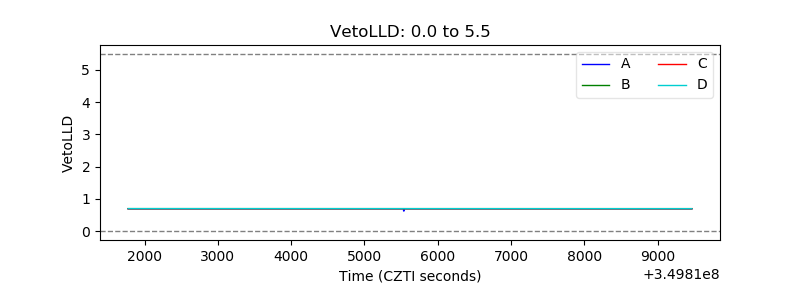 |
| Alpha Counter | 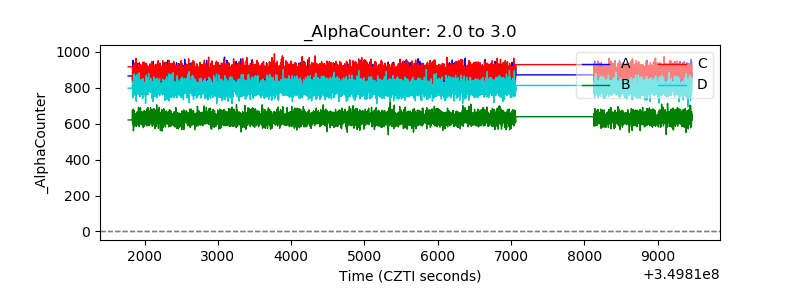 |
| _CPM_Rate | 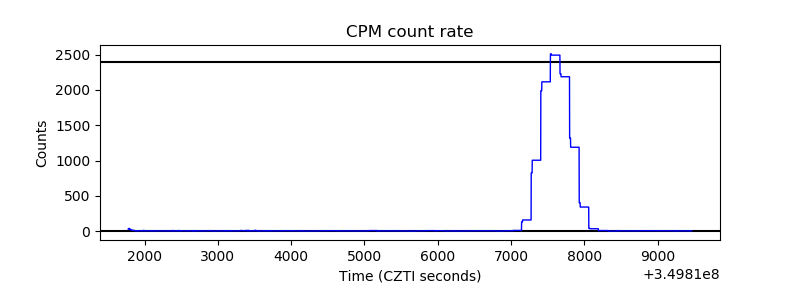 |
| CZT Counter | 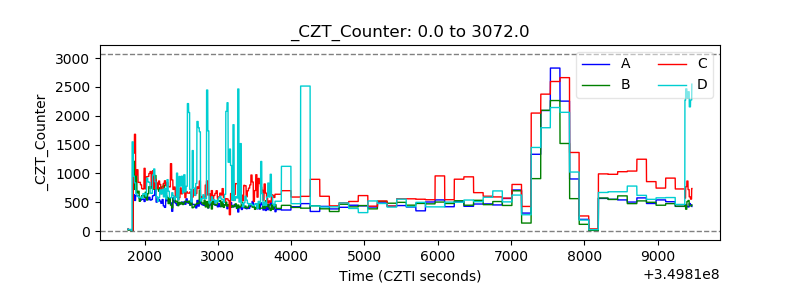 |
| +2.5 Volts monitor |  |
| +5 Volts monitor |  |
| _ROLL_ROT | 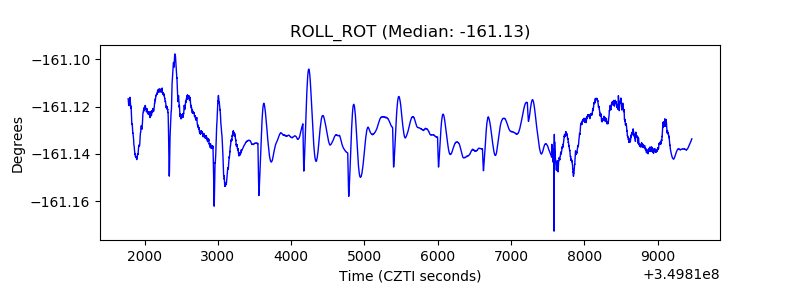 |
| _Roll_DEC | 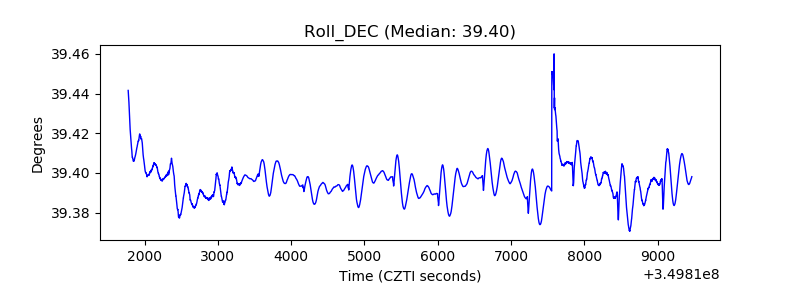 |
| _Roll_RA | 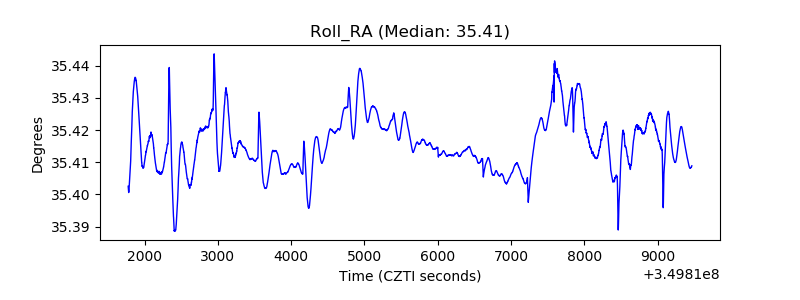 |
| Veto Counter | 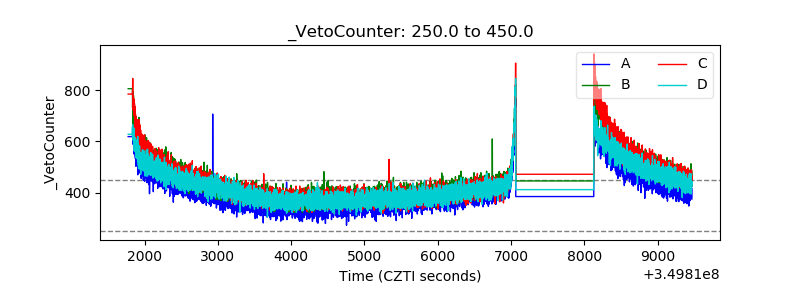 |