| Param | Original file | Final file |
|---|---|---|
| Filename | modeM0/AS1A10_064T01_9000004144_28904cztM0_level2.evt | modeM0/AS1A10_064T01_9000004144_28904cztM0_level2_quad_clean.evt |
| Size (bytes) | 790,433,280 | 92,617,920 |
| Size | 753.8 MB | 88.3 MB |
| Events in quadrant A | 3,093,303 | 624,041 |
| Events in quadrant B | 3,429,197 | 646,282 |
| Events in quadrant C | 6,772,099 | 585,946 |
| Events in quadrant D | 10,213,358 | 502,684 |
| Mode M0 | |||
|---|---|---|---|
| Quadrant | BADHDUFLAG | Total packets | Discarded packets |
| A | 0 | 13272 | 2 |
| B | 0 | 14218 | 2 |
| C | 0 | 24760 | 5 |
| D | 0 | 34732 | 2 |
| Mode SS | |||
|---|---|---|---|
| Quadrant | BADHDUFLAG | Total packets | Discarded packets |
| A | 0 | 130 | 0 |
| B | 0 | 130 | 0 |
| C | 0 | 130 | 0 |
| D | 0 | 130 | 0 |
| Mode M9 | |||
|---|---|---|---|
| Quadrant | BADHDUFLAG | Total packets | Discarded packets |
| A | 0 | 15 | 0 |
| B | 0 | 16 | 0 |
| C | 0 | 16 | 0 |
| D | 0 | 16 | 0 |
| Quadrant | Total seconds | Saturated seconds | Saturation percentage |
|---|---|---|---|
| A | 6378 | 9 | 0.141110% |
| B | 6378 | 133 | 2.085293% |
| C | 6377 | 453 | 7.103654% |
| D | 6377 | 2846 | 44.629136% |
Noise dominated data is calculated using 1-second bins in cleaned event files. If a bin has >2000 counts, and if more than 50% of those come from <1% of pixels, then it is considered to be noise-dominated and hence unusable.
| Quadrant | # 1 sec bins | Bins with >0 counts | Bins with >2000 counts | High rate bins dominated by noise | Noise dominated (total time) | Noise dominated (detector-on time) | Marked lightcurve |
|---|---|---|---|---|---|---|---|
| A | 7577 | 6378 | 0 | 0 | 0.00% | 0.00% | 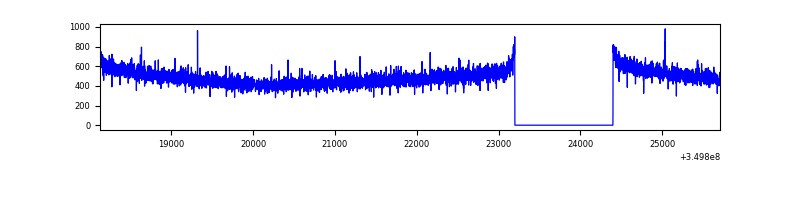 |
| B | 7577 | 6378 | 117 | 117 | 1.54% | 1.83% |  |
| C | 7577 | 6377 | 110 | 110 | 1.45% | 1.72% |  |
| D | 7577 | 6377 | 3139 | 3139 | 41.43% | 49.22% |  |
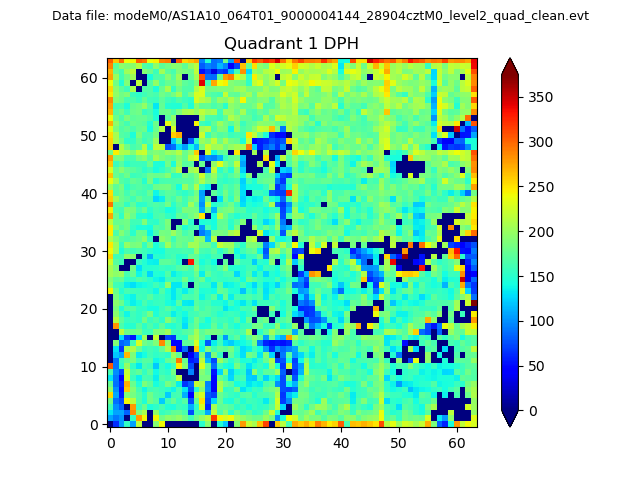
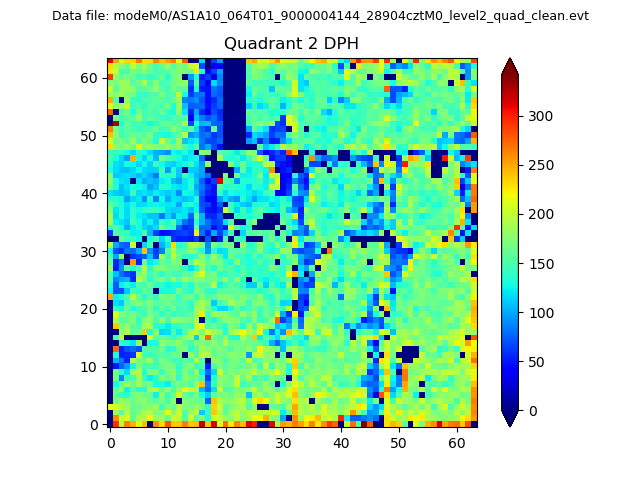
Top three noisy pixels from each quadrant. If the there are fewer than three noisy pixels in the level2.evt file, extra rows are filled as -1
| Pixel properties | Quadrant properties | ||||||
|---|---|---|---|---|---|---|---|
| Quadrant | DetID | PixID | Counts | Sigma | Mean | Median | Sigma |
| A | 13 | 254 | 12011 | 70.94 | 799 | 784 | 158.3 |
| A | 3 | 137 | 7607 | 43.11 | 799 | 784 | 158.3 |
| A | 0 | 226 | 6923 | 38.79 | 799 | 784 | 158.3 |
| B | 0 | 229 | 279728 | 1871.77 | 796 | 777 | 149.0 |
| B | 12 | 111 | 17831 | 114.43 | 796 | 777 | 149.0 |
| B | 11 | 111 | 16463 | 105.25 | 796 | 777 | 149.0 |
| C | 3 | 233 | 3624075 | 20344.88 | 767 | 773 | 178.1 |
| C | 14 | 238 | 129259 | 721.45 | 767 | 773 | 178.1 |
| C | 2 | 114 | 15146 | 80.7 | 767 | 773 | 178.1 |
| D | 8 | 195 | 7088664 | 42307.75 | 697 | 676 | 167.5 |
| D | 1 | 52 | 470436 | 2803.96 | 697 | 676 | 167.5 |
| D | 2 | 234 | 25305 | 147.01 | 697 | 676 | 167.5 |
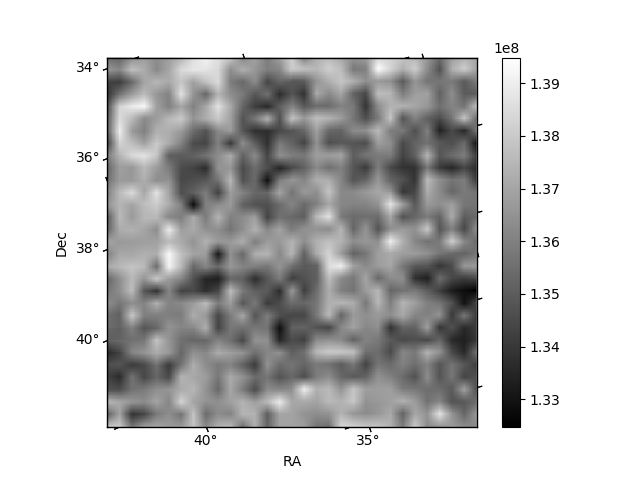
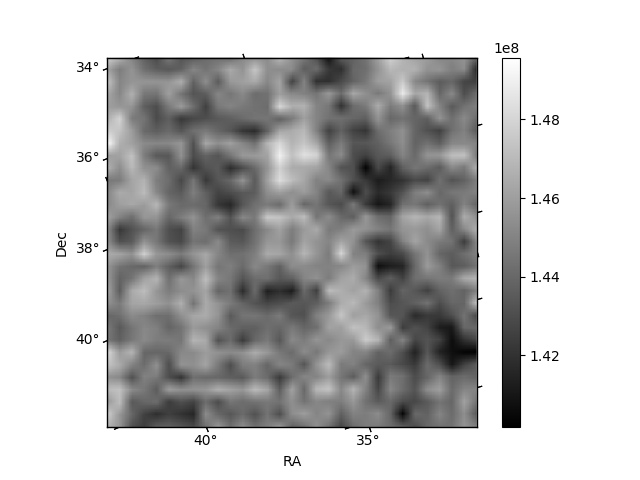
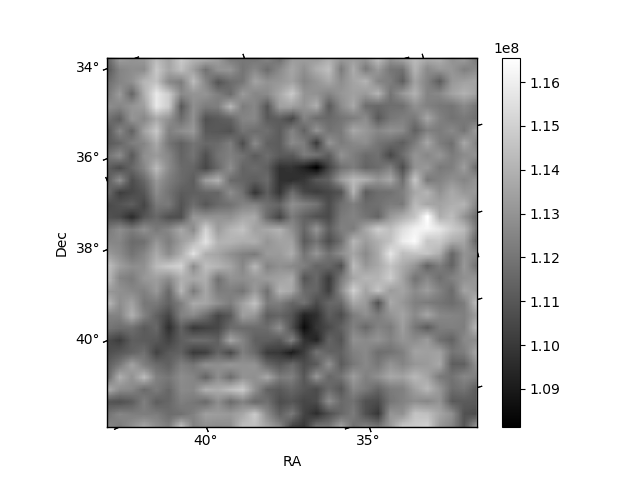
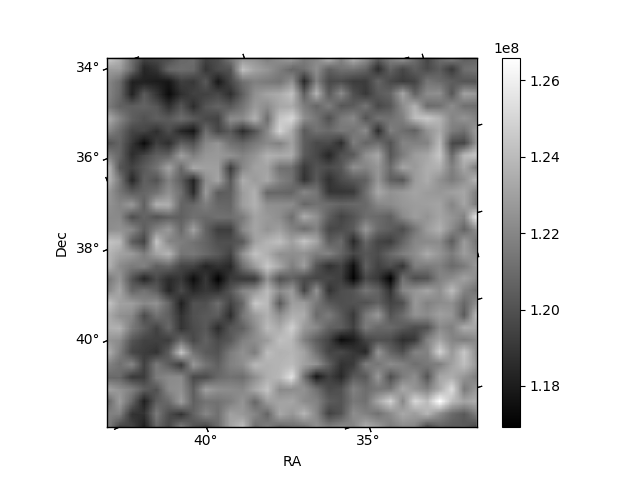
Histogram calculated using DETX and DETY for each event in the final _common_clean file
| Quadrant A | 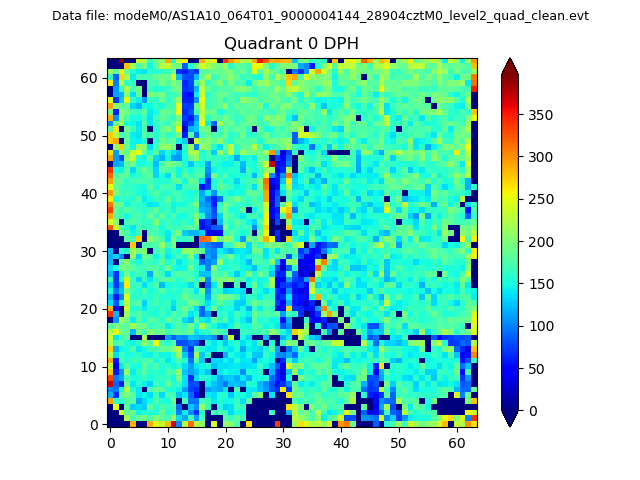 |
 |
Quadrant B |
|---|---|---|---|
| Quadrant D | 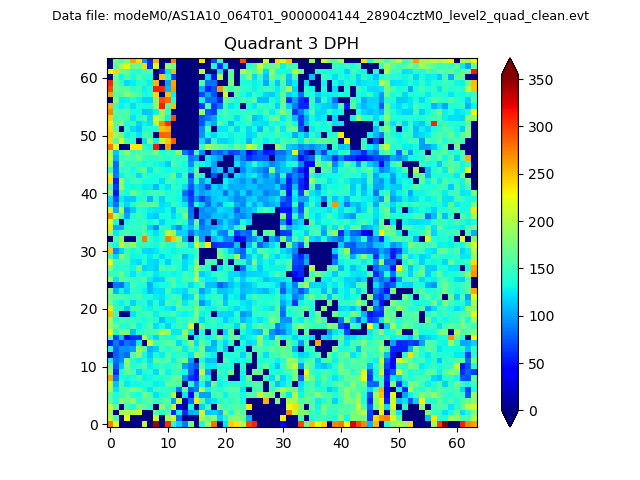 |
 |
Quadrant C |
| Plot type | Count rate plots | Images |
|---|---|---|
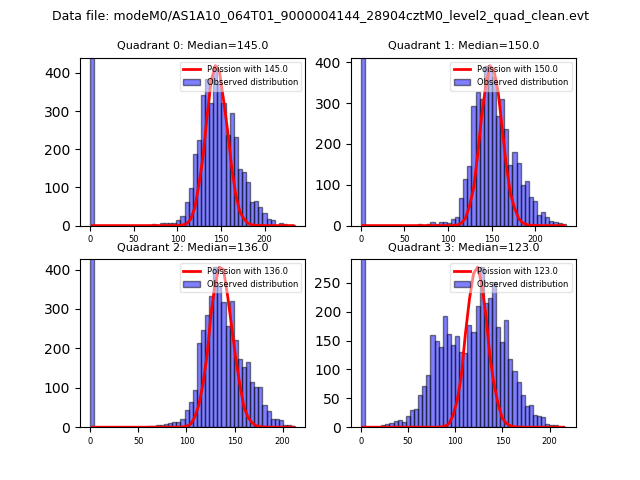
| Comparison with Poisson distribution Blue bars denote a histogram of data divided into 1 sec bins. Red curve is a Poisson curve with rate = median count rate of data. |
 |
 |
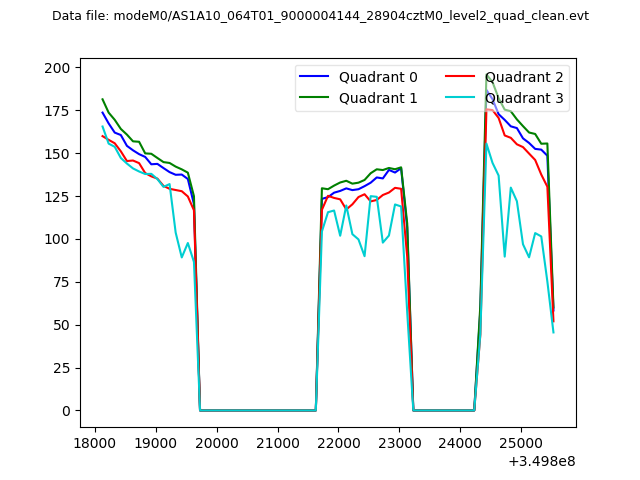
| Quadrant-wise count rates Data is divided into 100 sec bins |
 |
|
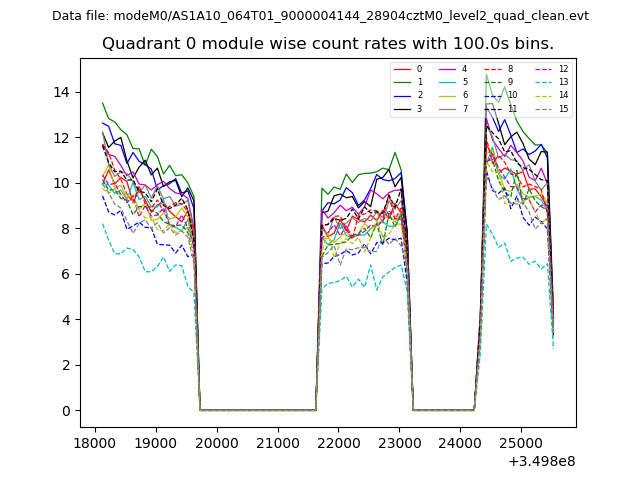
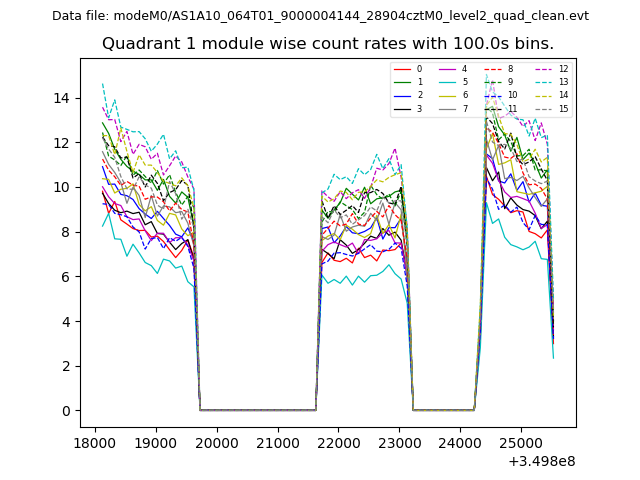
| Module-wise count rates for Quadrant A Data is divided into 100 sec bins |
 |
 |
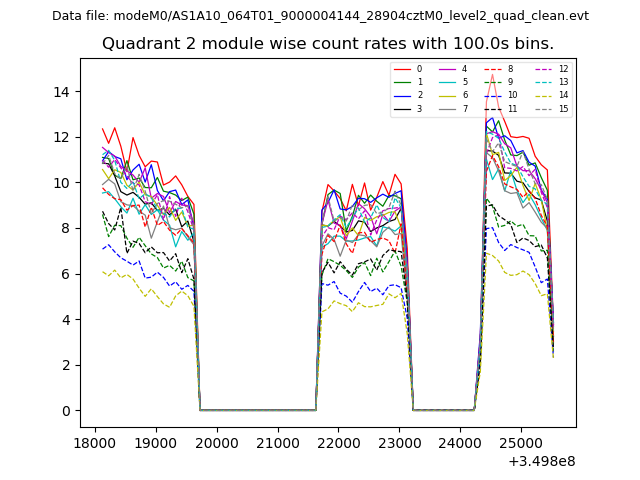
| Module-wise count rates for Quadrant B Data is divided into 100 sec bins |
 |
 |
| Module-wise count rates for Quadrant C Data is divided into 100 sec bins |
 |
 |
| Module-wise count rates for Quadrant D Data is divided into 100 sec bins |
 |
 |
| Parameter | Plot |
|---|---|
| CZT HV Monitor | 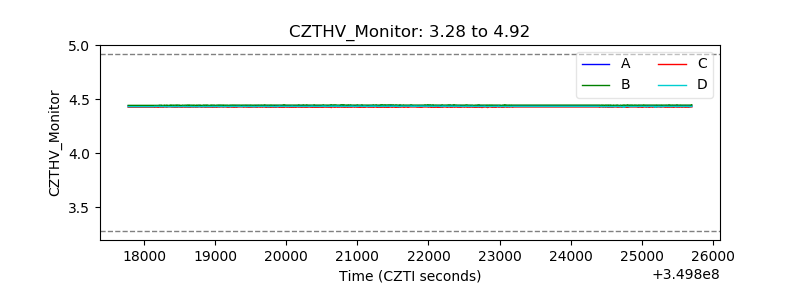 |
| D_VDD | 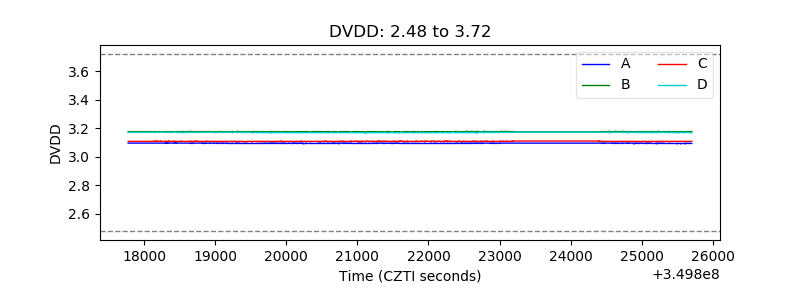 |
| Temperature 1 |  |
| Veto HV Monitor | 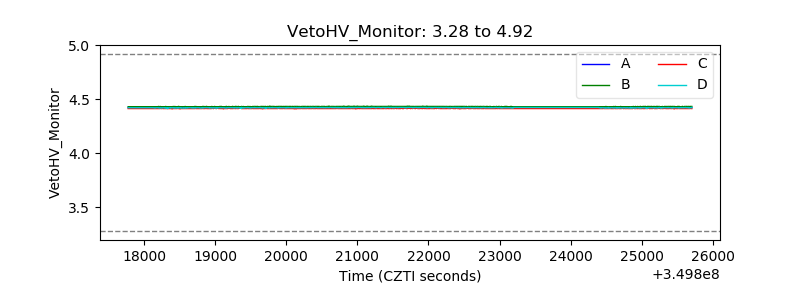 |
| Veto LLD |  |
| Alpha Counter | 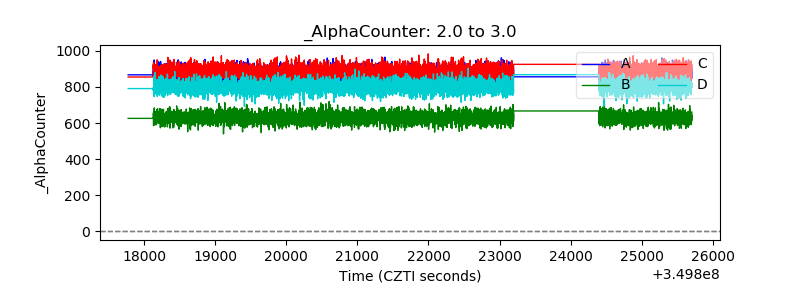 |
| _CPM_Rate |  |
| CZT Counter | 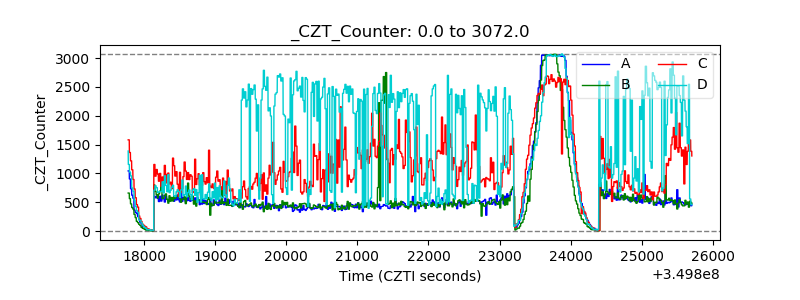 |
| +2.5 Volts monitor |  |
| +5 Volts monitor | 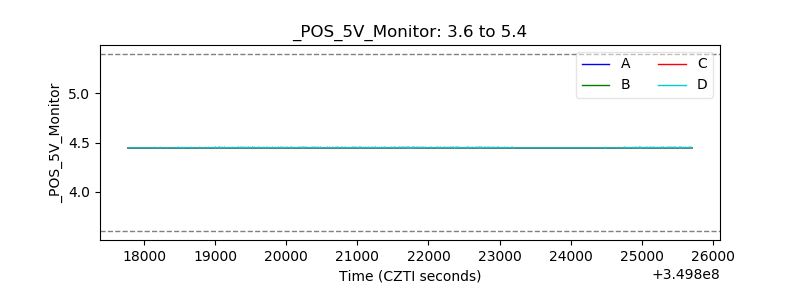 |
| _ROLL_ROT | 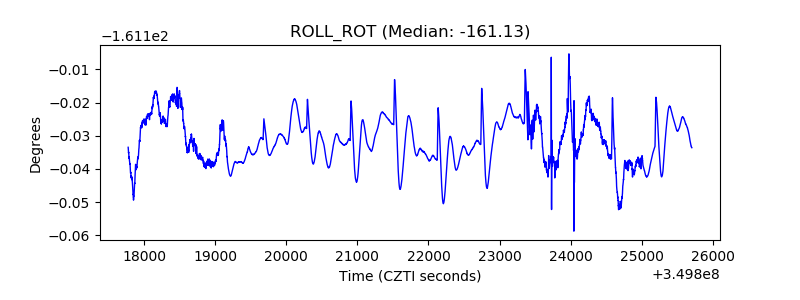 |
| _Roll_DEC | 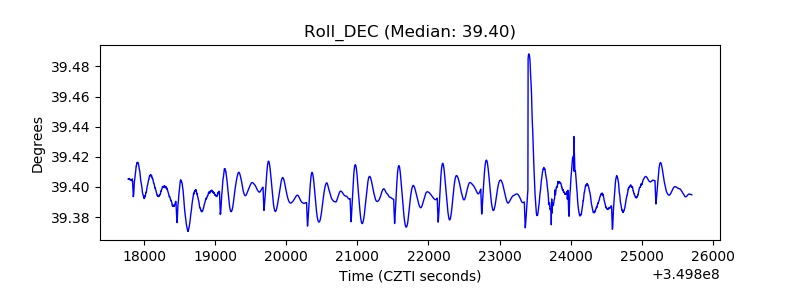 |
| _Roll_RA | 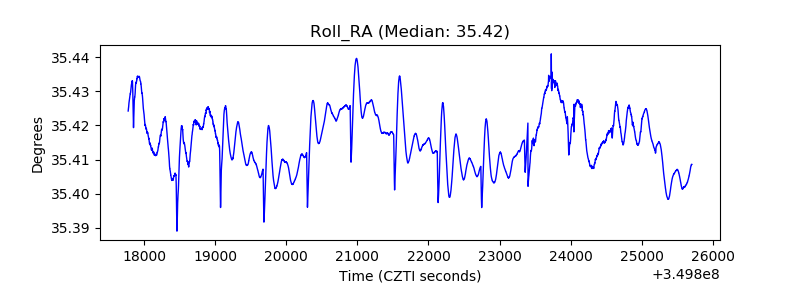 |
| Veto Counter | 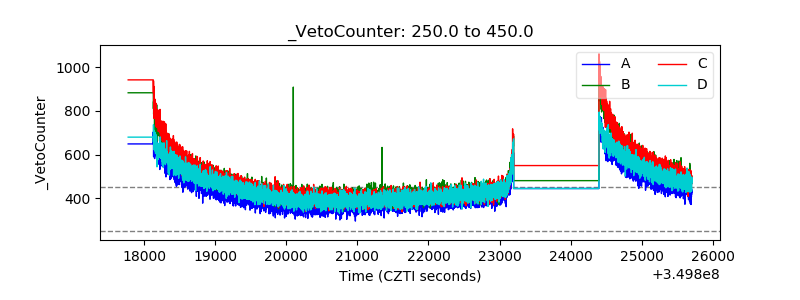 |