| Param | Original file | Final file |
|---|---|---|
| Filename | modeM0/AS1A10_064T01_9000004144_28905cztM0_level2.evt | modeM0/AS1A10_064T01_9000004144_28905cztM0_level2_quad_clean.evt |
| Size (bytes) | 838,736,640 | 83,986,560 |
| Size | 799.9 MB | 80.1 MB |
| Events in quadrant A | 3,144,078 | 578,147 |
| Events in quadrant B | 3,218,406 | 600,181 |
| Events in quadrant C | 8,115,517 | 510,650 |
| Events in quadrant D | 10,501,815 | 416,544 |
| Mode M0 | |||
|---|---|---|---|
| Quadrant | BADHDUFLAG | Total packets | Discarded packets |
| A | 0 | 13211 | 2 |
| B | 0 | 13427 | 2 |
| C | 0 | 28573 | 2 |
| D | 0 | 35470 | 2 |
| Mode SS | |||
|---|---|---|---|
| Quadrant | BADHDUFLAG | Total packets | Discarded packets |
| A | 0 | 126 | 0 |
| B | 0 | 126 | 0 |
| C | 0 | 126 | 0 |
| D | 0 | 126 | 0 |
| Mode M9 | |||
|---|---|---|---|
| Quadrant | BADHDUFLAG | Total packets | Discarded packets |
| A | 0 | 16 | 0 |
| B | 0 | 17 | 0 |
| C | 0 | 17 | 0 |
| D | 0 | 17 | 0 |
| Quadrant | Total seconds | Saturated seconds | Saturation percentage |
|---|---|---|---|
| A | 6259 | 12 | 0.191724% |
| B | 6259 | 21 | 0.335517% |
| C | 6259 | 1126 | 17.990094% |
| D | 6259 | 3013 | 48.138680% |
Noise dominated data is calculated using 1-second bins in cleaned event files. If a bin has >2000 counts, and if more than 50% of those come from <1% of pixels, then it is considered to be noise-dominated and hence unusable.
| Quadrant | # 1 sec bins | Bins with >0 counts | Bins with >2000 counts | High rate bins dominated by noise | Noise dominated (total time) | Noise dominated (detector-on time) | Marked lightcurve |
|---|---|---|---|---|---|---|---|
| A | 7543 | 6258 | 0 | 0 | 0.00% | 0.00% | 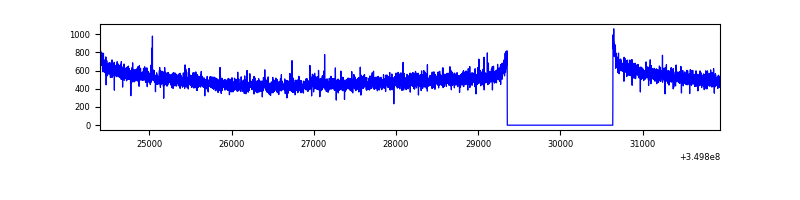 |
| B | 7543 | 6258 | 1 | 1 | 0.01% | 0.02% | 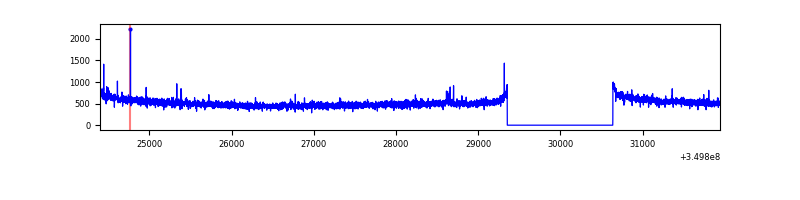 |
| C | 7543 | 6258 | 521 | 521 | 6.91% | 8.33% | 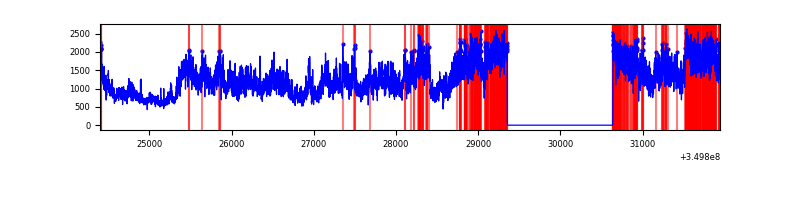 |
| D | 7543 | 6258 | 3115 | 3115 | 41.30% | 49.78% | 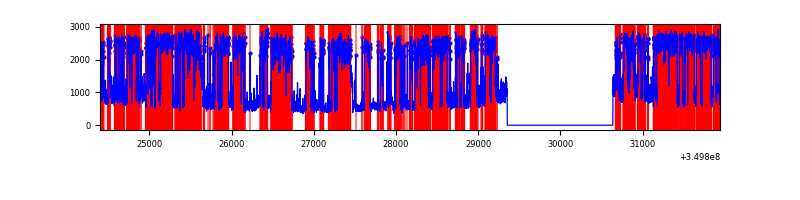 |
Top three noisy pixels from each quadrant. If the there are fewer than three noisy pixels in the level2.evt file, extra rows are filled as -1
| Pixel properties | Quadrant properties | ||||||
|---|---|---|---|---|---|---|---|
| Quadrant | DetID | PixID | Counts | Sigma | Mean | Median | Sigma |
| A | 13 | 254 | 10946 | 62.81 | 811 | 797 | 161.6 |
| A | 6 | 16 | 8634 | 48.5 | 811 | 797 | 161.6 |
| A | 3 | 137 | 7476 | 41.33 | 811 | 797 | 161.6 |
| B | 12 | 111 | 18125 | 113.31 | 818 | 797 | 152.9 |
| B | 11 | 111 | 16214 | 100.82 | 818 | 797 | 152.9 |
| B | 14 | 111 | 15277 | 94.69 | 818 | 797 | 152.9 |
| C | 3 | 233 | 5005265 | 28663.44 | 753 | 760 | 174.6 |
| C | 14 | 238 | 135974 | 774.44 | 753 | 760 | 174.6 |
| C | 14 | 254 | 23835 | 132.16 | 753 | 760 | 174.6 |
| D | 8 | 195 | 6770629 | 43243.14 | 665 | 648 | 156.6 |
| D | 1 | 52 | 1207729 | 7710.21 | 665 | 648 | 156.6 |
| D | 2 | 234 | 19525 | 120.58 | 665 | 648 | 156.6 |
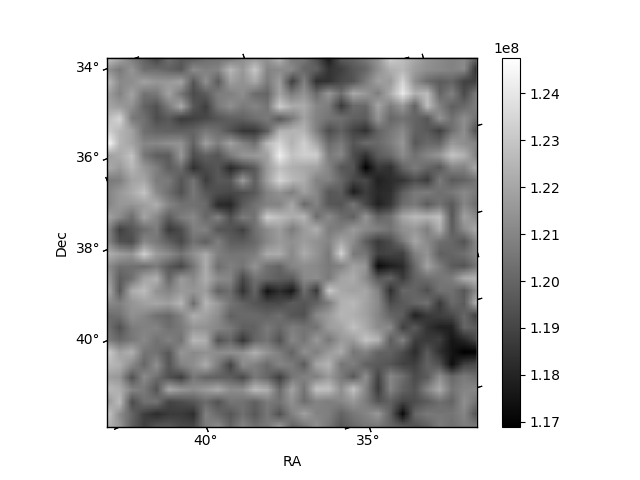
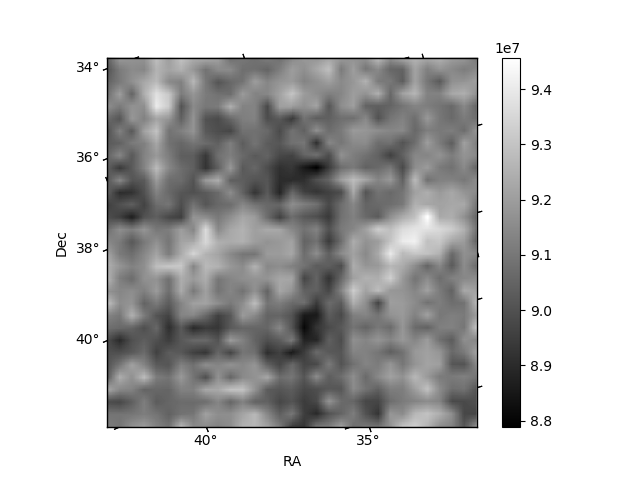
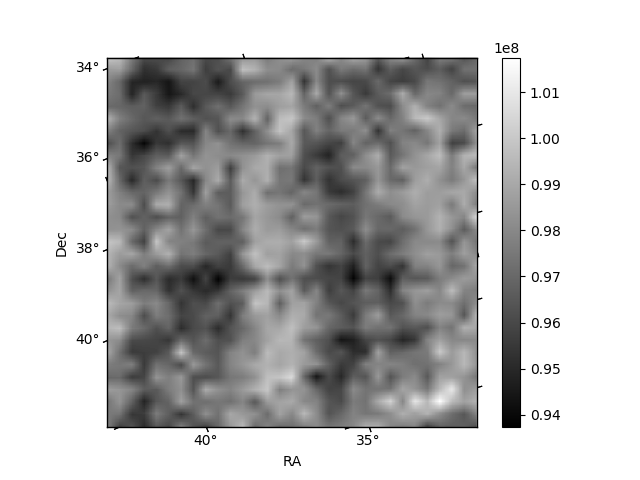
Histogram calculated using DETX and DETY for each event in the final _common_clean file
| Quadrant A | 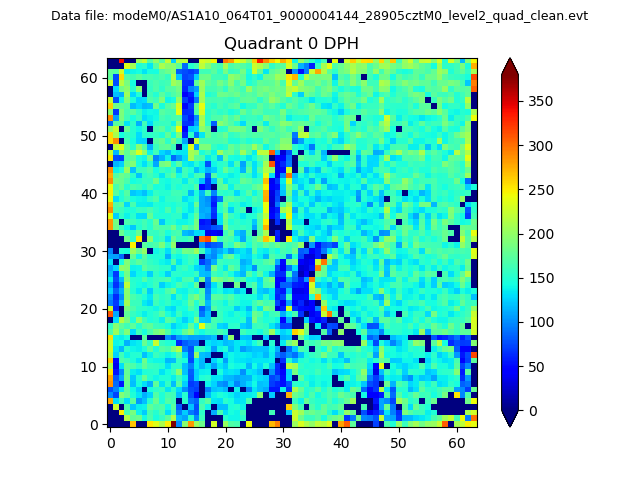 |
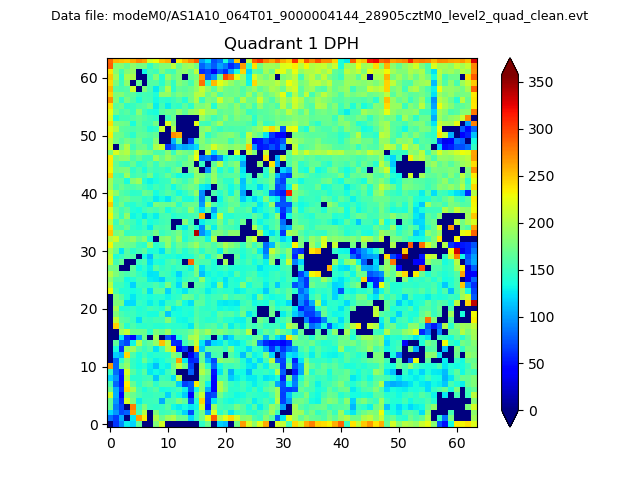 |
Quadrant B |
|---|---|---|---|
| Quadrant D |  |
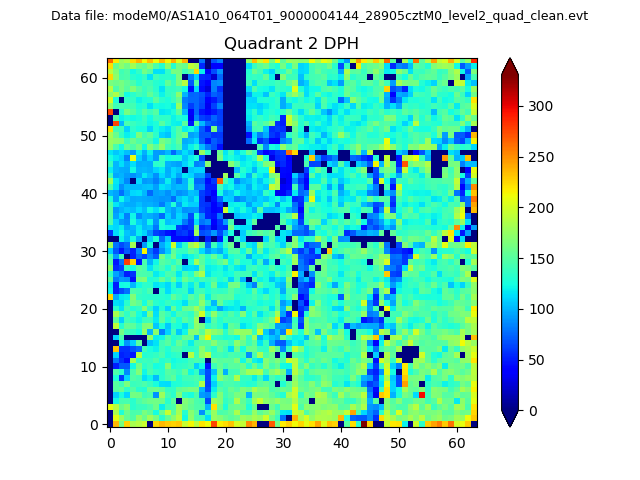 |
Quadrant C |
| Plot type | Count rate plots | Images |
|---|---|---|
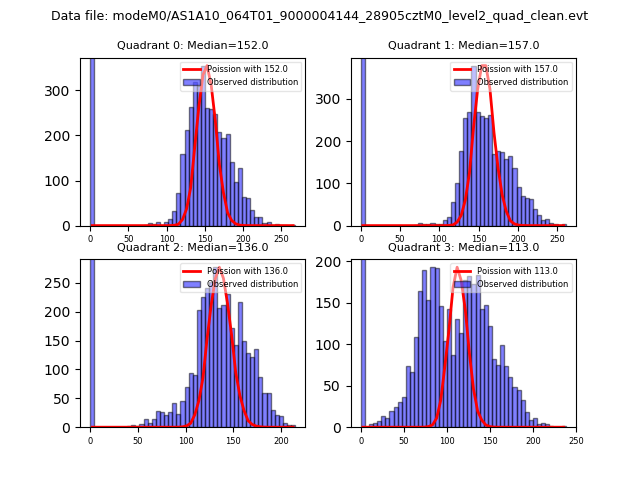
| Comparison with Poisson distribution Blue bars denote a histogram of data divided into 1 sec bins. Red curve is a Poisson curve with rate = median count rate of data. |
 |
 |
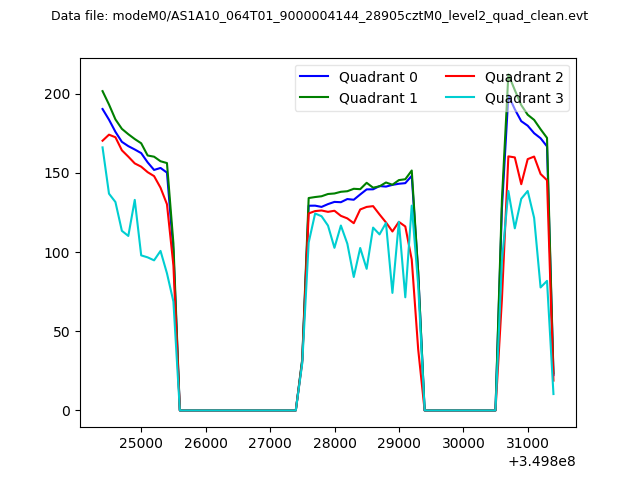
| Quadrant-wise count rates Data is divided into 100 sec bins |
 |
|
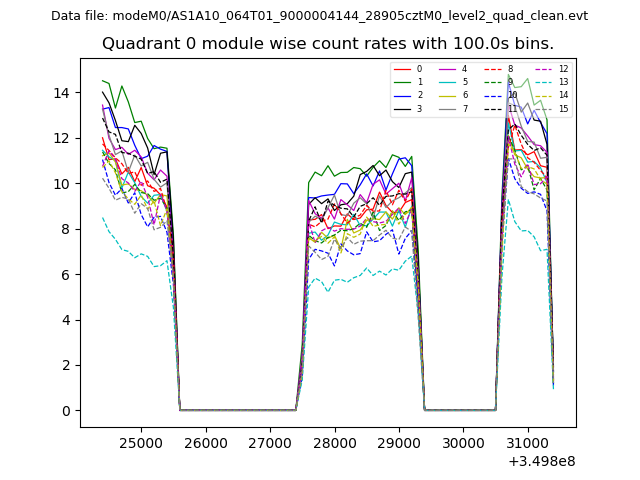
| Module-wise count rates for Quadrant A Data is divided into 100 sec bins |
 |
 |
| Module-wise count rates for Quadrant B Data is divided into 100 sec bins |
 |
 |
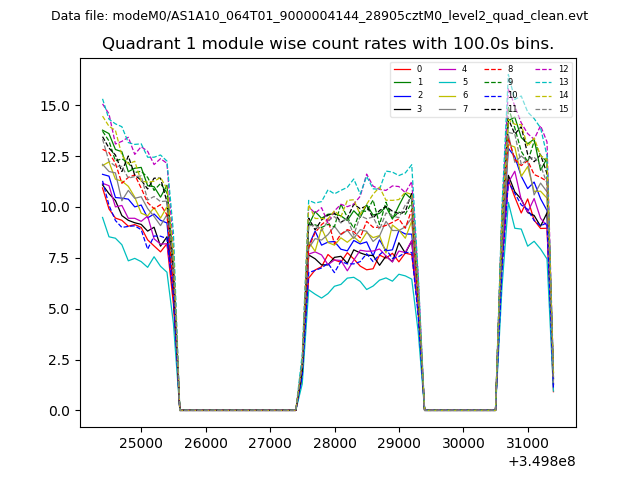
| Module-wise count rates for Quadrant C Data is divided into 100 sec bins |
 |
 |
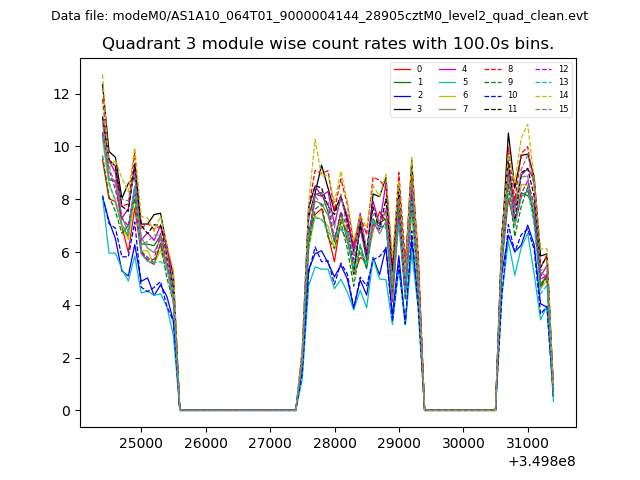
| Module-wise count rates for Quadrant D Data is divided into 100 sec bins |
 |
 |
| Parameter | Plot |
|---|---|
| CZT HV Monitor |  |
| D_VDD | 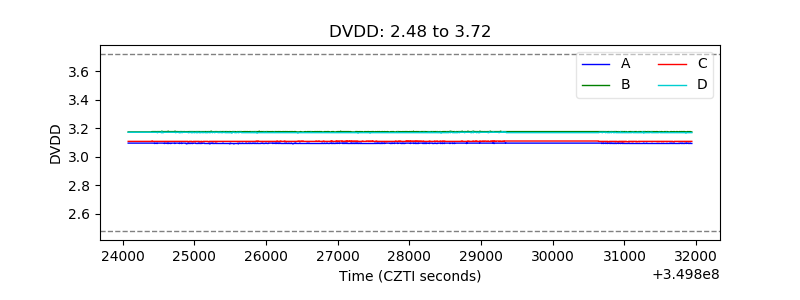 |
| Temperature 1 | 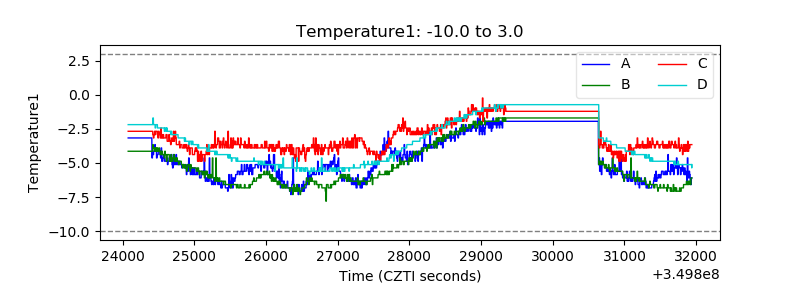 |
| Veto HV Monitor | 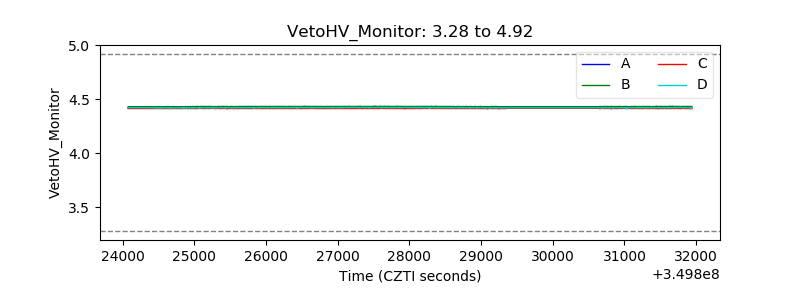 |
| Veto LLD | 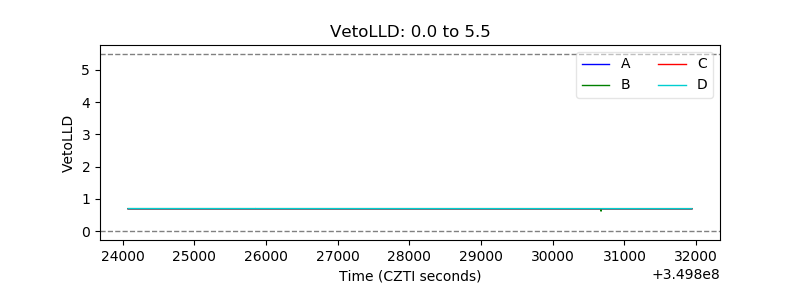 |
| Alpha Counter | 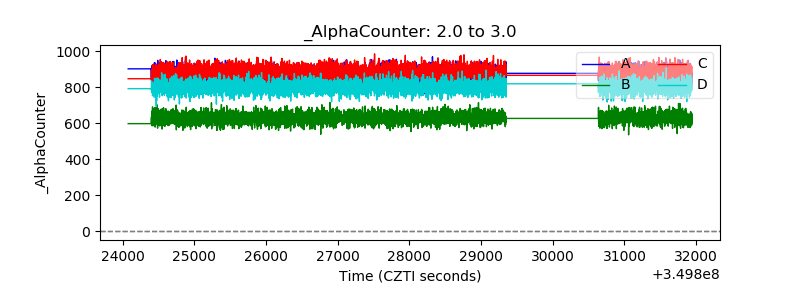 |
| _CPM_Rate | 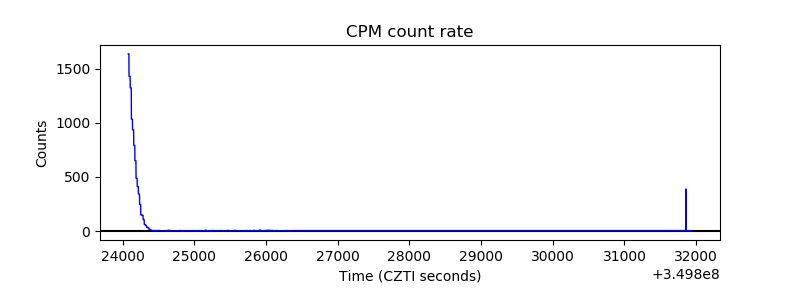 |
| CZT Counter | 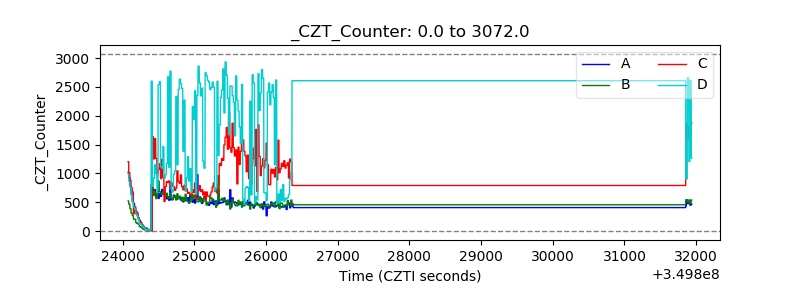 |
| +2.5 Volts monitor |  |
| +5 Volts monitor | 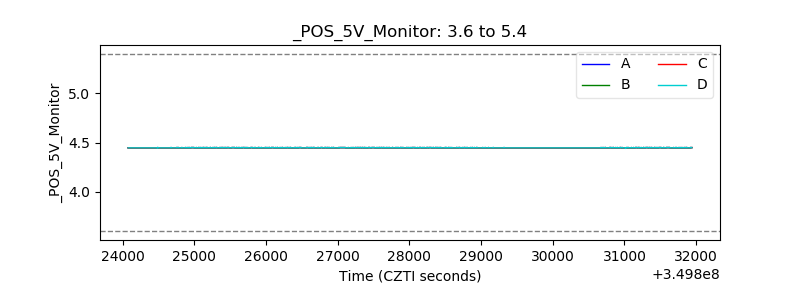 |
| _ROLL_ROT | 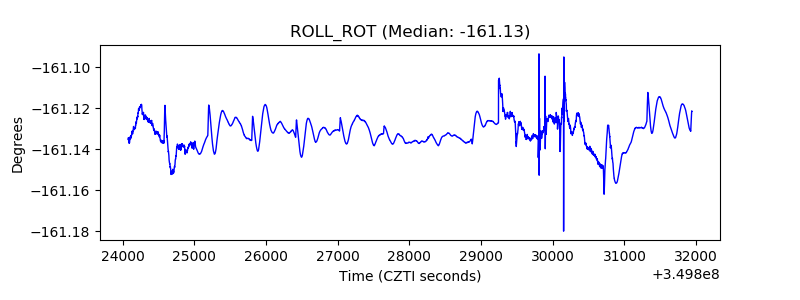 |
| _Roll_DEC | 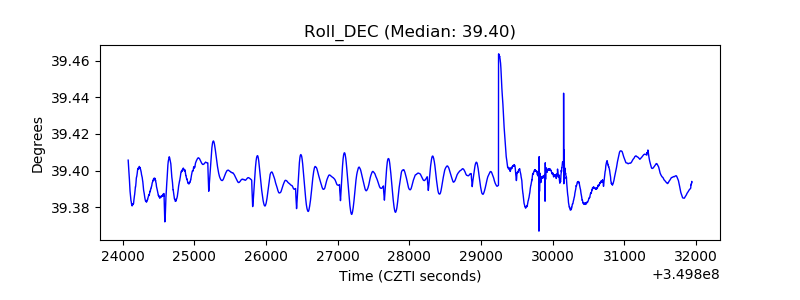 |
| _Roll_RA | 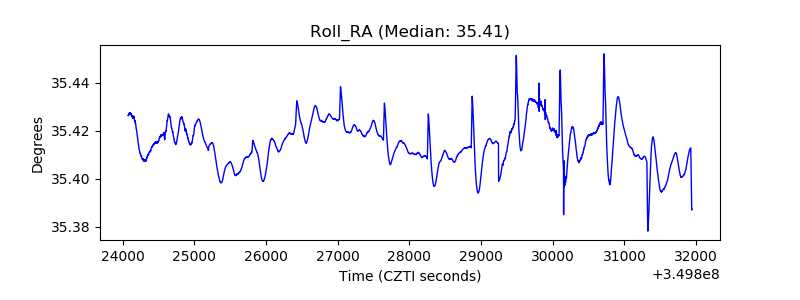 |
| Veto Counter | 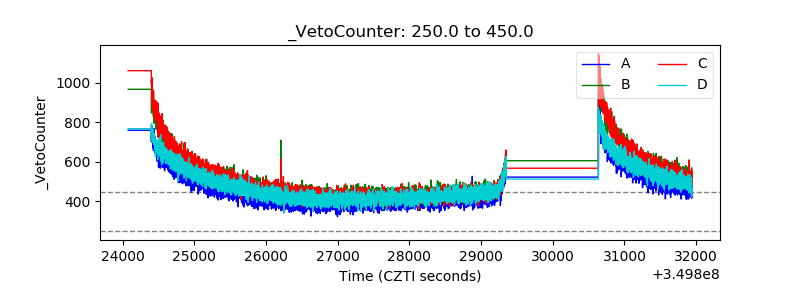 |