| Param | Original file | Final file |
|---|---|---|
| Filename | modeM0/AS1A10_064T01_9000004144_28906cztM0_level2.evt | modeM0/AS1A10_064T01_9000004144_28906cztM0_level2_quad_clean.evt |
| Size (bytes) | 969,048,000 | 76,337,280 |
| Size | 924.2 MB | 72.8 MB |
| Events in quadrant A | 3,353,170 | 517,691 |
| Events in quadrant B | 3,414,082 | 536,728 |
| Events in quadrant C | 10,431,187 | 438,754 |
| Events in quadrant D | 11,713,598 | 365,256 |
| Mode M0 | |||
|---|---|---|---|
| Quadrant | BADHDUFLAG | Total packets | Discarded packets |
| A | 0 | 13848 | 2 |
| B | 0 | 14032 | 2 |
| C | 0 | 35473 | 3 |
| D | 0 | 39223 | 2 |
| Mode SS | |||
|---|---|---|---|
| Quadrant | BADHDUFLAG | Total packets | Discarded packets |
| A | 0 | 130 | 0 |
| B | 0 | 130 | 0 |
| C | 0 | 130 | 0 |
| D | 0 | 130 | 0 |
| Mode M9 | |||
|---|---|---|---|
| Quadrant | BADHDUFLAG | Total packets | Discarded packets |
| A | 0 | 16 | 0 |
| B | 0 | 17 | 0 |
| C | 0 | 17 | 0 |
| D | 0 | 17 | 0 |
| Quadrant | Total seconds | Saturated seconds | Saturation percentage |
|---|---|---|---|
| A | 6480 | 35 | 0.540123% |
| B | 6480 | 62 | 0.956790% |
| C | 6479 | 2313 | 35.699954% |
| D | 6479 | 3701 | 57.123013% |
Noise dominated data is calculated using 1-second bins in cleaned event files. If a bin has >2000 counts, and if more than 50% of those come from <1% of pixels, then it is considered to be noise-dominated and hence unusable.
| Quadrant | # 1 sec bins | Bins with >0 counts | Bins with >2000 counts | High rate bins dominated by noise | Noise dominated (total time) | Noise dominated (detector-on time) | Marked lightcurve |
|---|---|---|---|---|---|---|---|
| A | 7799 | 6480 | 0 | 0 | 0.00% | 0.00% | 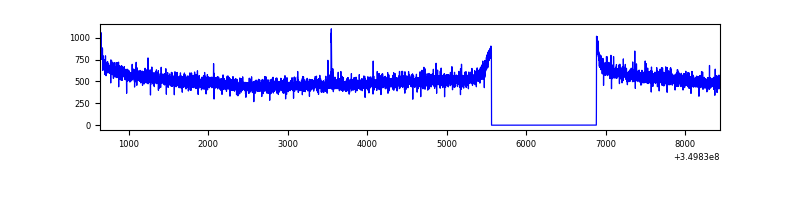 |
| B | 7799 | 6479 | 0 | 0 | 0.00% | 0.00% | 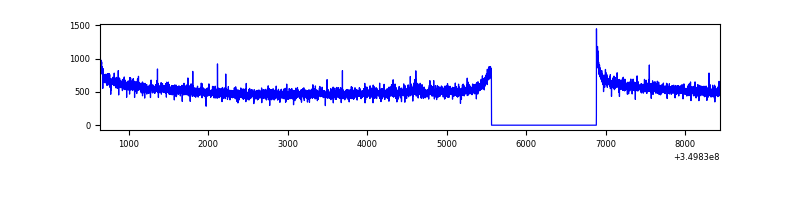 |
| C | 7798 | 6478 | 1436 | 1436 | 18.41% | 22.17% | 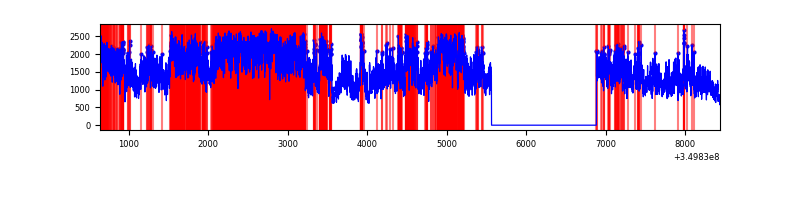 |
| D | 7798 | 6478 | 3709 | 3709 | 47.56% | 57.26% | 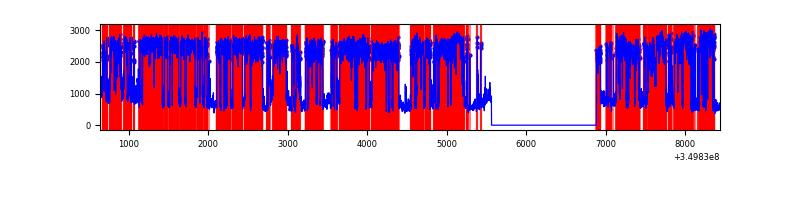 |
Top three noisy pixels from each quadrant. If the there are fewer than three noisy pixels in the level2.evt file, extra rows are filled as -1
| Pixel properties | Quadrant properties | ||||||
|---|---|---|---|---|---|---|---|
| Quadrant | DetID | PixID | Counts | Sigma | Mean | Median | Sigma |
| A | 13 | 254 | 11490 | 62.62 | 864 | 850 | 169.9 |
| A | 3 | 137 | 7729 | 40.48 | 864 | 850 | 169.9 |
| A | 0 | 226 | 7319 | 38.07 | 864 | 850 | 169.9 |
| B | 12 | 111 | 19088 | 113.07 | 871 | 849 | 161.3 |
| B | 11 | 111 | 17348 | 102.29 | 871 | 849 | 161.3 |
| B | 14 | 111 | 16326 | 95.95 | 871 | 849 | 161.3 |
| C | 3 | 233 | 7243811 | 40522.03 | 775 | 780 | 178.7 |
| C | 14 | 238 | 133341 | 741.63 | 775 | 780 | 178.7 |
| C | 14 | 254 | 16053 | 85.45 | 775 | 780 | 178.7 |
| D | 8 | 195 | 7241540 | 45429.28 | 676 | 660 | 159.4 |
| D | 1 | 52 | 1690060 | 10599.3 | 676 | 660 | 159.4 |
| D | 13 | 104 | 222394 | 1391.16 | 676 | 660 | 159.4 |
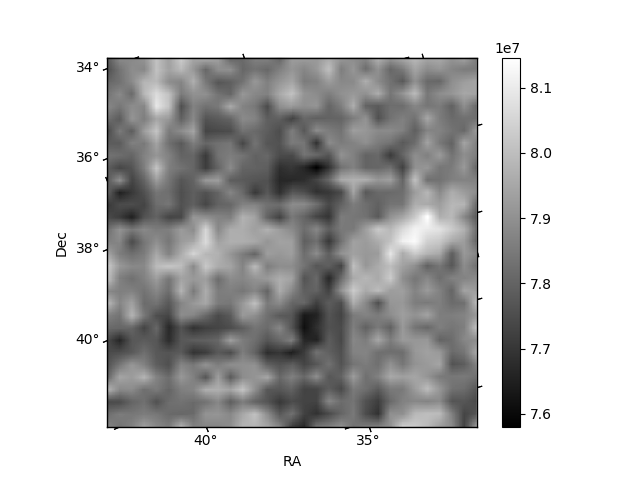
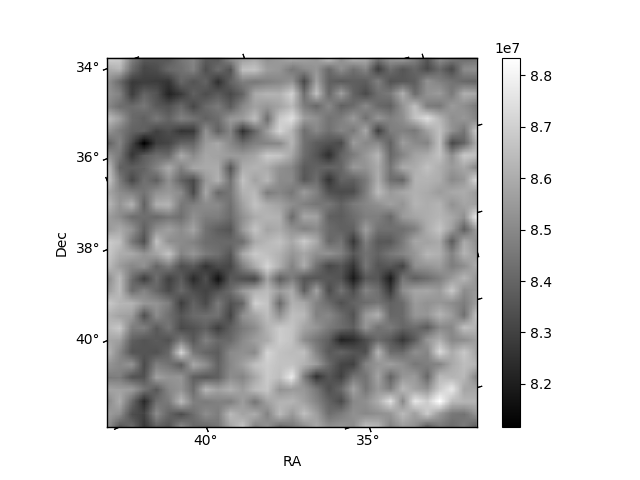
Histogram calculated using DETX and DETY for each event in the final _common_clean file
| Quadrant A | 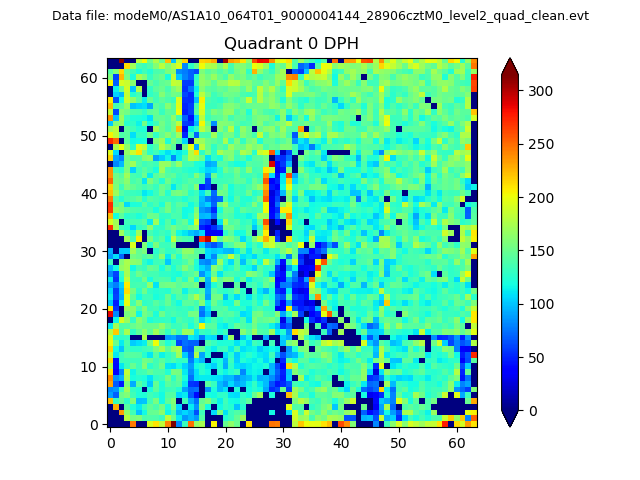 |
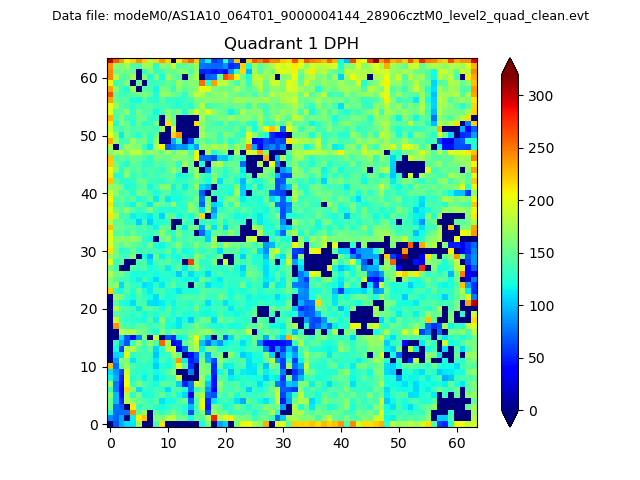 |
Quadrant B |
|---|---|---|---|
| Quadrant D |  |
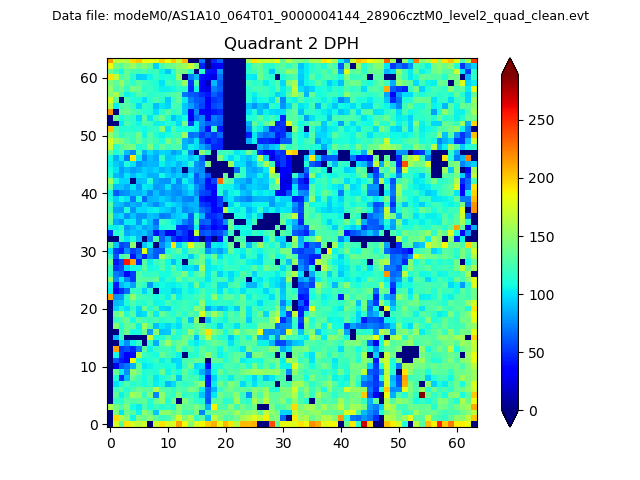 |
Quadrant C |
| Plot type | Count rate plots | Images |
|---|---|---|
| Comparison with Poisson distribution Blue bars denote a histogram of data divided into 1 sec bins. Red curve is a Poisson curve with rate = median count rate of data. |
 |
 |
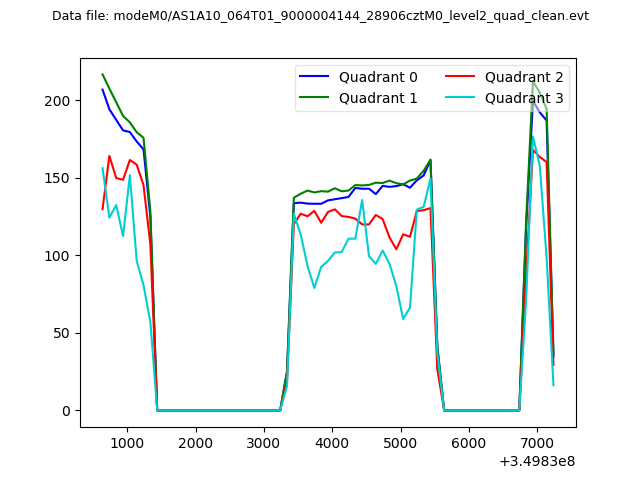
| Quadrant-wise count rates Data is divided into 100 sec bins |
 |
|
| Module-wise count rates for Quadrant A Data is divided into 100 sec bins |
 |
 |
| Module-wise count rates for Quadrant B Data is divided into 100 sec bins |
 |
 |
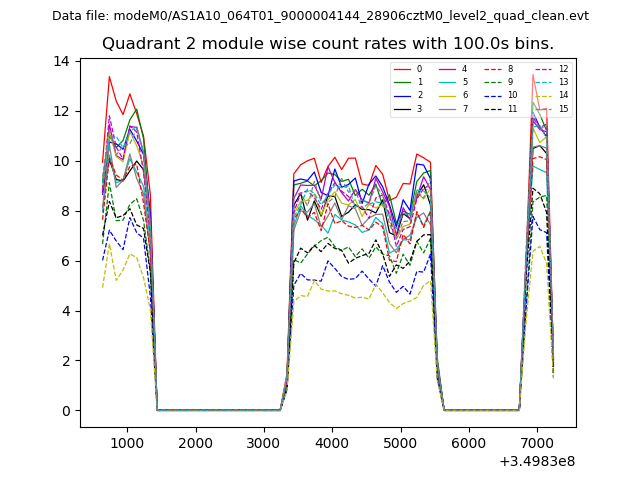
| Module-wise count rates for Quadrant C Data is divided into 100 sec bins |
 |
 |
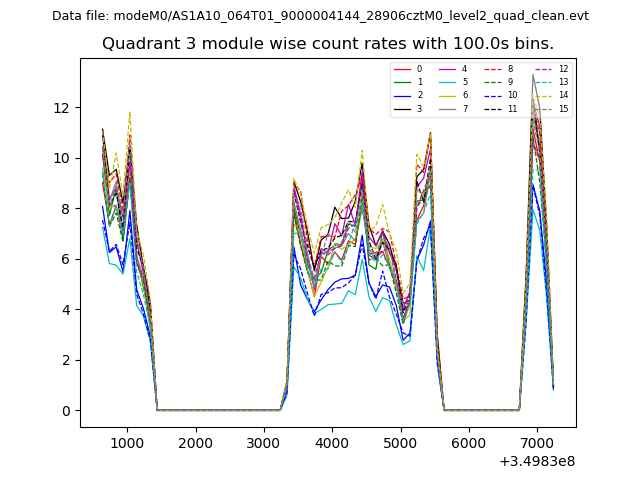
| Module-wise count rates for Quadrant D Data is divided into 100 sec bins |
 |
 |
| Parameter | Plot |
|---|---|
| CZT HV Monitor | 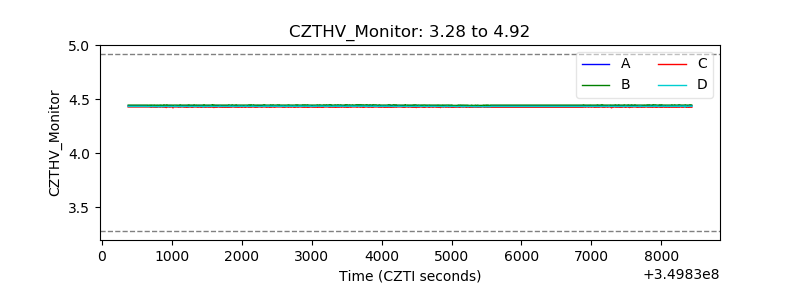 |
| D_VDD | 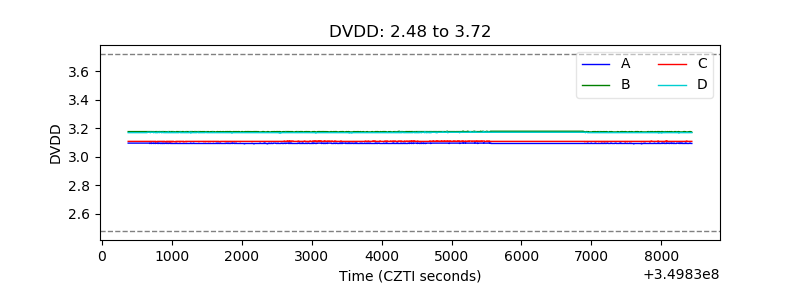 |
| Temperature 1 | 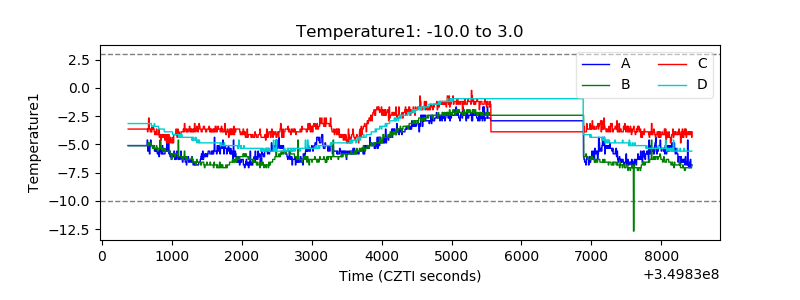 |
| Veto HV Monitor | 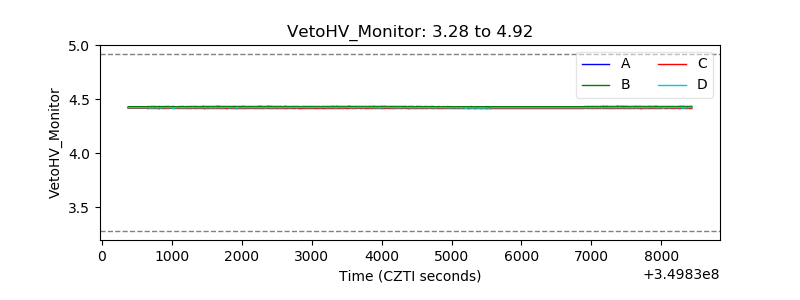 |
| Veto LLD | 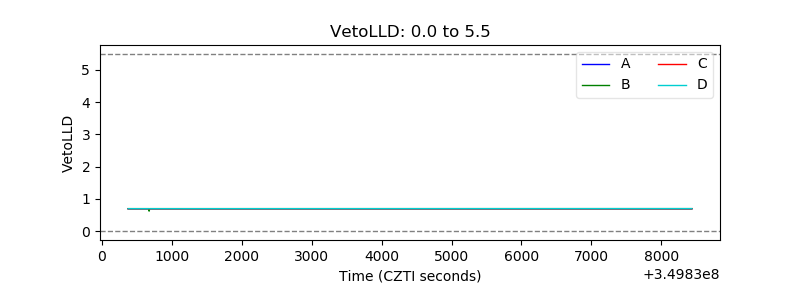 |
| Alpha Counter | 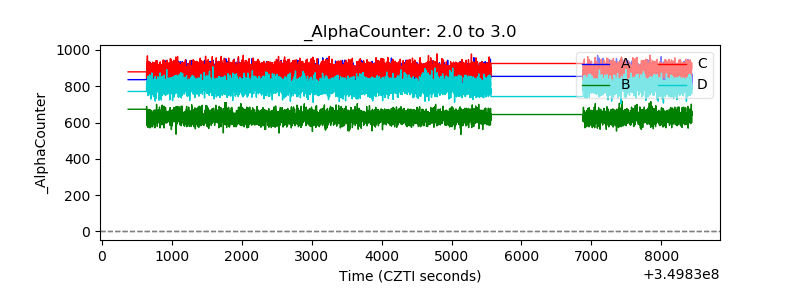 |
| _CPM_Rate | 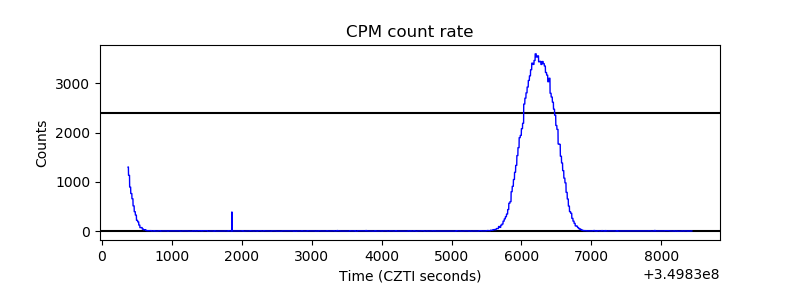 |
| CZT Counter | 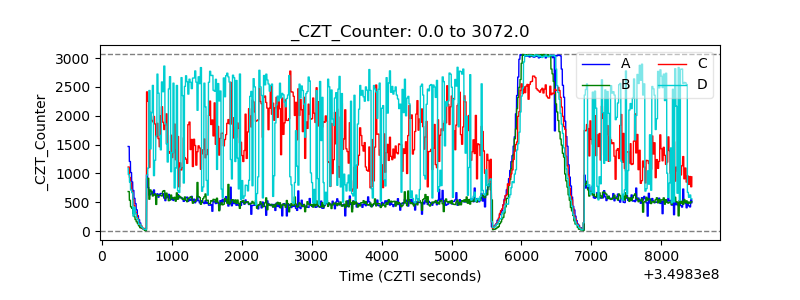 |
| +2.5 Volts monitor |  |
| +5 Volts monitor |  |
| _ROLL_ROT | 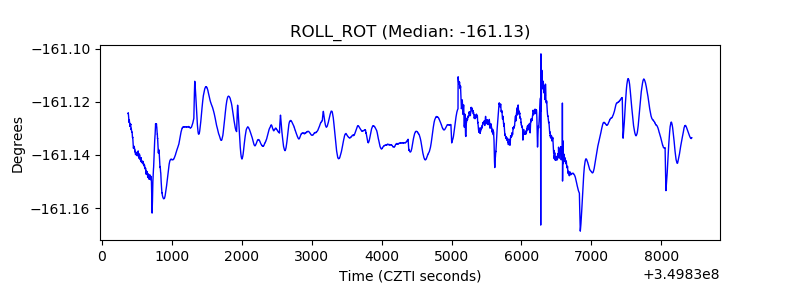 |
| _Roll_DEC | 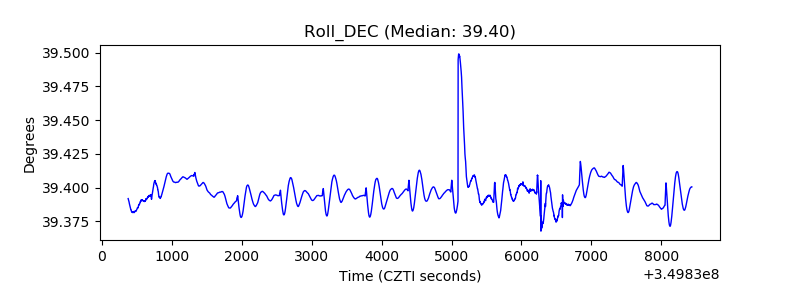 |
| _Roll_RA | 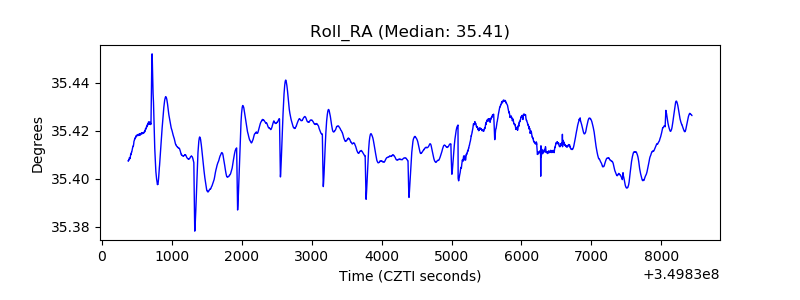 |
| Veto Counter | 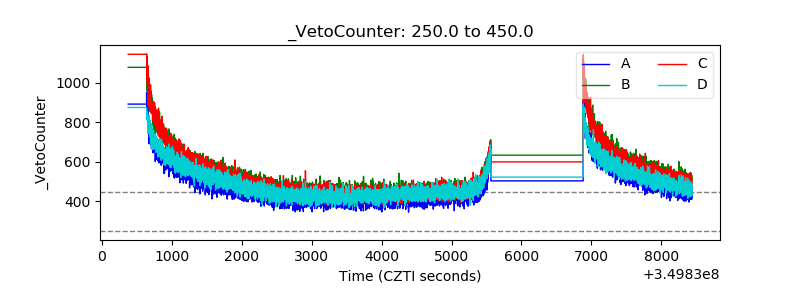 |