| Param | Original file | Final file |
|---|---|---|
| Filename | modeM0/AS1A10_064T01_9000004144_28908cztM0_level2.evt | modeM0/AS1A10_064T01_9000004144_28908cztM0_level2_quad_clean.evt |
| Size (bytes) | 803,779,200 | 69,546,240 |
| Size | 766.5 MB | 66.3 MB |
| Events in quadrant A | 3,340,468 | 435,466 |
| Events in quadrant B | 3,402,052 | 443,370 |
| Events in quadrant C | 8,008,403 | 385,247 |
| Events in quadrant D | 9,150,249 | 384,335 |
| Mode M0 | |||
|---|---|---|---|
| Quadrant | BADHDUFLAG | Total packets | Discarded packets |
| A | 0 | 13901 | 2 |
| B | 0 | 13953 | 2 |
| C | 0 | 28525 | 2 |
| D | 0 | 31697 | 2 |
| Mode SS | |||
|---|---|---|---|
| Quadrant | BADHDUFLAG | Total packets | Discarded packets |
| A | 0 | 132 | 0 |
| B | 0 | 132 | 0 |
| C | 0 | 132 | 0 |
| D | 0 | 132 | 0 |
| Mode M9 | |||
|---|---|---|---|
| Quadrant | BADHDUFLAG | Total packets | Discarded packets |
| A | 0 | 16 | 0 |
| B | 0 | 17 | 0 |
| C | 0 | 17 | 0 |
| D | 0 | 17 | 0 |
| Quadrant | Total seconds | Saturated seconds | Saturation percentage |
|---|---|---|---|
| A | 6555 | 62 | 0.945843% |
| B | 6555 | 103 | 1.571320% |
| C | 6555 | 882 | 13.455378% |
| D | 6555 | 1929 | 29.427918% |
Noise dominated data is calculated using 1-second bins in cleaned event files. If a bin has >2000 counts, and if more than 50% of those come from <1% of pixels, then it is considered to be noise-dominated and hence unusable.
| Quadrant | # 1 sec bins | Bins with >0 counts | Bins with >2000 counts | High rate bins dominated by noise | Noise dominated (total time) | Noise dominated (detector-on time) | Marked lightcurve |
|---|---|---|---|---|---|---|---|
| A | 7760 | 6556 | 0 | 0 | 0.00% | 0.00% | 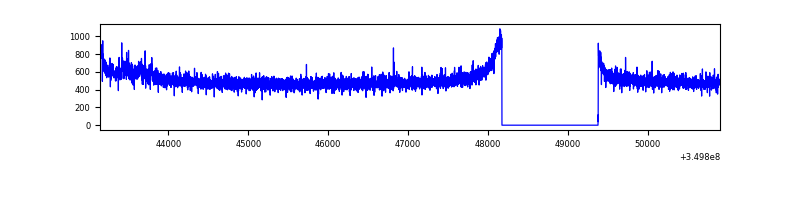 |
| B | 7760 | 6556 | 3 | 3 | 0.04% | 0.05% | 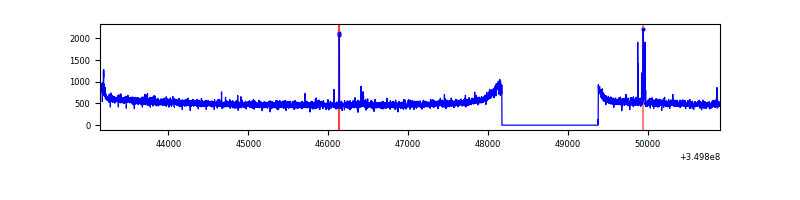 |
| C | 7760 | 6556 | 306 | 306 | 3.94% | 4.67% | 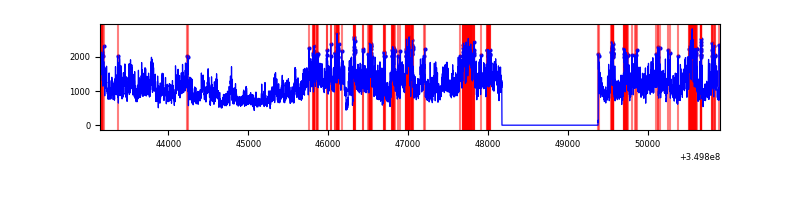 |
| D | 7760 | 6556 | 2081 | 2081 | 26.82% | 31.74% | 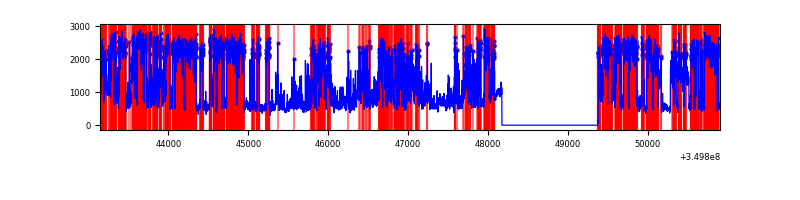 |
Top three noisy pixels from each quadrant. If the there are fewer than three noisy pixels in the level2.evt file, extra rows are filled as -1
| Pixel properties | Quadrant properties | ||||||
|---|---|---|---|---|---|---|---|
| Quadrant | DetID | PixID | Counts | Sigma | Mean | Median | Sigma |
| A | 13 | 6 | 28047 | 160.32 | 859 | 843 | 169.7 |
| A | 13 | 254 | 11357 | 61.96 | 859 | 843 | 169.7 |
| A | 3 | 137 | 7968 | 41.99 | 859 | 843 | 169.7 |
| B | 10 | 245 | 38471 | 233.02 | 858 | 838 | 161.5 |
| B | 12 | 111 | 19495 | 115.52 | 858 | 838 | 161.5 |
| B | 11 | 111 | 17824 | 105.18 | 858 | 838 | 161.5 |
| C | 3 | 233 | 4742655 | 25926.41 | 791 | 798 | 182.9 |
| C | 14 | 238 | 131509 | 714.67 | 791 | 798 | 182.9 |
| C | 4 | 254 | 27658 | 146.86 | 791 | 798 | 182.9 |
| D | 8 | 195 | 3754787 | 20775.17 | 760 | 739 | 180.7 |
| D | 13 | 104 | 1854152 | 10256.92 | 760 | 739 | 180.7 |
| D | 1 | 52 | 542528 | 2998.3 | 760 | 739 | 180.7 |
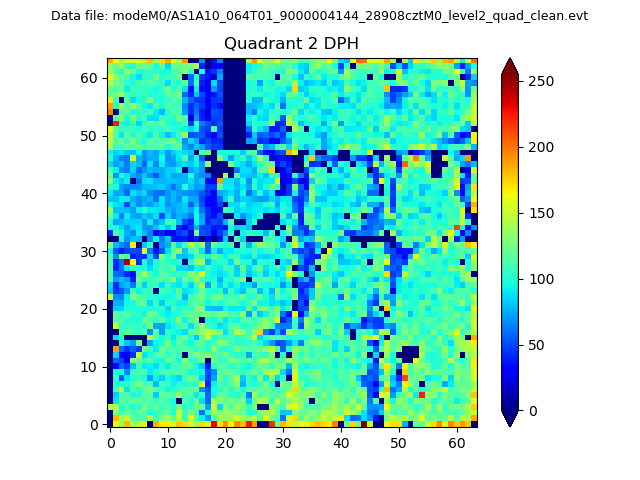
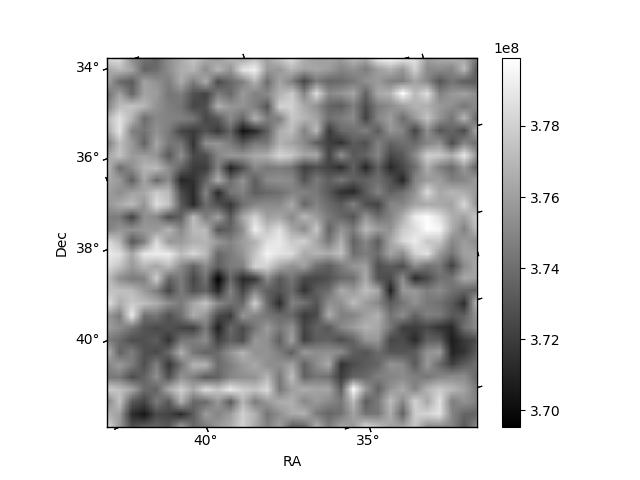
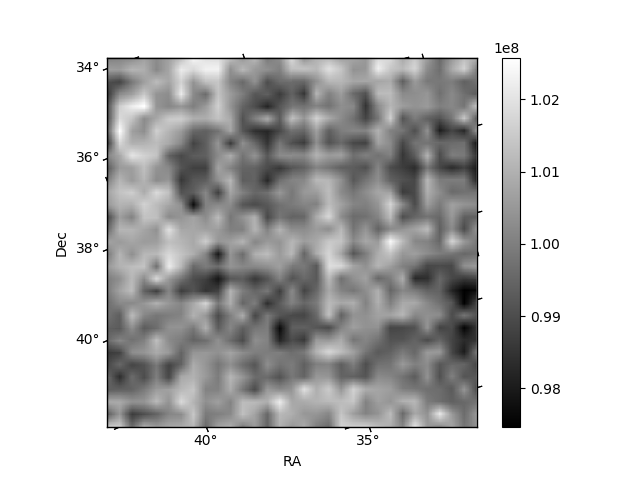
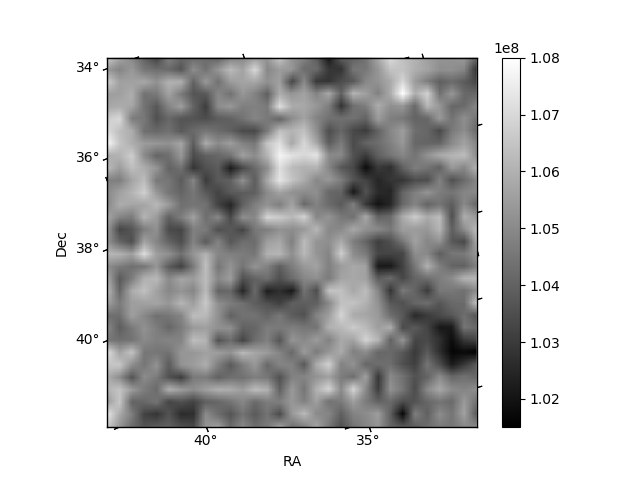
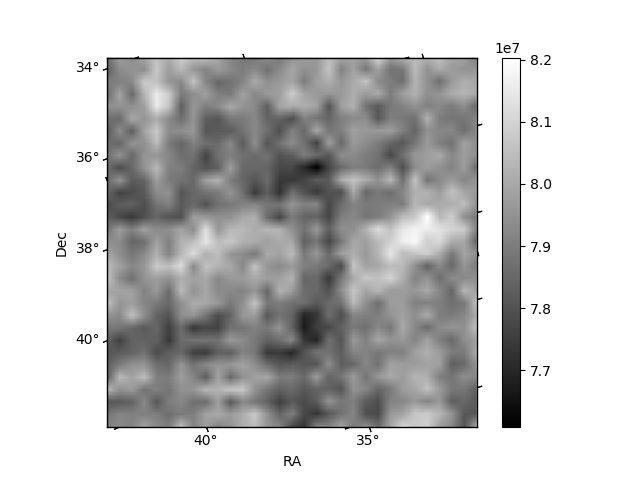
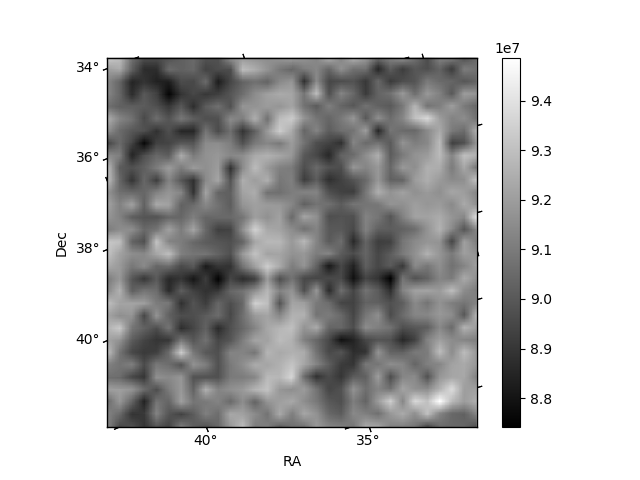
Histogram calculated using DETX and DETY for each event in the final _common_clean file
| Quadrant A | 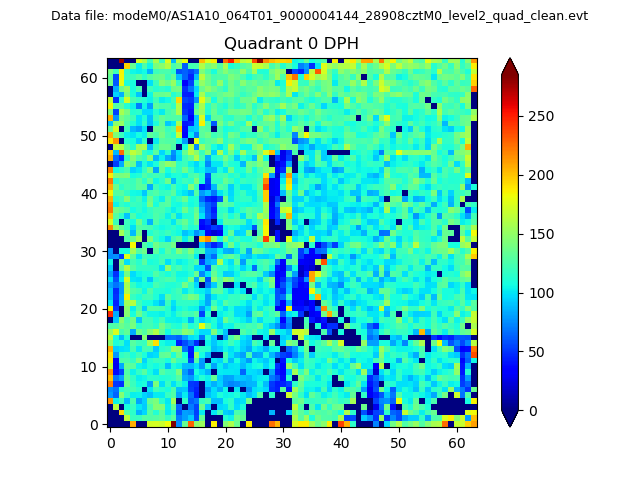 |
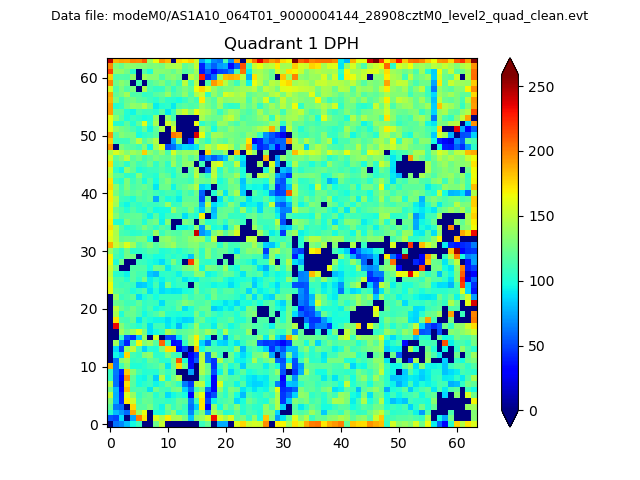 |
Quadrant B |
|---|---|---|---|
| Quadrant D | 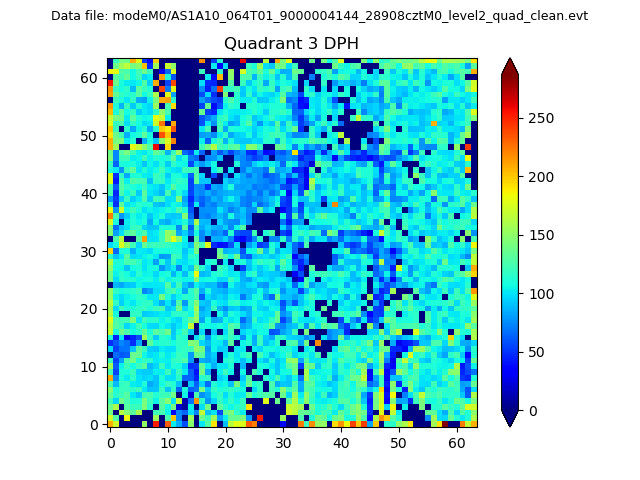 |
 |
Quadrant C |
| Plot type | Count rate plots | Images |
|---|---|---|
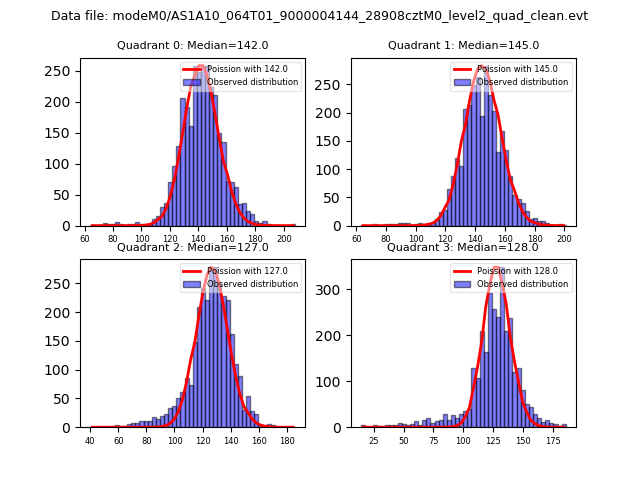
| Comparison with Poisson distribution Blue bars denote a histogram of data divided into 1 sec bins. Red curve is a Poisson curve with rate = median count rate of data. |
 |
 |
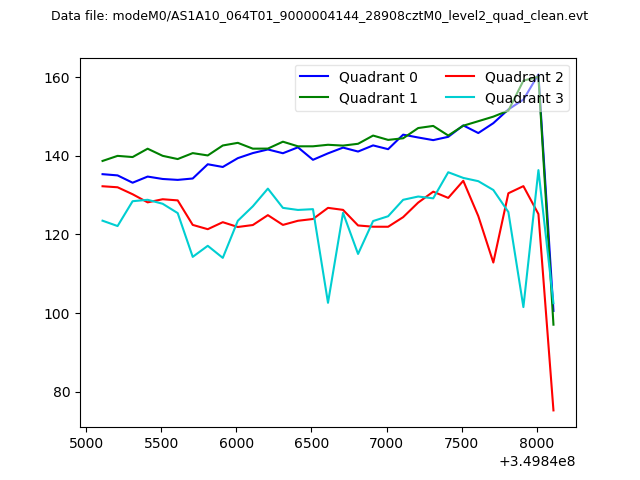
| Quadrant-wise count rates Data is divided into 100 sec bins |
 |
|
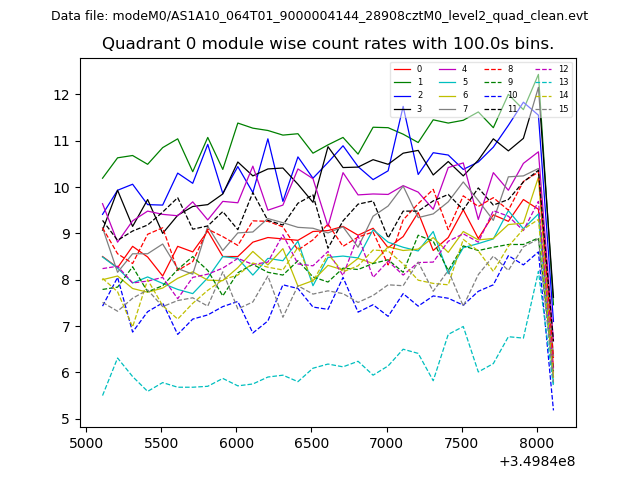
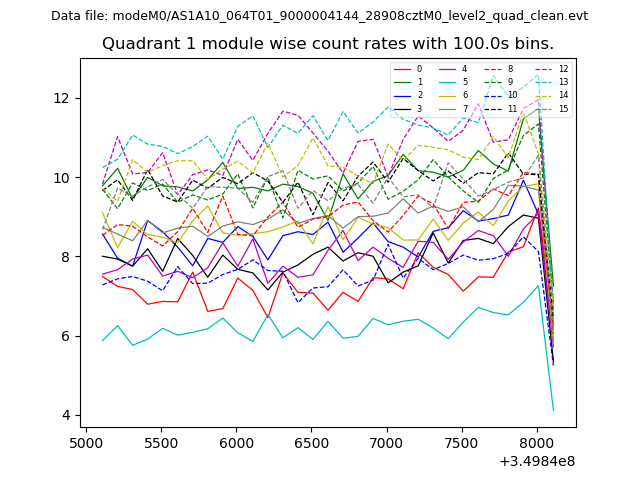
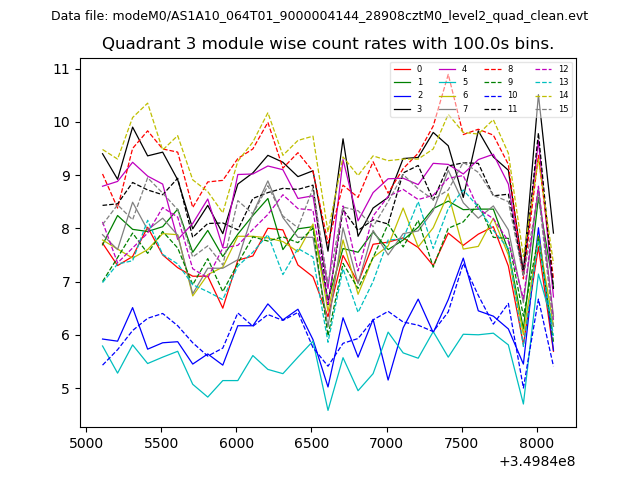
| Module-wise count rates for Quadrant A Data is divided into 100 sec bins |
 |
 |
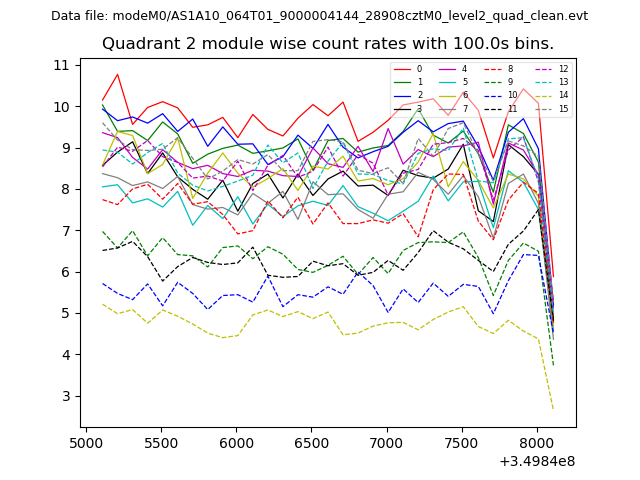
| Module-wise count rates for Quadrant B Data is divided into 100 sec bins |
 |
 |
| Module-wise count rates for Quadrant C Data is divided into 100 sec bins |
 |
 |
| Module-wise count rates for Quadrant D Data is divided into 100 sec bins |
 |
 |
| Parameter | Plot |
|---|---|
| CZT HV Monitor | 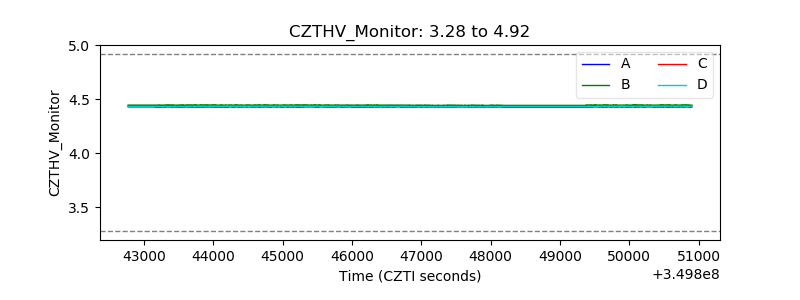 |
| D_VDD | 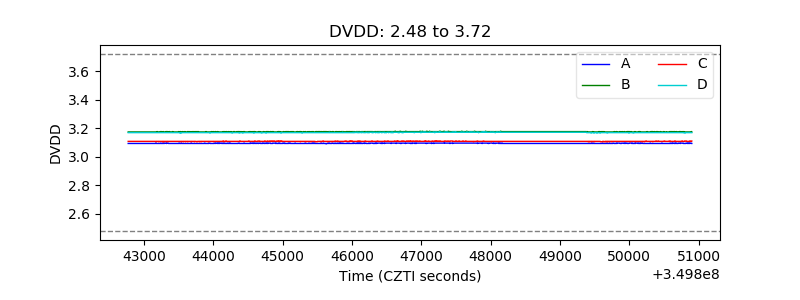 |
| Temperature 1 | 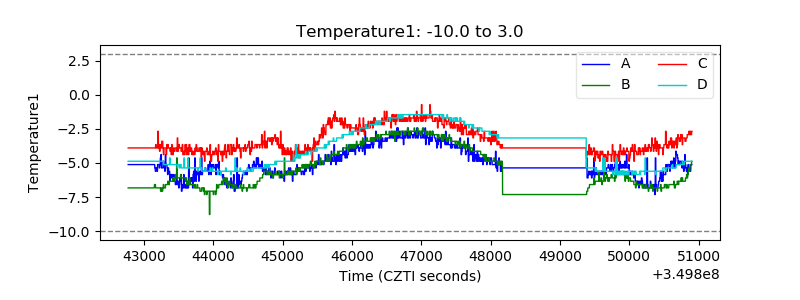 |
| Veto HV Monitor | 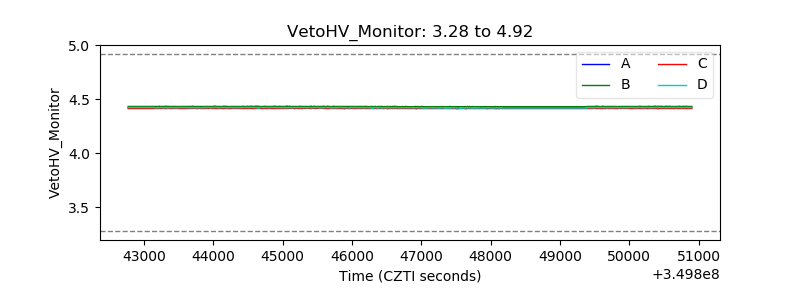 |
| Veto LLD | 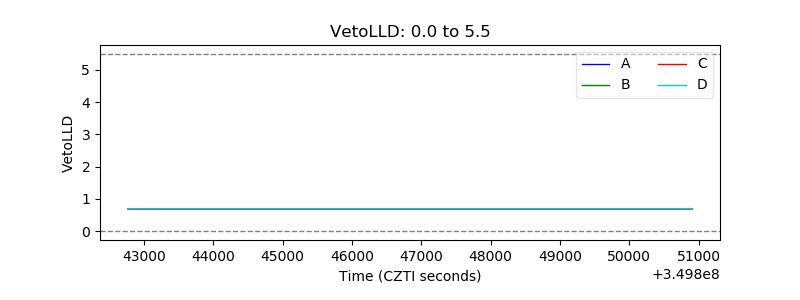 |
| Alpha Counter | 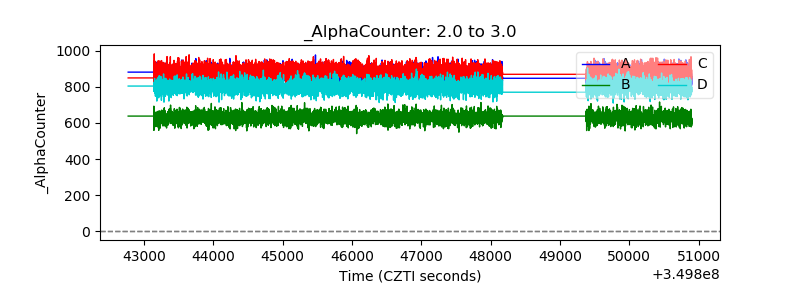 |
| _CPM_Rate | 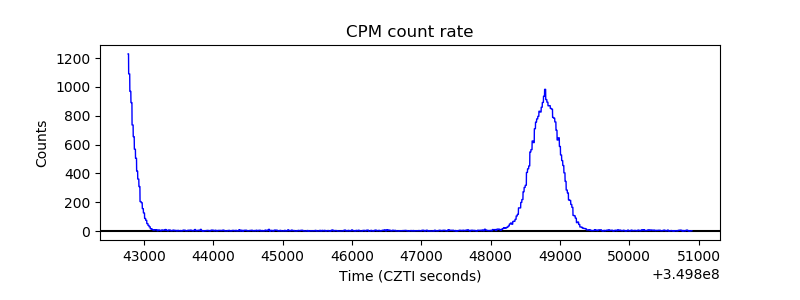 |
| CZT Counter | 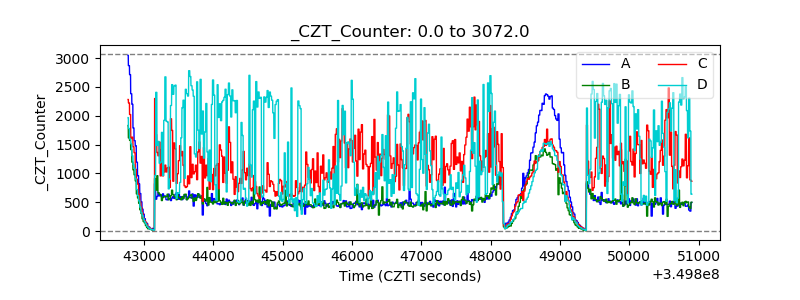 |
| +2.5 Volts monitor | 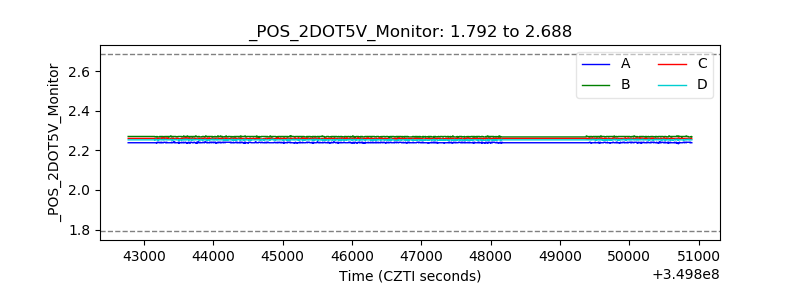 |
| +5 Volts monitor |  |
| _ROLL_ROT | 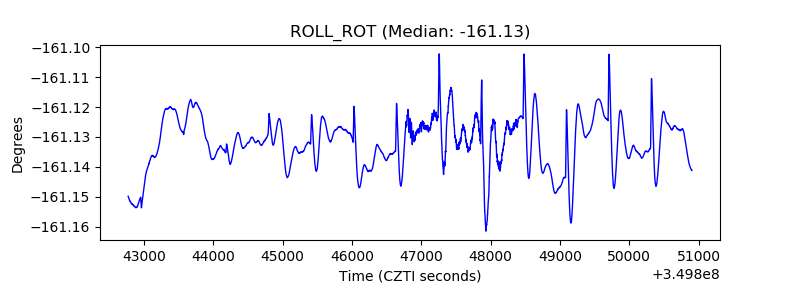 |
| _Roll_DEC | 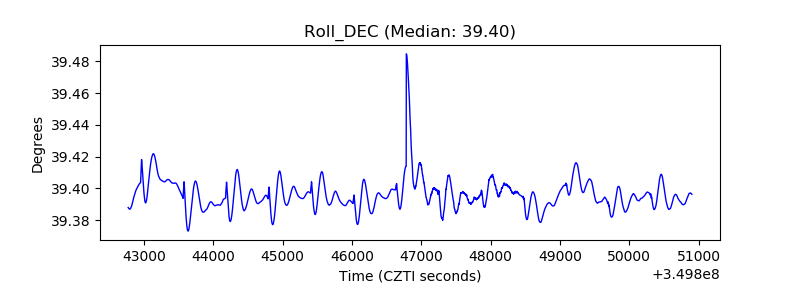 |
| _Roll_RA | 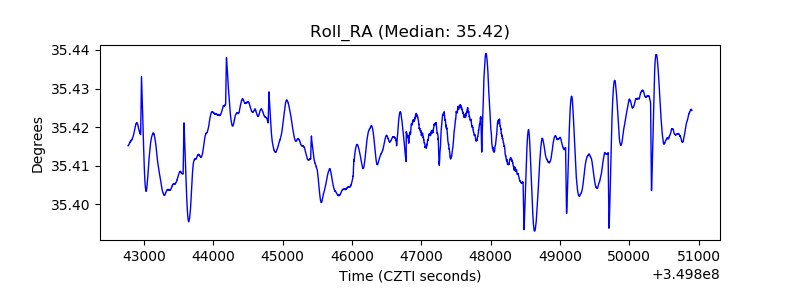 |
| Veto Counter | 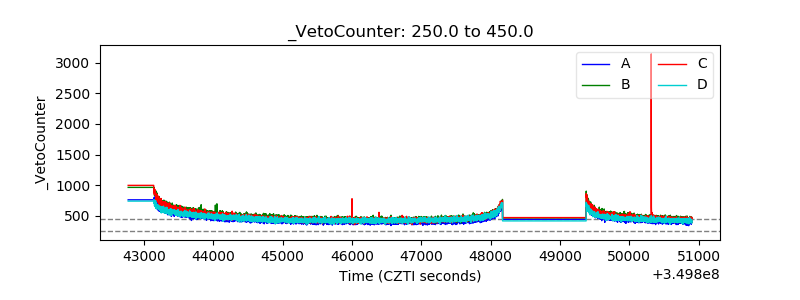 |