| Param | Original file | Final file |
|---|---|---|
| Filename | modeM0/AS1A10_064T01_9000004144_28910cztM0_level2.evt | modeM0/AS1A10_064T01_9000004144_28910cztM0_level2_quad_clean.evt |
| Size (bytes) | 493,355,520 | 55,442,880 |
| Size | 470.5 MB | 52.9 MB |
| Events in quadrant A | 1,900,023 | 373,510 |
| Events in quadrant B | 1,983,183 | 380,750 |
| Events in quadrant C | 4,395,656 | 345,835 |
| Events in quadrant D | 6,382,107 | 286,736 |
| Mode M0 | |||
|---|---|---|---|
| Quadrant | BADHDUFLAG | Total packets | Discarded packets |
| A | 0 | 8385 | 1 |
| B | 0 | 8643 | 1 |
| C | 0 | 16002 | 1 |
| D | 0 | 21718 | 1 |
| Mode SS | |||
|---|---|---|---|
| Quadrant | BADHDUFLAG | Total packets | Discarded packets |
| A | 0 | 82 | 0 |
| B | 0 | 82 | 0 |
| C | 0 | 82 | 0 |
| D | 0 | 82 | 0 |
| Mode M9 | |||
|---|---|---|---|
| Quadrant | BADHDUFLAG | Total packets | Discarded packets |
| A | 0 | 3 | 0 |
| B | 0 | 4 | 0 |
| C | 0 | 4 | 0 |
| D | 0 | 4 | 0 |
| Quadrant | Total seconds | Saturated seconds | Saturation percentage |
|---|---|---|---|
| A | 4134 | 15 | 0.362845% |
| B | 4134 | 31 | 0.749879% |
| C | 4134 | 219 | 5.297533% |
| D | 4134 | 1932 | 46.734398% |
Noise dominated data is calculated using 1-second bins in cleaned event files. If a bin has >2000 counts, and if more than 50% of those come from <1% of pixels, then it is considered to be noise-dominated and hence unusable.
| Quadrant | # 1 sec bins | Bins with >0 counts | Bins with >2000 counts | High rate bins dominated by noise | Noise dominated (total time) | Noise dominated (detector-on time) | Marked lightcurve |
|---|---|---|---|---|---|---|---|
| A | 4134 | 4134 | 1 | 1 | 0.02% | 0.02% | 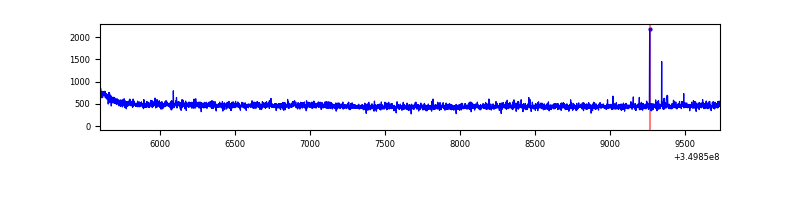 |
| B | 4134 | 4134 | 3 | 3 | 0.07% | 0.07% | 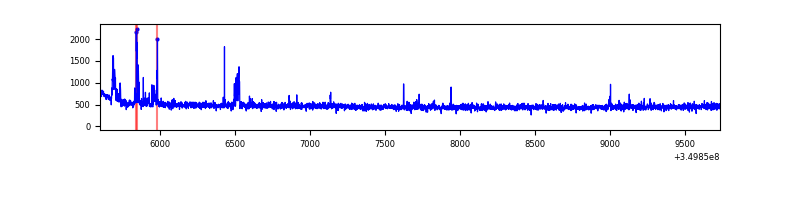 |
| C | 4134 | 4134 | 33 | 33 | 0.80% | 0.80% | 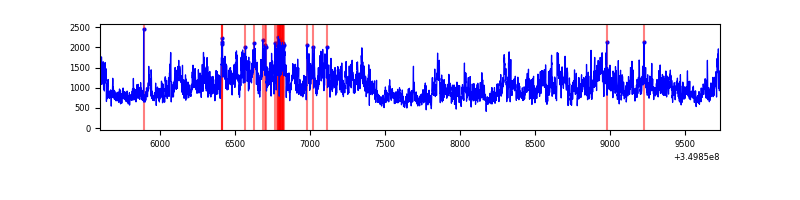 |
| D | 4134 | 4134 | 1970 | 1970 | 47.65% | 47.65% | 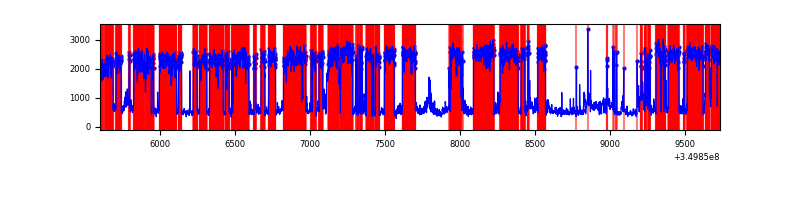 |
Top three noisy pixels from each quadrant. If the there are fewer than three noisy pixels in the level2.evt file, extra rows are filled as -1
| Pixel properties | Quadrant properties | ||||||
|---|---|---|---|---|---|---|---|
| Quadrant | DetID | PixID | Counts | Sigma | Mean | Median | Sigma |
| A | 12 | 96 | 11142 | 108.34 | 488 | 479 | 98.4 |
| A | 13 | 254 | 7346 | 69.77 | 488 | 479 | 98.4 |
| A | 3 | 137 | 4683 | 42.71 | 488 | 479 | 98.4 |
| B | 0 | 229 | 54495 | 583.37 | 482 | 470 | 92.6 |
| B | 10 | 245 | 22758 | 240.67 | 482 | 470 | 92.6 |
| B | 12 | 111 | 11250 | 116.4 | 482 | 470 | 92.6 |
| C | 3 | 233 | 2524915 | 23460.16 | 456 | 460 | 107.6 |
| C | 14 | 238 | 73935 | 682.81 | 456 | 460 | 107.6 |
| C | 2 | 114 | 9073 | 80.04 | 456 | 460 | 107.6 |
| D | 8 | 195 | 3893716 | 40315.34 | 402 | 390 | 96.6 |
| D | 1 | 52 | 904911 | 9366.3 | 402 | 390 | 96.6 |
| D | 12 | 79 | 47176 | 484.47 | 402 | 390 | 96.6 |
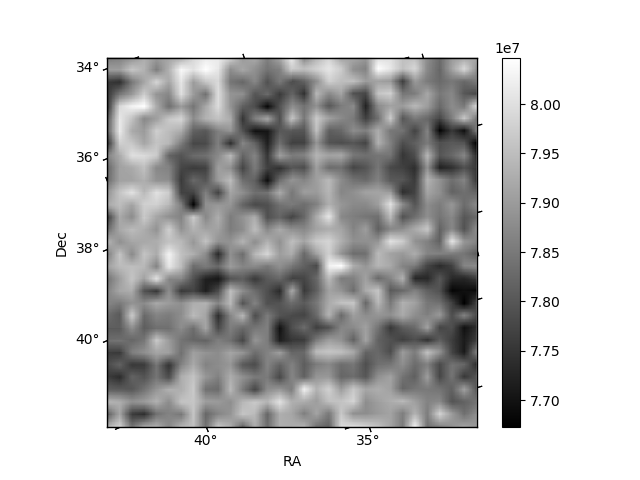
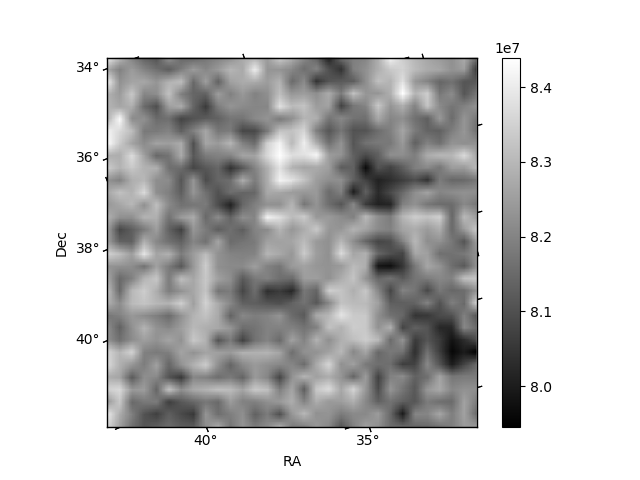
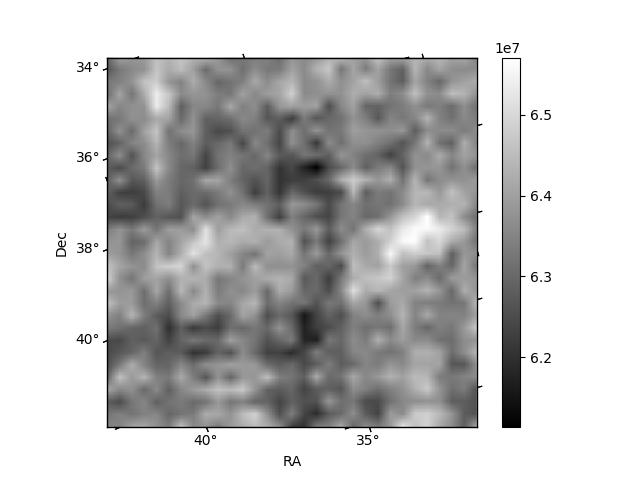
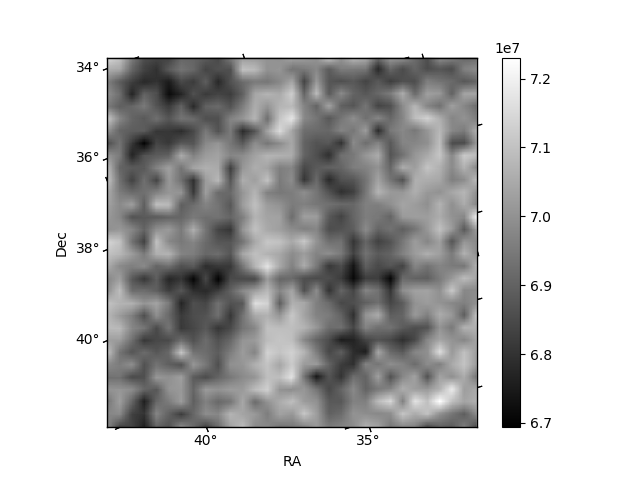
Histogram calculated using DETX and DETY for each event in the final _common_clean file
| Quadrant A | 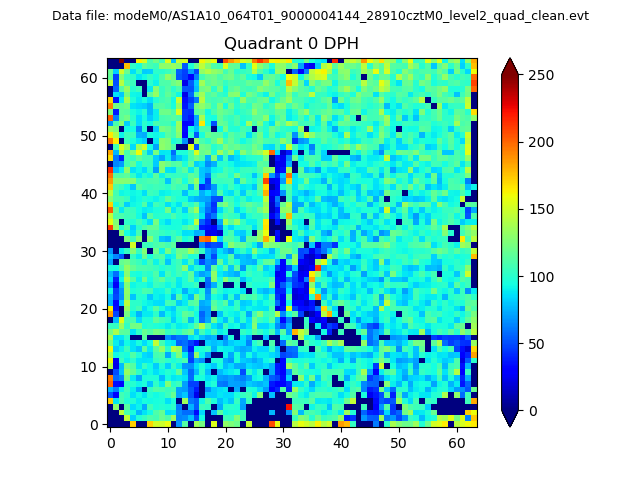 |
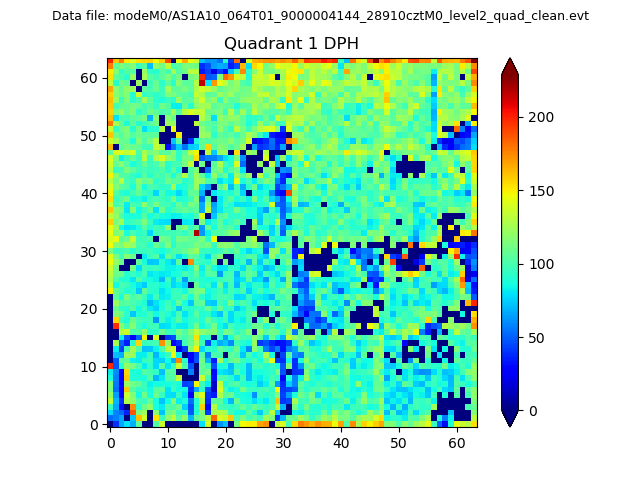 |
Quadrant B |
|---|---|---|---|
| Quadrant D |  |
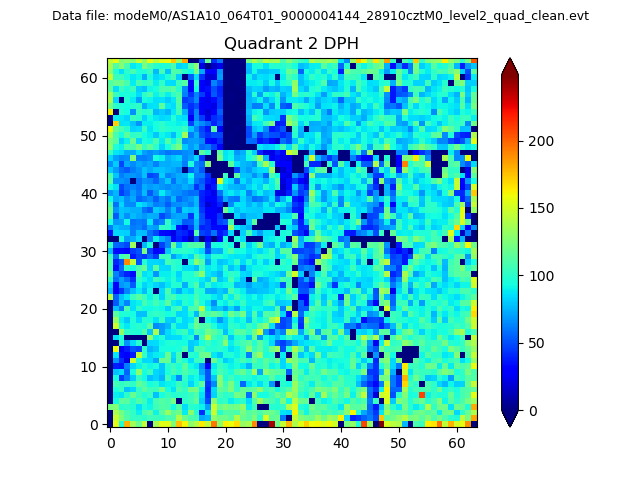 |
Quadrant C |
| Plot type | Count rate plots | Images |
|---|---|---|
| Comparison with Poisson distribution Blue bars denote a histogram of data divided into 1 sec bins. Red curve is a Poisson curve with rate = median count rate of data. |
 |
 |
| Quadrant-wise count rates Data is divided into 100 sec bins |
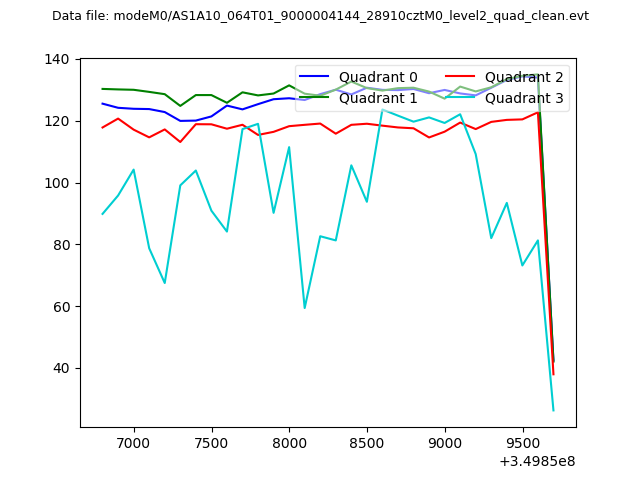 |
|
| Module-wise count rates for Quadrant A Data is divided into 100 sec bins |
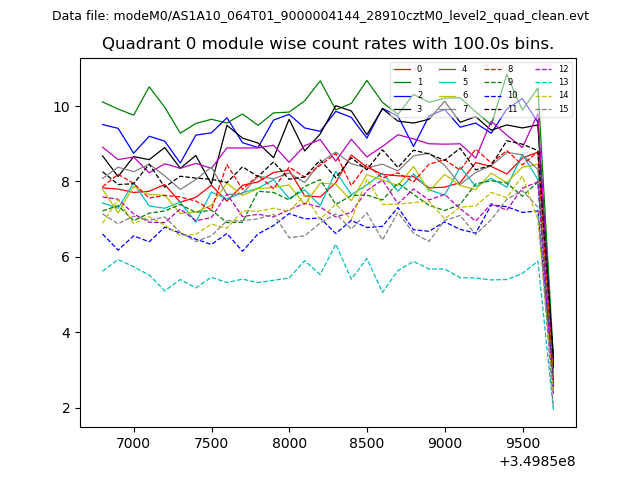 |
 |
| Module-wise count rates for Quadrant B Data is divided into 100 sec bins |
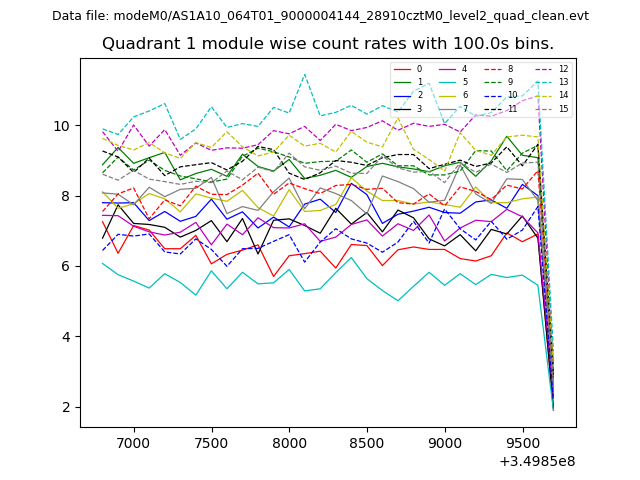 |
 |
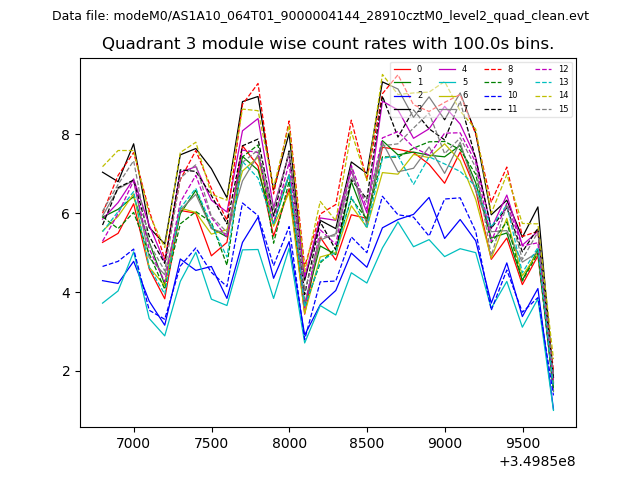
| Module-wise count rates for Quadrant C Data is divided into 100 sec bins |
 |
 |
| Module-wise count rates for Quadrant D Data is divided into 100 sec bins |
 |
 |
| Parameter | Plot |
|---|---|
| CZT HV Monitor |  |
| D_VDD | 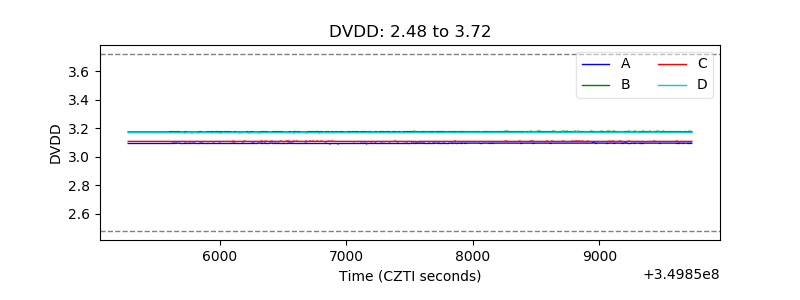 |
| Temperature 1 | 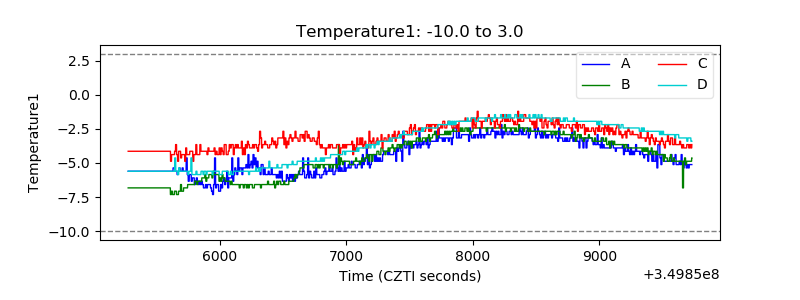 |
| Veto HV Monitor | 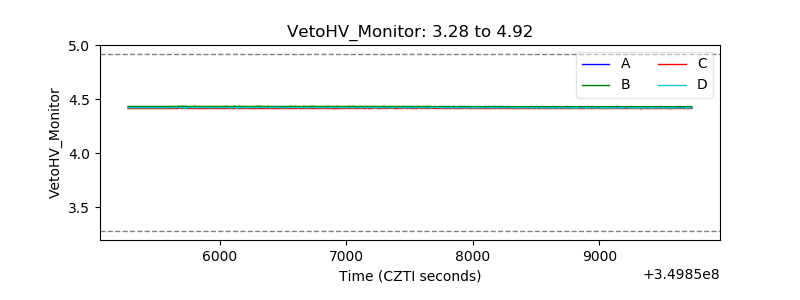 |
| Veto LLD | 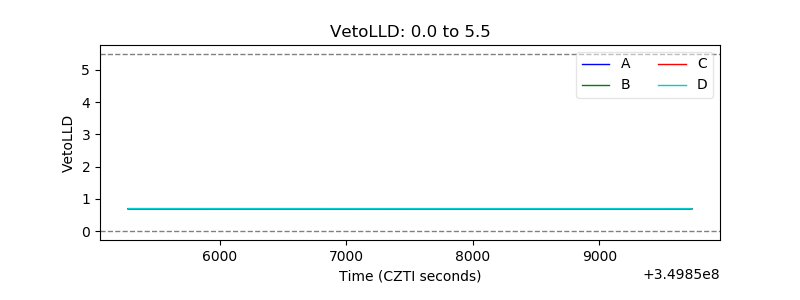 |
| Alpha Counter | 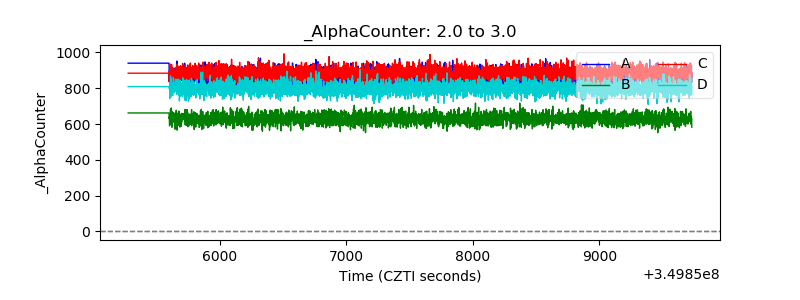 |
| _CPM_Rate | 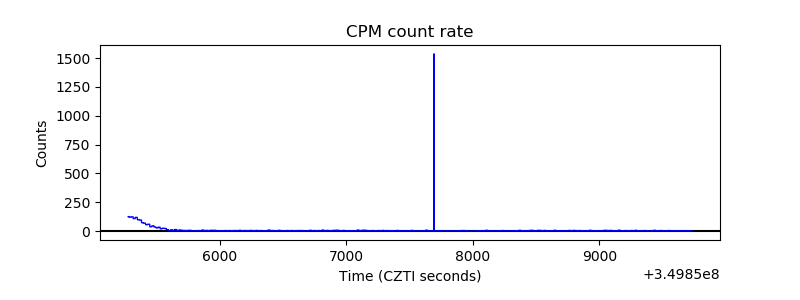 |
| CZT Counter | 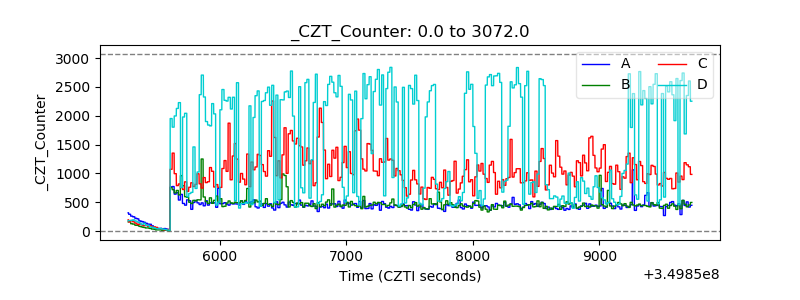 |
| +2.5 Volts monitor |  |
| +5 Volts monitor | 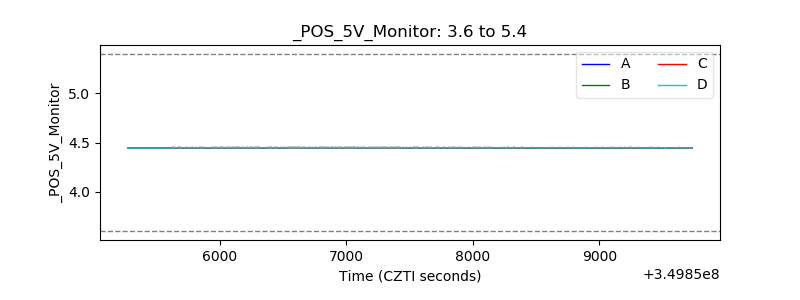 |
| _ROLL_ROT | 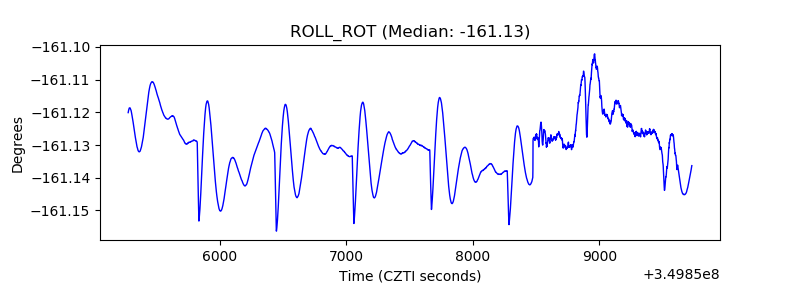 |
| _Roll_DEC | 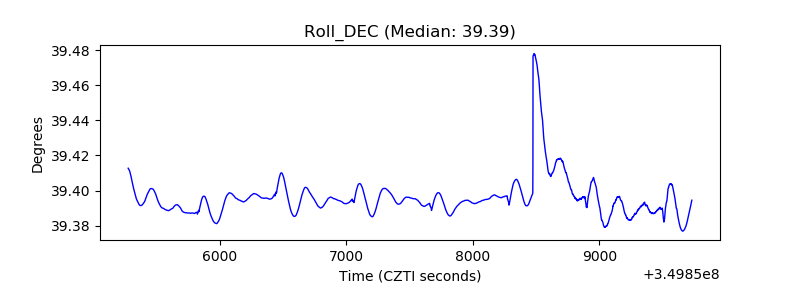 |
| _Roll_RA | 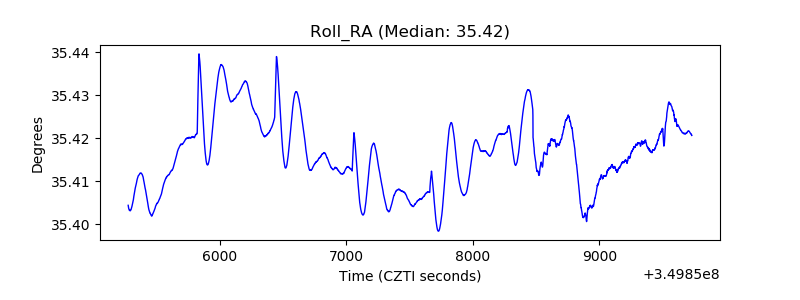 |
| Veto Counter | 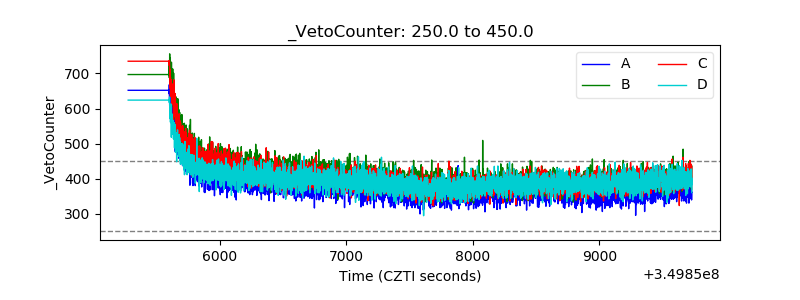 |