| Param | Original file | Final file |
|---|---|---|
| Filename | modeM0/AS1A10_115T03_9000004142cztM0_level2.fits | modeM0/AS1A10_115T03_9000004142cztM0_level2_quad_clean.evt |
| Size (bytes) | 187,966,080 | 208,595,520 |
| Size | 179.3 MB | 198.9 MB |
| Events in quadrant A | 1,150,462 | 1,303,181 |
| Events in quadrant B | 1,109,626 | 1,306,023 |
| Events in quadrant C | 1,104,576 | 1,227,221 |
| Events in quadrant D | 914,062 | 1,068,482 |
| Mode M0 | |||
|---|---|---|---|
| Quadrant | BADHDUFLAG | Total packets | Discarded packets |
| A | 0 | 41909 | 0 |
| B | 0 | 43333 | 0 |
| C | 0 | 50764 | 0 |
| D | 0 | 89147 | 0 |
| Mode SS | |||
|---|---|---|---|
| Quadrant | BADHDUFLAG | Total packets | Discarded packets |
| A | 0 | 418 | 0 |
| B | 0 | 418 | 0 |
| C | 0 | 418 | 0 |
| D | 0 | 418 | 0 |
| Mode M9 | |||
|---|---|---|---|
| Quadrant | BADHDUFLAG | Total packets | Discarded packets |
| A | 0 | 15 | 0 |
| B | 0 | 15 | 0 |
| C | 0 | 15 | 0 |
| D | 0 | 15 | 0 |
| Quadrant | Total seconds | Saturated seconds | Saturation percentage |
|---|---|---|---|
| A | 20498 | 166 | 0.809835% |
| B | 20499 | 289 | 1.409825% |
| C | 20499 | 837 | 4.083126% |
| D | 20499 | 3591 | 17.517928% |
Noise dominated data is calculated using 1-second bins in cleaned event files. If a bin has >2000 counts, and if more than 50% of those come from <1% of pixels, then it is considered to be noise-dominated and hence unusable.
| Quadrant | # 1 sec bins | Bins with >0 counts | Bins with >2000 counts | High rate bins dominated by noise | Noise dominated (total time) | Noise dominated (detector-on time) | Marked lightcurve |
|---|---|---|---|---|---|---|---|
| A | 22043 | 20496 | 0 | 0 | 0.00% | 0.00% |  |
| B | 22043 | 20494 | 0 | 0 | 0.00% | 0.00% |  |
| C | 22043 | 20472 | 0 | 0 | 0.00% | 0.00% |  |
| D | 22044 | 20486 | 0 | 0 | 0.00% | 0.00% |  |
Top three noisy pixels from each quadrant. If the there are fewer than three noisy pixels in the level2.evt file, extra rows are filled as -1
| Pixel properties | Quadrant properties | ||||||
|---|---|---|---|---|---|---|---|
| Quadrant | DetID | PixID | Counts | Sigma | Mean | Median | Sigma |
| A | 0 | 29 | 1123 | 10.92 | 300 | 280 | 77.2 |
| A | 7 | 110 | 907 | 8.12 | 300 | 280 | 77.2 |
| A | 9 | 19 | 855 | 7.45 | 300 | 280 | 77.2 |
| B | 2 | 9 | 887 | 10.04 | 293 | 278 | 60.7 |
| B | 2 | 8 | 753 | 7.83 | 293 | 278 | 60.7 |
| B | 14 | 254 | 749 | 7.76 | 293 | 278 | 60.7 |
| C | 12 | 241 | 804 | 7.03 | 292 | 272 | 75.7 |
| C | 3 | 187 | 764 | 6.5 | 292 | 272 | 75.7 |
| C | 3 | 126 | 762 | 6.47 | 292 | 272 | 75.7 |
| D | 4 | 246 | 722 | 6.8 | 260 | 236 | 71.5 |
| D | 3 | 14 | 701 | 6.5 | 260 | 236 | 71.5 |
| D | 15 | 46 | 662 | 5.96 | 260 | 236 | 71.5 |
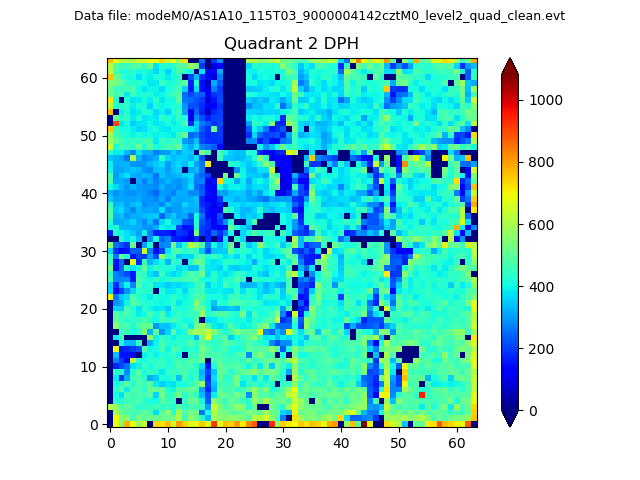
Histogram calculated using DETX and DETY for each event in the final _common_clean file
| Quadrant A | 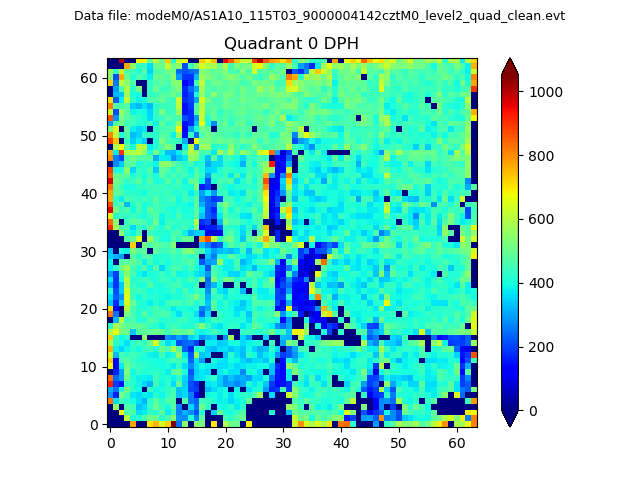 |
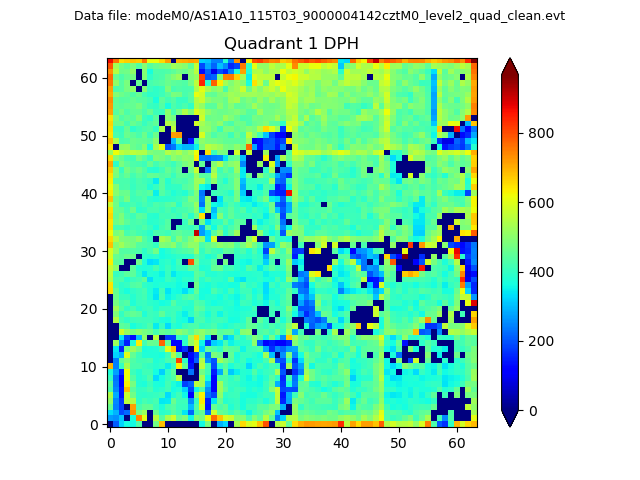 |
Quadrant B |
|---|---|---|---|
| Quadrant D | 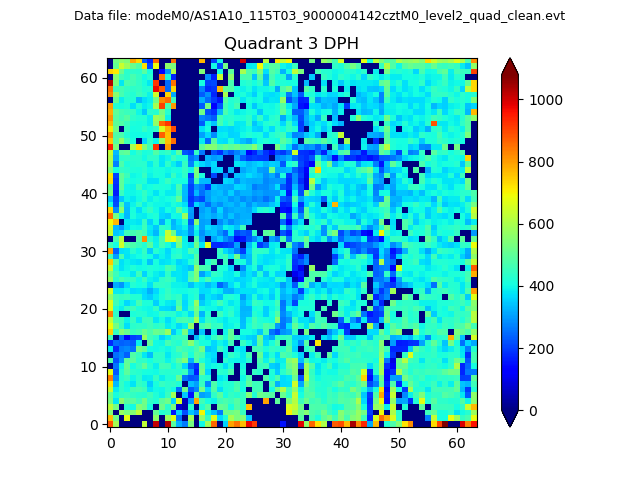 |
 |
Quadrant C |
| Plot type | Count rate plots | Images |
|---|---|---|
| Comparison with Poisson distribution Blue bars denote a histogram of data divided into 1 sec bins. Red curve is a Poisson curve with rate = median count rate of data. |
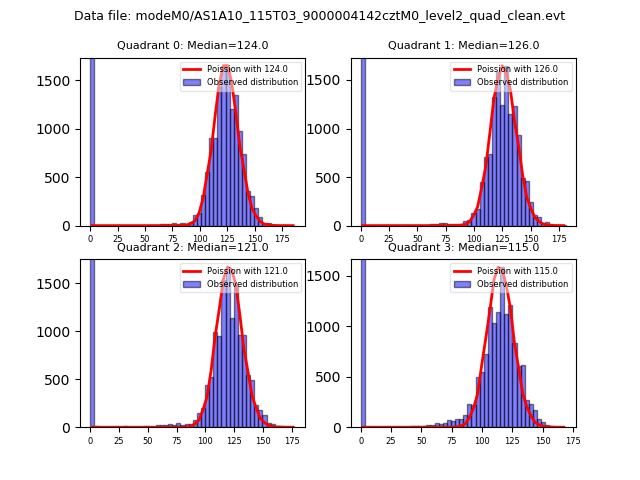 |
 |
| Quadrant-wise count rates Data is divided into 100 sec bins |
 |
|
| Module-wise count rates for Quadrant A Data is divided into 100 sec bins |
 |
 |
| Module-wise count rates for Quadrant B Data is divided into 100 sec bins |
 |
 |
| Module-wise count rates for Quadrant C Data is divided into 100 sec bins |
 |
 |
| Module-wise count rates for Quadrant D Data is divided into 100 sec bins |
 |
 |
| Parameter | Plot |
|---|---|
| CZT HV Monitor |  |
| D_VDD | 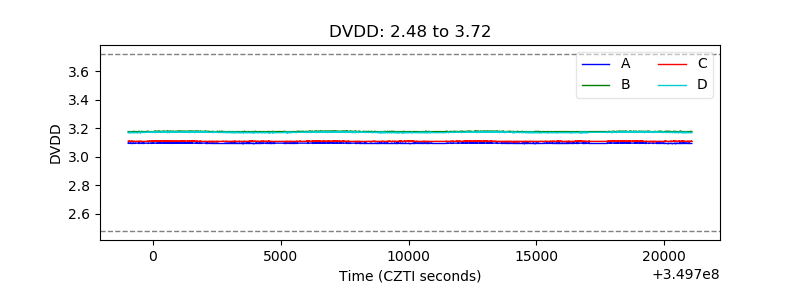 |
| Temperature 1 |  |
| Veto HV Monitor |  |
| Veto LLD | 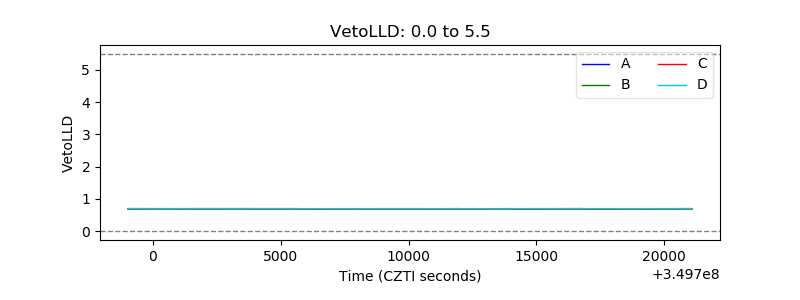 |
| Alpha Counter | 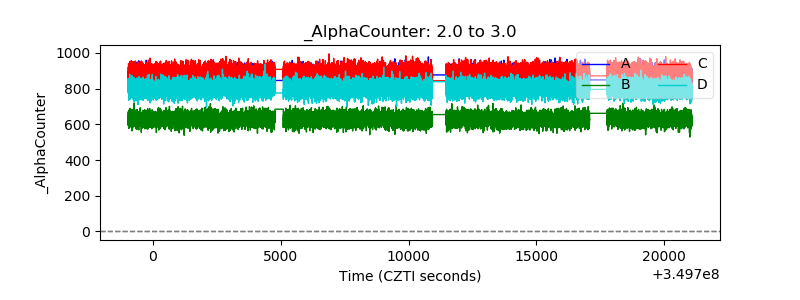 |
| _CPM_Rate | 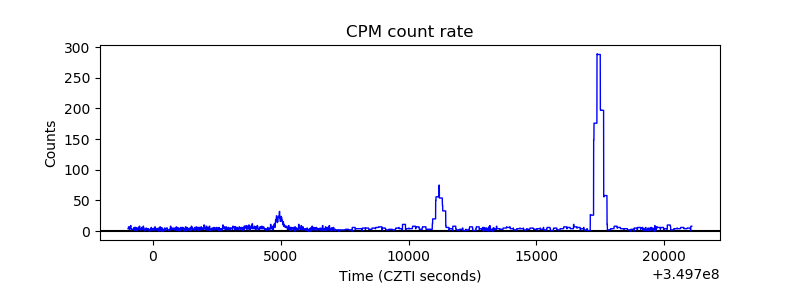 |
| CZT Counter |  |
| +2.5 Volts monitor |  |
| +5 Volts monitor |  |
| _ROLL_ROT |  |
| _Roll_DEC |  |
| _Roll_RA |  |
| Veto Counter | 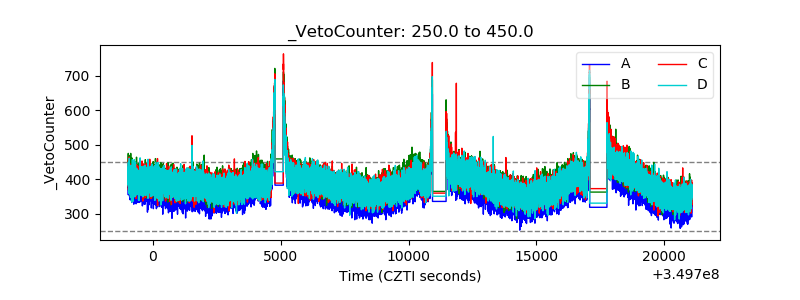 |