| Param | Original file | Final file |
|---|---|---|
| Filename | modeM0/AS1A10_115T03_9000004142_28883cztM0_level2.evt | modeM0/AS1A10_115T03_9000004142_28883cztM0_level2_quad_clean.evt |
| Size (bytes) | 803,485,440 | 82,100,160 |
| Size | 766.3 MB | 78.3 MB |
| Events in quadrant A | 3,475,338 | 515,024 |
| Events in quadrant B | 3,836,062 | 519,388 |
| Events in quadrant C | 4,196,237 | 494,686 |
| Events in quadrant D | 12,332,279 | 447,315 |
| Mode M0 | |||
|---|---|---|---|
| Quadrant | BADHDUFLAG | Total packets | Discarded packets |
| A | 0 | 15046 | 1 |
| B | 0 | 16042 | 1 |
| C | 0 | 17063 | 1 |
| D | 0 | 41734 | 1 |
| Mode SS | |||
|---|---|---|---|
| Quadrant | BADHDUFLAG | Total packets | Discarded packets |
| A | 0 | 148 | 0 |
| B | 0 | 148 | 0 |
| C | 0 | 148 | 0 |
| D | 0 | 148 | 0 |
| Mode M9 | |||
|---|---|---|---|
| Quadrant | BADHDUFLAG | Total packets | Discarded packets |
| A | 0 | 4 | 0 |
| B | 0 | 4 | 0 |
| C | 0 | 4 | 0 |
| D | 0 | 4 | 0 |
| Quadrant | Total seconds | Saturated seconds | Saturation percentage |
|---|---|---|---|
| A | 7313 | 82 | 1.121291% |
| B | 7313 | 171 | 2.338302% |
| C | 7313 | 304 | 4.156981% |
| D | 7313 | 2408 | 32.927663% |
Noise dominated data is calculated using 1-second bins in cleaned event files. If a bin has >2000 counts, and if more than 50% of those come from <1% of pixels, then it is considered to be noise-dominated and hence unusable.
| Quadrant | # 1 sec bins | Bins with >0 counts | Bins with >2000 counts | High rate bins dominated by noise | Noise dominated (total time) | Noise dominated (detector-on time) | Marked lightcurve |
|---|---|---|---|---|---|---|---|
| A | 7643 | 7313 | 4 | 4 | 0.05% | 0.05% | 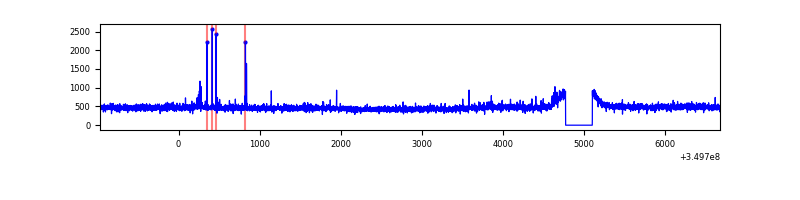 |
| B | 7643 | 7313 | 64 | 64 | 0.84% | 0.88% |  |
| C | 7643 | 7313 | 28 | 28 | 0.37% | 0.38% | 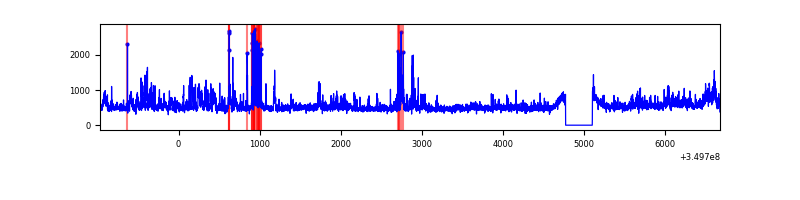 |
| D | 7643 | 7313 | 2422 | 2422 | 31.69% | 33.12% | 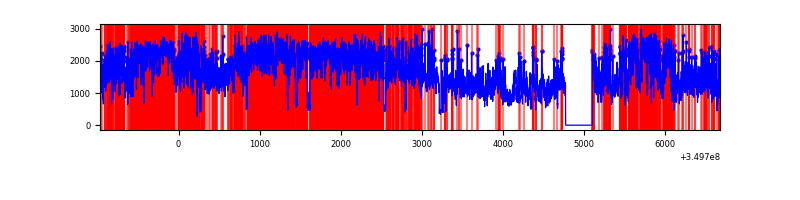 |
Top three noisy pixels from each quadrant. If the there are fewer than three noisy pixels in the level2.evt file, extra rows are filled as -1
| Pixel properties | Quadrant properties | ||||||
|---|---|---|---|---|---|---|---|
| Quadrant | DetID | PixID | Counts | Sigma | Mean | Median | Sigma |
| A | 12 | 96 | 36029 | 198.25 | 883 | 863 | 177.4 |
| A | 14 | 235 | 17219 | 92.21 | 883 | 863 | 177.4 |
| A | 13 | 254 | 13439 | 70.9 | 883 | 863 | 177.4 |
| B | 10 | 245 | 370675 | 2195.37 | 871 | 847 | 168.5 |
| B | 12 | 111 | 20817 | 118.55 | 871 | 847 | 168.5 |
| B | 11 | 111 | 18967 | 107.56 | 871 | 847 | 168.5 |
| C | 3 | 233 | 456094 | 2354.44 | 830 | 833 | 193.4 |
| C | 14 | 238 | 187301 | 964.34 | 830 | 833 | 193.4 |
| C | 15 | 208 | 176557 | 908.78 | 830 | 833 | 193.4 |
| D | 8 | 195 | 6506810 | 34514.92 | 777 | 753 | 188.5 |
| D | 1 | 52 | 2653668 | 14073.83 | 777 | 753 | 188.5 |
| D | 12 | 233 | 142409 | 751.49 | 777 | 753 | 188.5 |
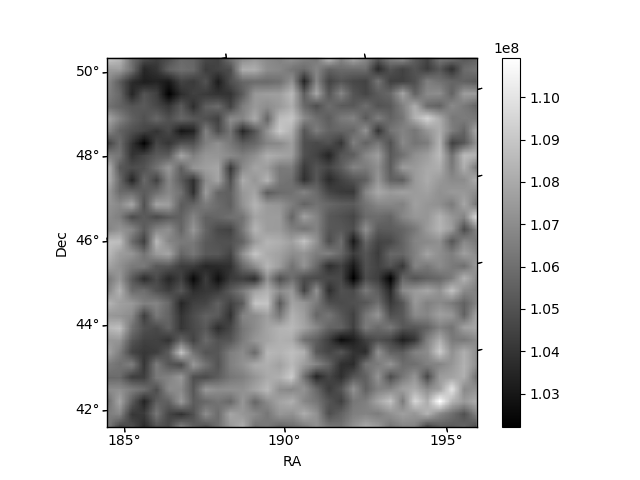
Histogram calculated using DETX and DETY for each event in the final _common_clean file
| Quadrant A |  |
 |
Quadrant B |
|---|---|---|---|
| Quadrant D |  |
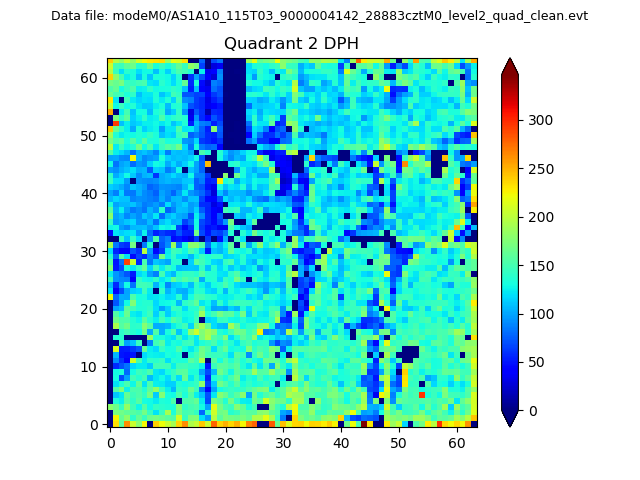 |
Quadrant C |
| Plot type | Count rate plots | Images |
|---|---|---|
| Comparison with Poisson distribution Blue bars denote a histogram of data divided into 1 sec bins. Red curve is a Poisson curve with rate = median count rate of data. |
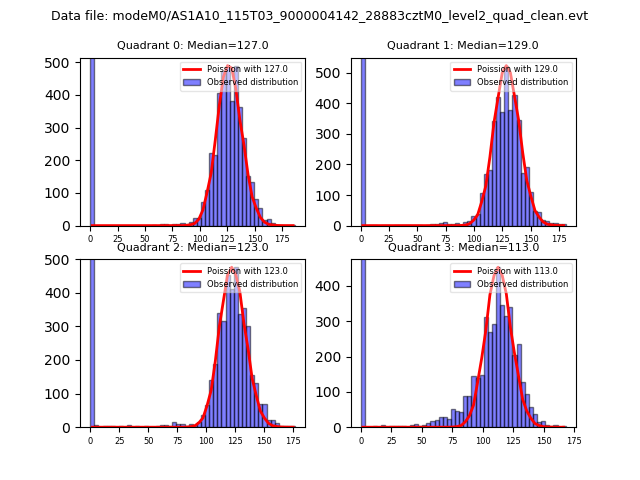 |
 |
| Quadrant-wise count rates Data is divided into 100 sec bins |
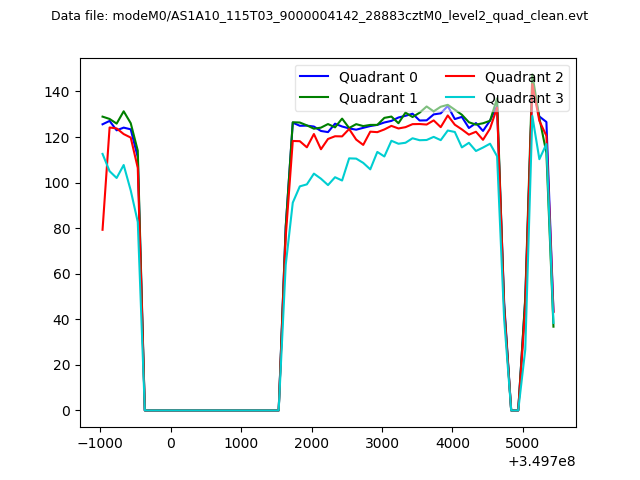 |
|
| Module-wise count rates for Quadrant A Data is divided into 100 sec bins |
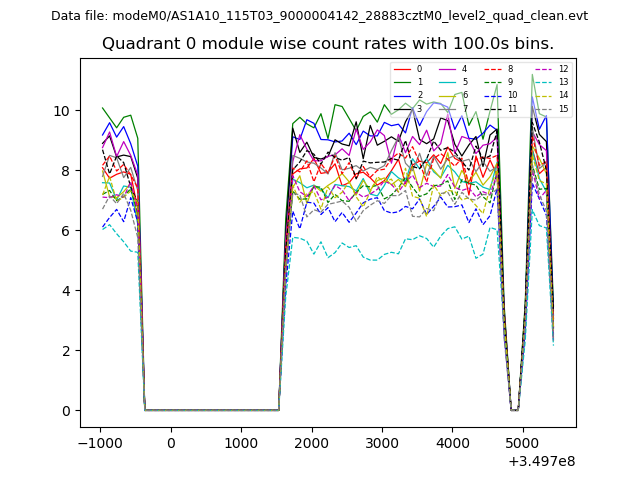 |
 |
| Module-wise count rates for Quadrant B Data is divided into 100 sec bins |
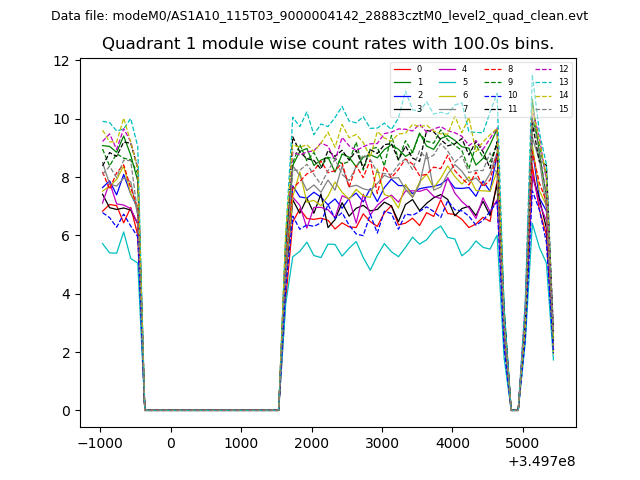 |
 |
| Module-wise count rates for Quadrant C Data is divided into 100 sec bins |
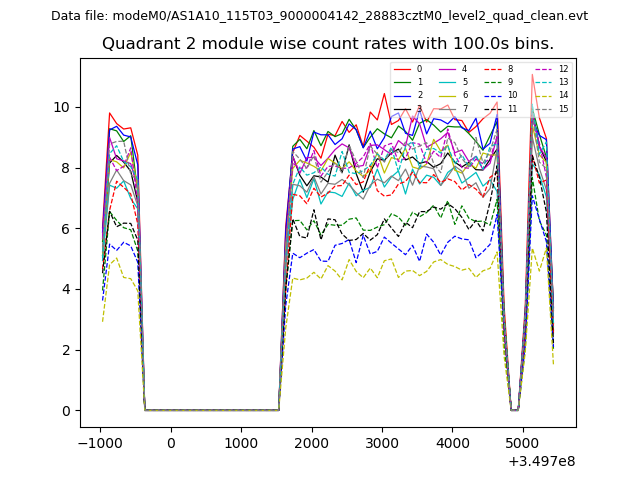 |
 |
| Module-wise count rates for Quadrant D Data is divided into 100 sec bins |
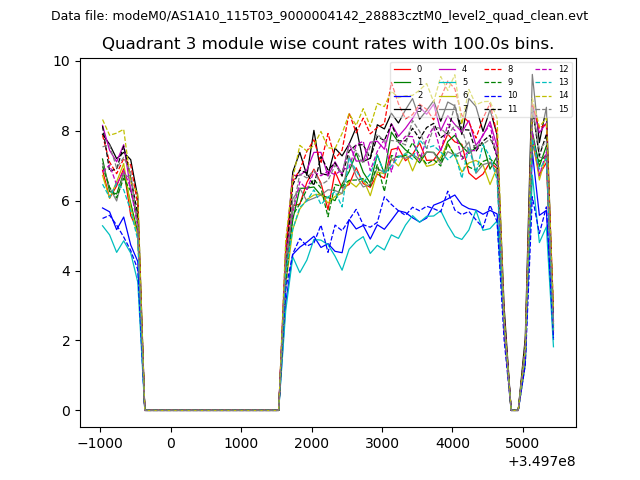 |
 |
| Parameter | Plot |
|---|---|
| CZT HV Monitor | 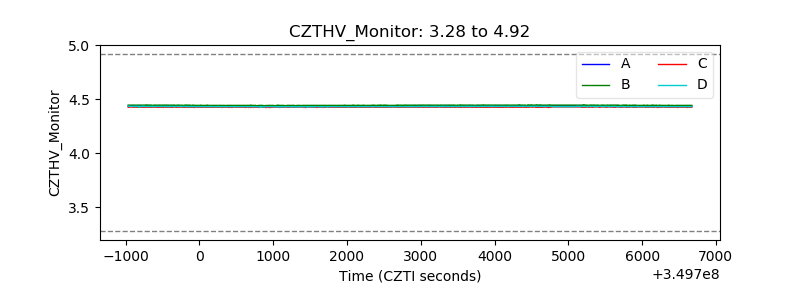 |
| D_VDD | 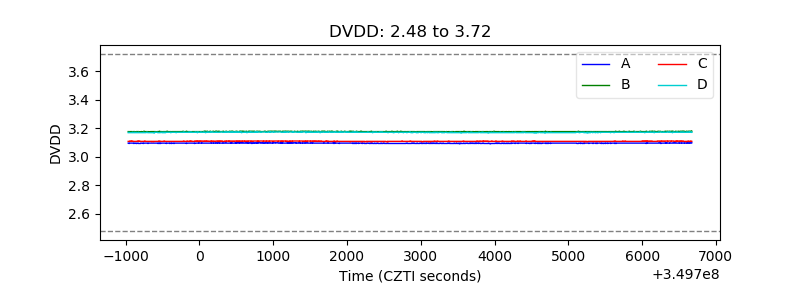 |
| Temperature 1 | 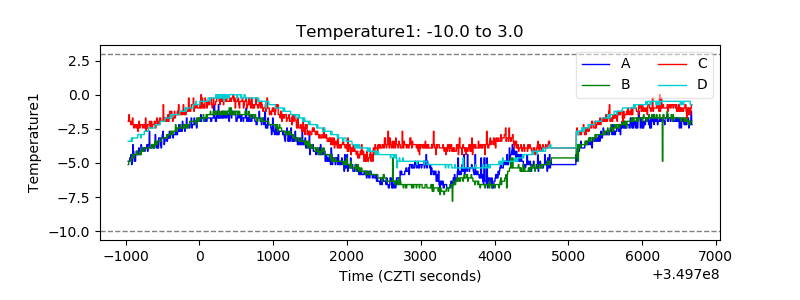 |
| Veto HV Monitor | 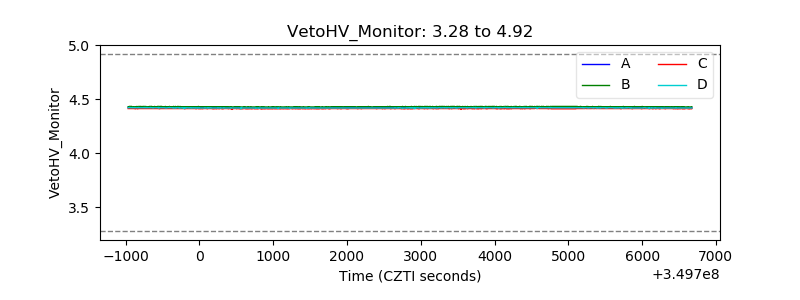 |
| Veto LLD |  |
| Alpha Counter | 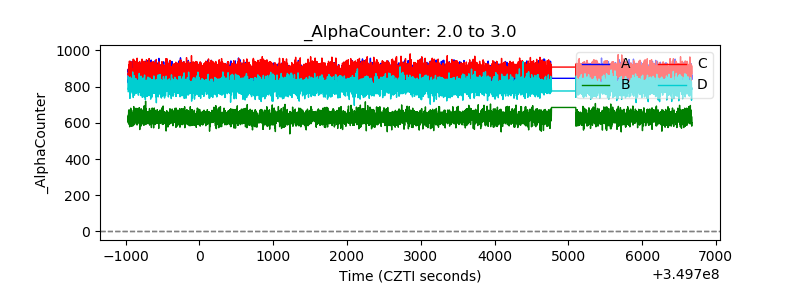 |
| _CPM_Rate | 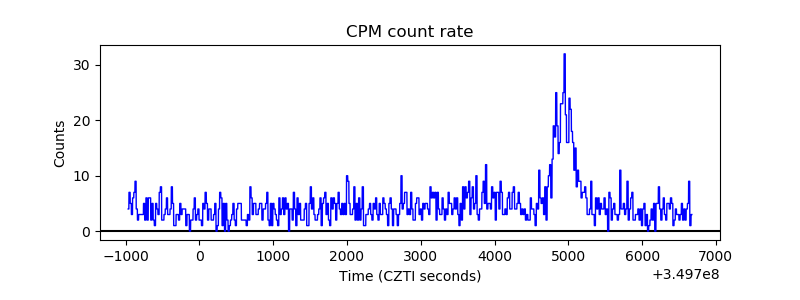 |
| CZT Counter | 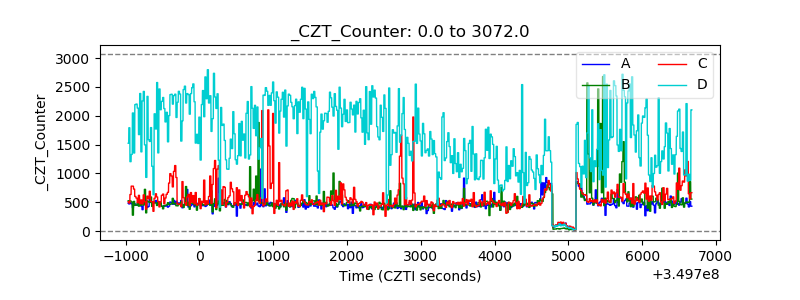 |
| +2.5 Volts monitor |  |
| +5 Volts monitor | 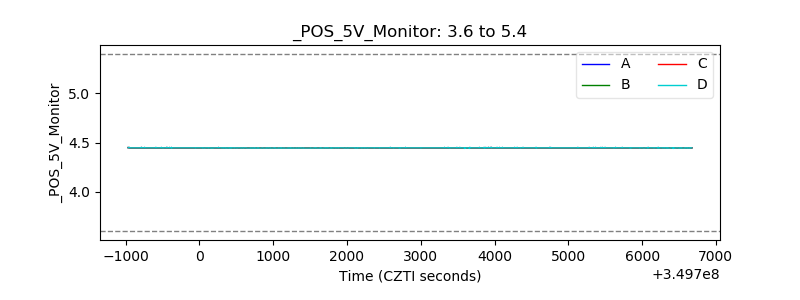 |
| _ROLL_ROT | 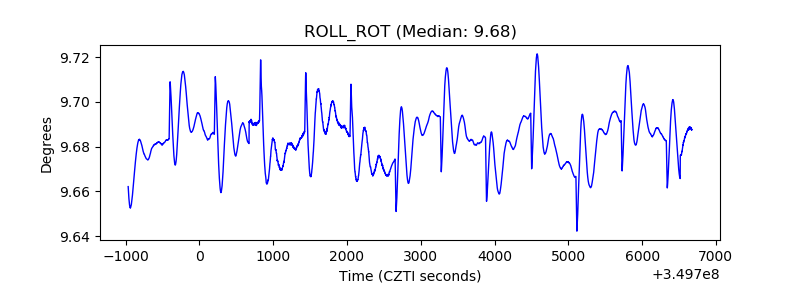 |
| _Roll_DEC | 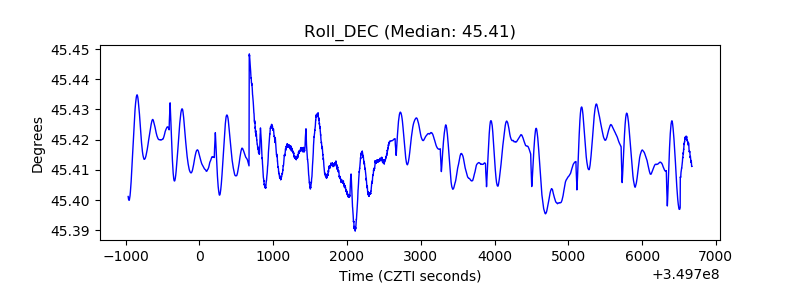 |
| _Roll_RA |  |
| Veto Counter | 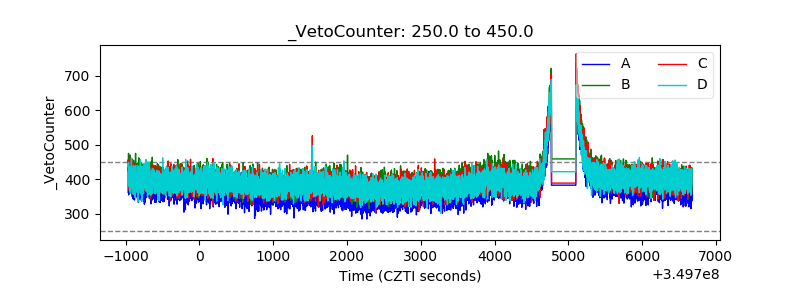 |