| Param | Original file | Final file |
|---|---|---|
| Filename | modeM0/AS1A10_115T03_9000004142_28886cztM0_level2.evt | modeM0/AS1A10_115T03_9000004142_28886cztM0_level2_quad_clean.evt |
| Size (bytes) | 1,320,488,640 | 183,689,280 |
| Size | 1.2 GB | 175.2 MB |
| Events in quadrant A | 6,869,382 | 1,159,303 |
| Events in quadrant B | 7,289,128 | 1,175,772 |
| Events in quadrant C | 9,399,967 | 1,122,807 |
| Events in quadrant D | 15,437,020 | 1,085,749 |
| Mode M0 | |||
|---|---|---|---|
| Quadrant | BADHDUFLAG | Total packets | Discarded packets |
| A | 0 | 30147 | 3 |
| B | 0 | 31265 | 3 |
| C | 0 | 37633 | 3 |
| D | 0 | 56056 | 3 |
| Mode SS | |||
|---|---|---|---|
| Quadrant | BADHDUFLAG | Total packets | Discarded packets |
| A | 0 | 302 | 0 |
| B | 0 | 302 | 0 |
| C | 0 | 302 | 0 |
| D | 0 | 302 | 0 |
| Mode M9 | |||
|---|---|---|---|
| Quadrant | BADHDUFLAG | Total packets | Discarded packets |
| A | 0 | 11 | 0 |
| B | 0 | 12 | 0 |
| C | 0 | 12 | 0 |
| D | 0 | 12 | 0 |
| Quadrant | Total seconds | Saturated seconds | Saturation percentage |
|---|---|---|---|
| A | 14759 | 111 | 0.752083% |
| B | 14759 | 213 | 1.443187% |
| C | 14759 | 603 | 4.085643% |
| D | 14759 | 1687 | 11.430314% |
Noise dominated data is calculated using 1-second bins in cleaned event files. If a bin has >2000 counts, and if more than 50% of those come from <1% of pixels, then it is considered to be noise-dominated and hence unusable.
| Quadrant | # 1 sec bins | Bins with >0 counts | Bins with >2000 counts | High rate bins dominated by noise | Noise dominated (total time) | Noise dominated (detector-on time) | Marked lightcurve |
|---|---|---|---|---|---|---|---|
| A | 15974 | 14759 | 0 | 0 | 0.00% | 0.00% | 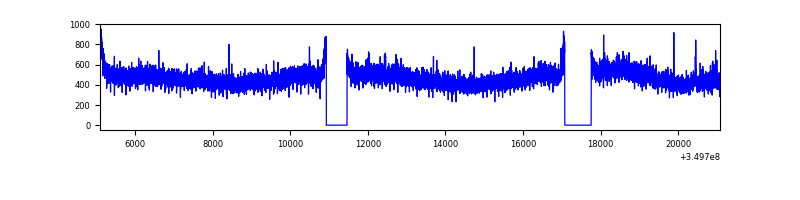 |
| B | 15974 | 14759 | 49 | 49 | 0.31% | 0.33% | 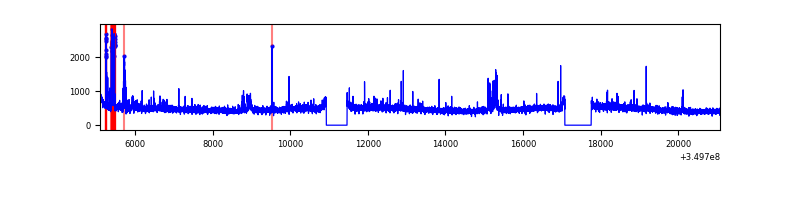 |
| C | 15974 | 14759 | 106 | 106 | 0.66% | 0.72% | 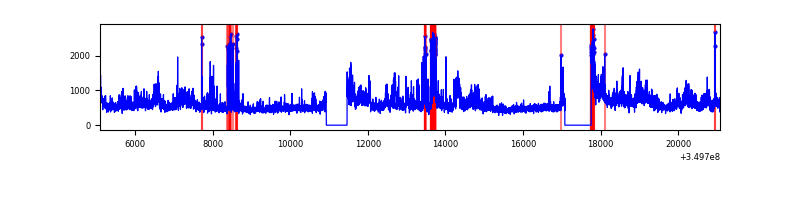 |
| D | 15974 | 14759 | 1569 | 1569 | 9.82% | 10.63% | 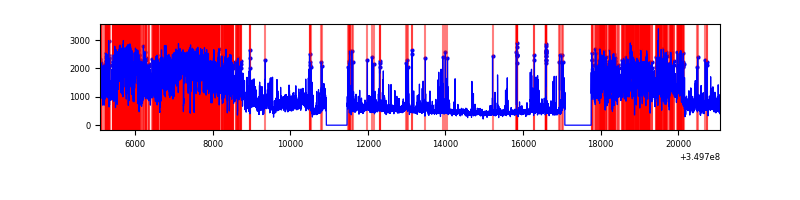 |
Top three noisy pixels from each quadrant. If the there are fewer than three noisy pixels in the level2.evt file, extra rows are filled as -1
| Pixel properties | Quadrant properties | ||||||
|---|---|---|---|---|---|---|---|
| Quadrant | DetID | PixID | Counts | Sigma | Mean | Median | Sigma |
| A | 6 | 16 | 46815 | 127.87 | 1755 | 1717 | 352.7 |
| A | 15 | 174 | 30513 | 81.65 | 1755 | 1717 | 352.7 |
| A | 13 | 254 | 27692 | 73.65 | 1755 | 1717 | 352.7 |
| B | 10 | 245 | 346194 | 1029.03 | 1745 | 1699 | 334.8 |
| B | 0 | 183 | 45804 | 131.74 | 1745 | 1699 | 334.8 |
| B | 12 | 111 | 41740 | 119.6 | 1745 | 1699 | 334.8 |
| C | 3 | 233 | 1972109 | 5060.02 | 1669 | 1678 | 389.4 |
| C | 15 | 208 | 461524 | 1180.87 | 1669 | 1678 | 389.4 |
| C | 14 | 238 | 320892 | 819.73 | 1669 | 1678 | 389.4 |
| D | 8 | 195 | 6607485 | 16449.84 | 1655 | 1607 | 401.6 |
| D | 1 | 52 | 2185437 | 5438.14 | 1655 | 1607 | 401.6 |
| D | 7 | 80 | 166722 | 411.17 | 1655 | 1607 | 401.6 |
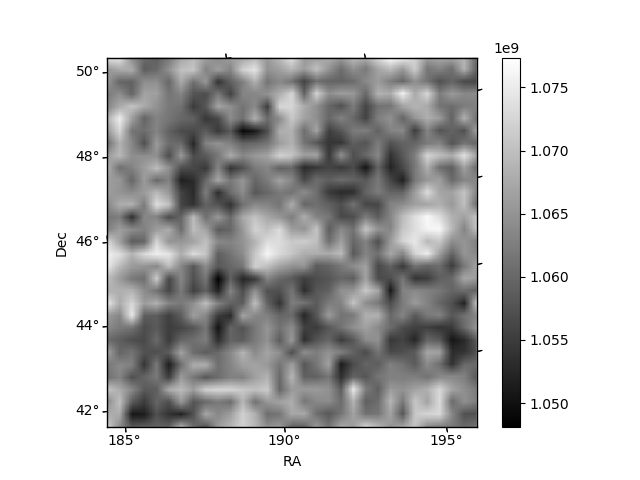
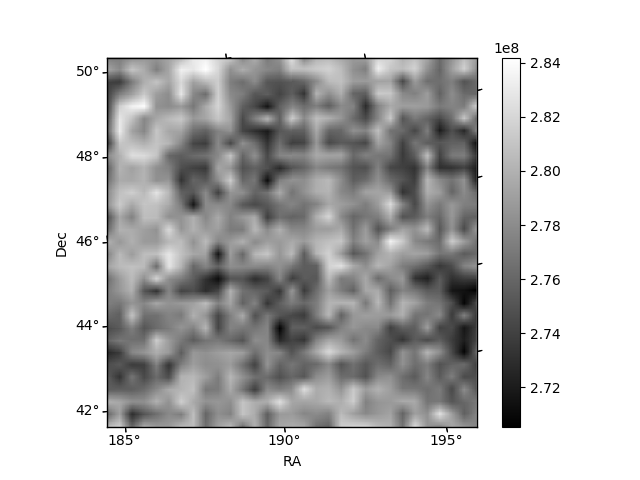
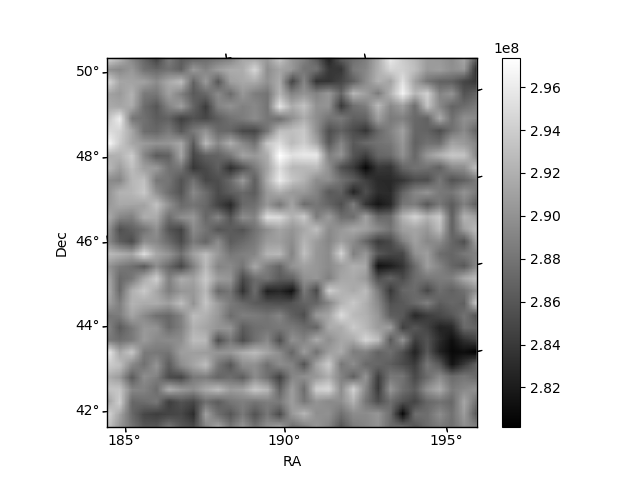
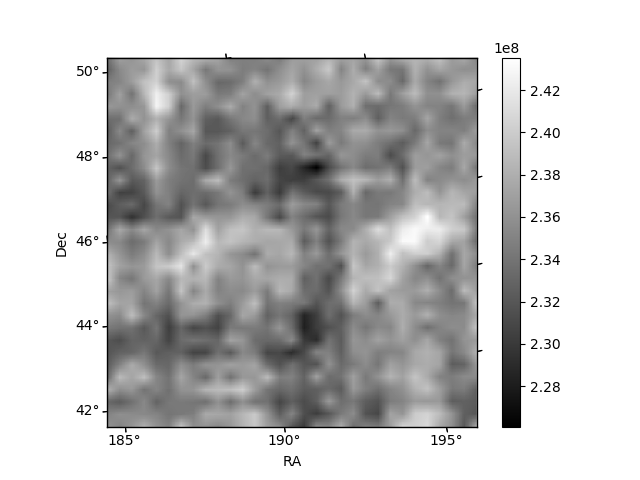
Histogram calculated using DETX and DETY for each event in the final _common_clean file
| Quadrant A | 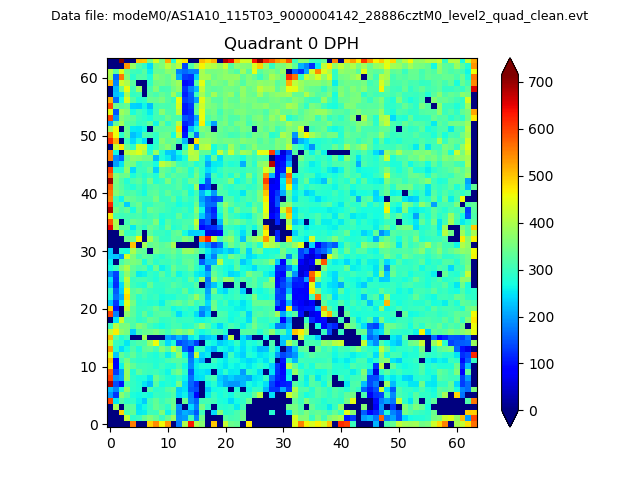 |
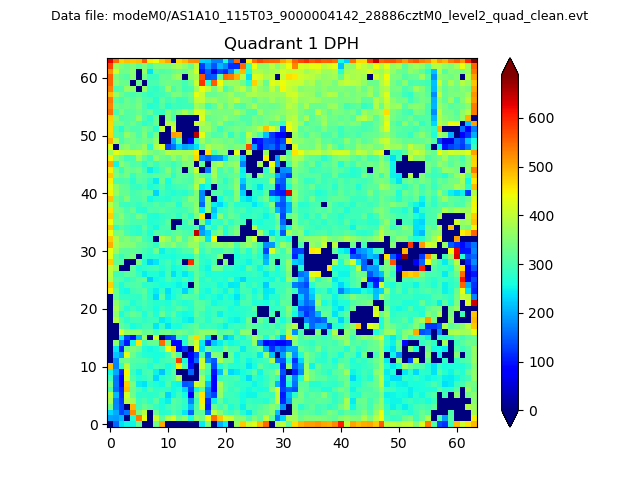 |
Quadrant B |
|---|---|---|---|
| Quadrant D | 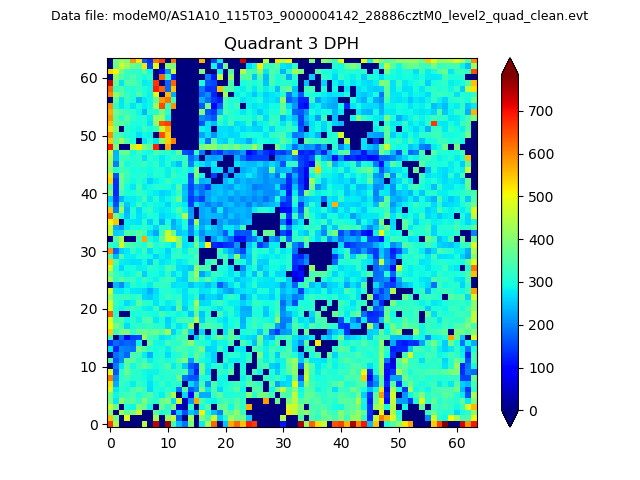 |
 |
Quadrant C |
| Plot type | Count rate plots | Images |
|---|---|---|
| Comparison with Poisson distribution Blue bars denote a histogram of data divided into 1 sec bins. Red curve is a Poisson curve with rate = median count rate of data. |
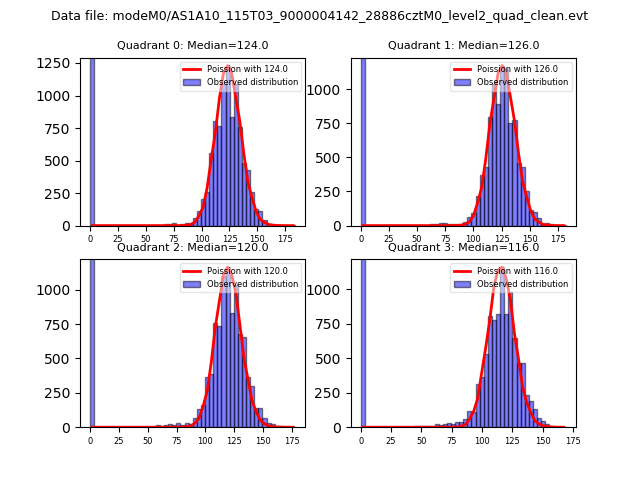 |
 |
| Quadrant-wise count rates Data is divided into 100 sec bins |
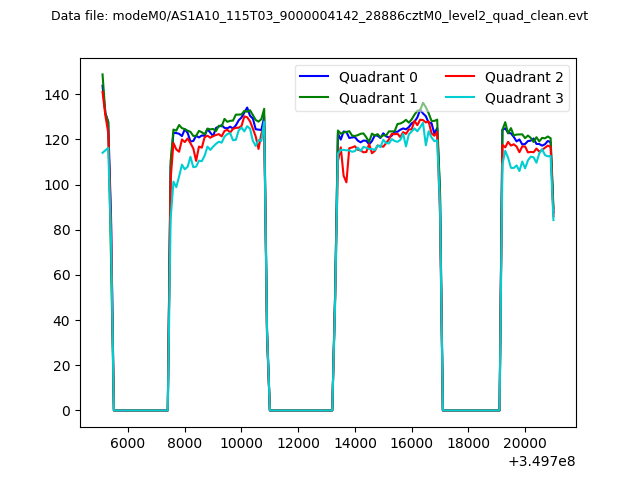 |
|
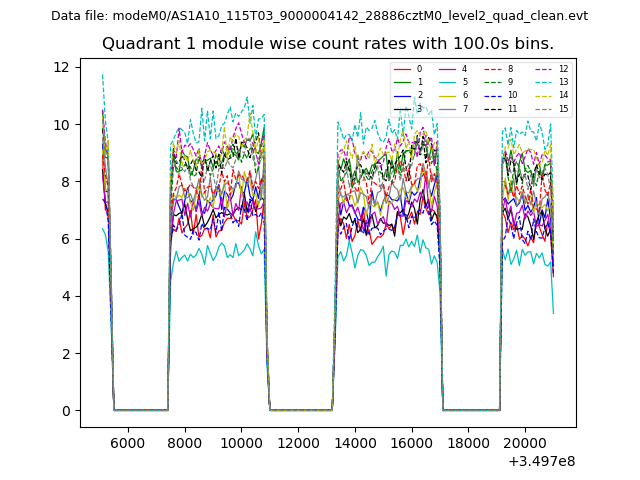
| Module-wise count rates for Quadrant A Data is divided into 100 sec bins |
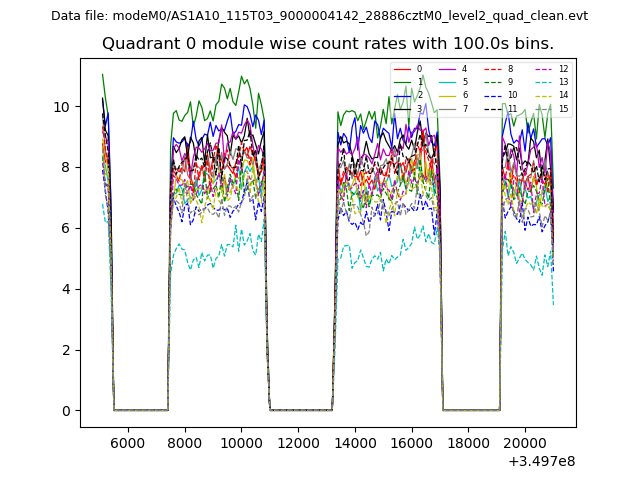 |
 |
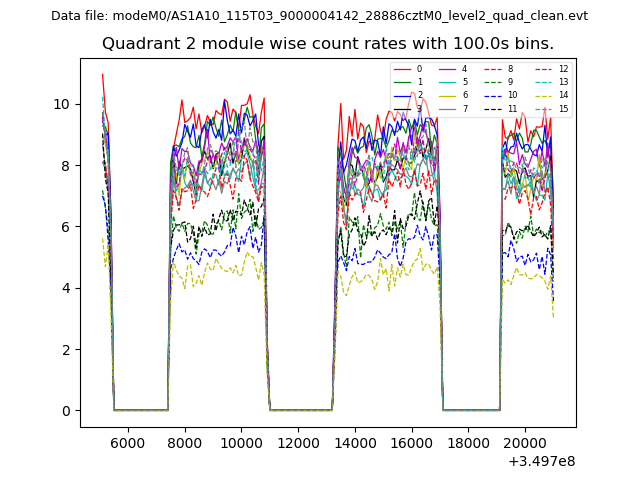
| Module-wise count rates for Quadrant B Data is divided into 100 sec bins |
 |
 |
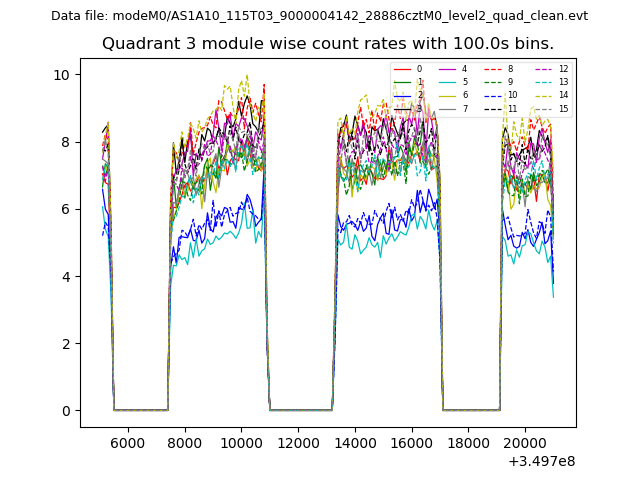
| Module-wise count rates for Quadrant C Data is divided into 100 sec bins |
 |
 |
| Module-wise count rates for Quadrant D Data is divided into 100 sec bins |
 |
 |
| Parameter | Plot |
|---|---|
| CZT HV Monitor | 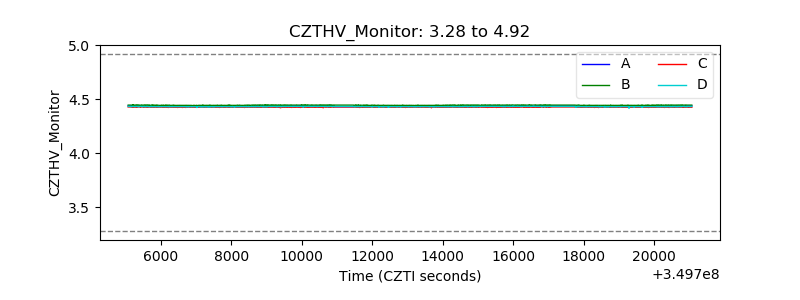 |
| D_VDD | 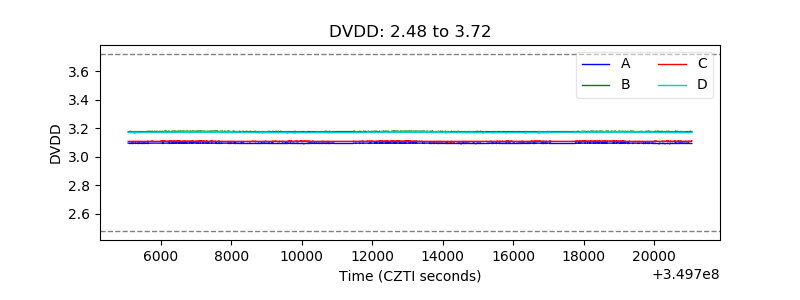 |
| Temperature 1 |  |
| Veto HV Monitor |  |
| Veto LLD |  |
| Alpha Counter | 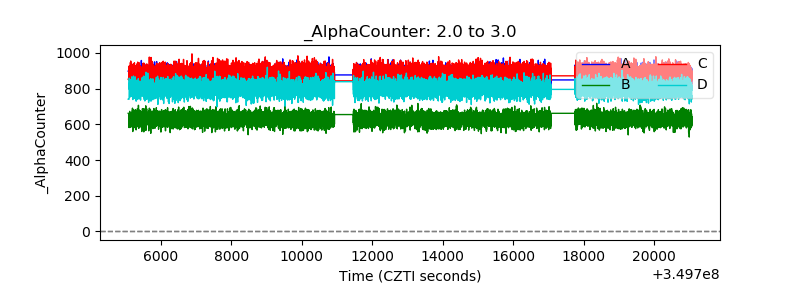 |
| _CPM_Rate | 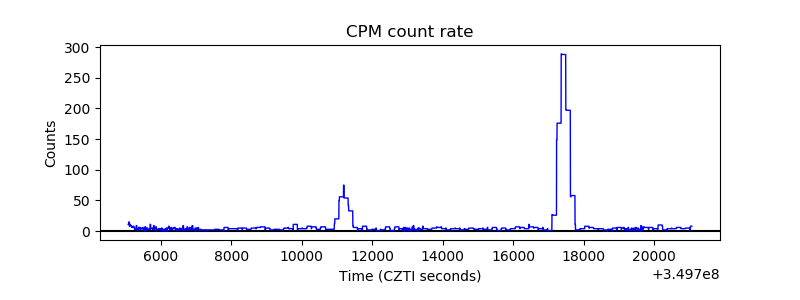 |
| CZT Counter |  |
| +2.5 Volts monitor |  |
| +5 Volts monitor | 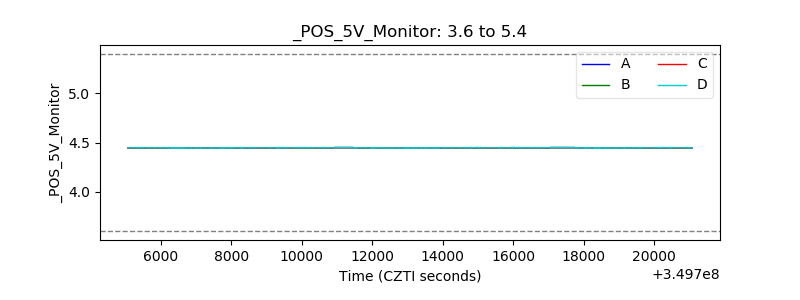 |
| _ROLL_ROT | 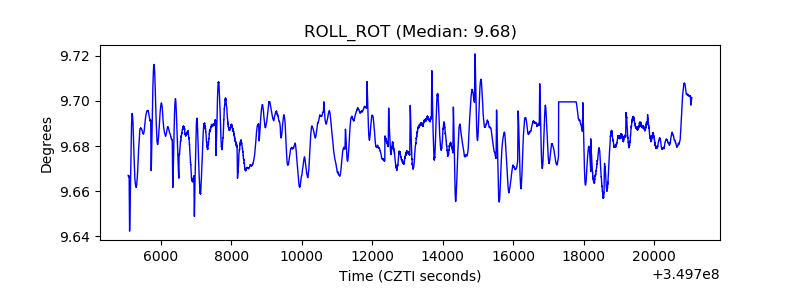 |
| _Roll_DEC | 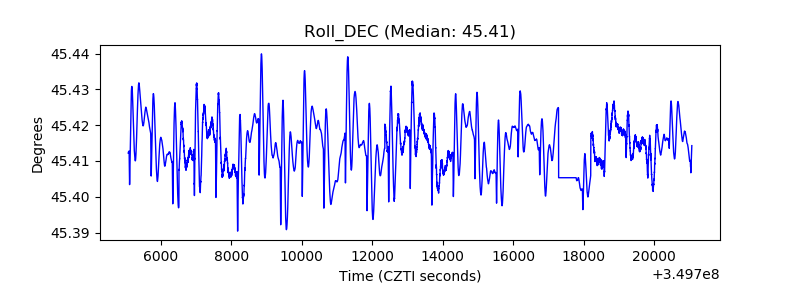 |
| _Roll_RA | 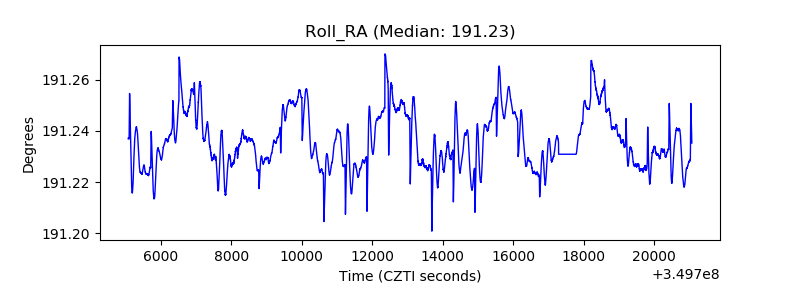 |
| Veto Counter | 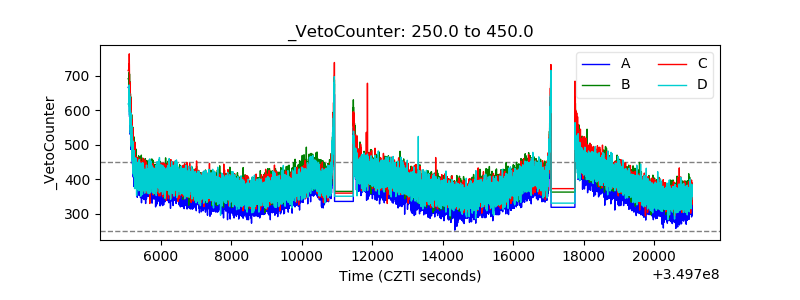 |