| Param | Original file | Final file |
|---|---|---|
| Filename | modeM0/AS1A10_048T07_9000004148cztM0_level2.fits | modeM0/AS1A10_048T07_9000004148cztM0_level2_quad_clean.evt |
| Size (bytes) | 791,058,240 | 653,374,080 |
| Size | 754.4 MB | 623.1 MB |
| Events in quadrant A | 4,923,894 | 3,748,995 |
| Events in quadrant B | 4,754,994 | 3,814,404 |
| Events in quadrant C | 4,664,040 | 3,471,236 |
| Events in quadrant D | 4,105,140 | 3,245,449 |
| Mode M0 | |||
|---|---|---|---|
| Quadrant | BADHDUFLAG | Total packets | Discarded packets |
| A | 0 | 167645 | 0 |
| B | 0 | 170007 | 0 |
| C | 0 | 244800 | 0 |
| D | 0 | 257650 | 0 |
| Mode M9 | |||
|---|---|---|---|
| Quadrant | BADHDUFLAG | Total packets | Discarded packets |
| A | 0 | 132 | 0 |
| B | 0 | 132 | 0 |
| C | 0 | 132 | 0 |
| D | 0 | 132 | 0 |
| Mode SS | |||
|---|---|---|---|
| Quadrant | BADHDUFLAG | Total packets | Discarded packets |
| A | 0 | 1636 | 0 |
| B | 0 | 1636 | 0 |
| C | 0 | 1636 | 0 |
| D | 0 | 1636 | 0 |
| Quadrant | Total seconds | Saturated seconds | Saturation percentage |
|---|---|---|---|
| A | 80294 | 882 | 1.098463% |
| B | 80294 | 1092 | 1.360002% |
| C | 80294 | 5590 | 6.961915% |
| D | 80294 | 5288 | 6.585797% |
Noise dominated data is calculated using 1-second bins in cleaned event files. If a bin has >2000 counts, and if more than 50% of those come from <1% of pixels, then it is considered to be noise-dominated and hence unusable.
| Quadrant | # 1 sec bins | Bins with >0 counts | Bins with >2000 counts | High rate bins dominated by noise | Noise dominated (total time) | Noise dominated (detector-on time) | Marked lightcurve |
|---|---|---|---|---|---|---|---|
| A | 93638 | 80290 | 0 | 0 | 0.00% | 0.00% | 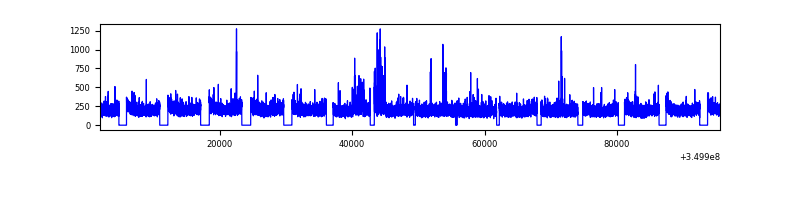 |
| B | 93638 | 80289 | 0 | 0 | 0.00% | 0.00% |  |
| C | 93639 | 80256 | 0 | 0 | 0.00% | 0.00% |  |
| D | 93639 | 80283 | 0 | 0 | 0.00% | 0.00% |  |
Top three noisy pixels from each quadrant. If the there are fewer than three noisy pixels in the level2.evt file, extra rows are filled as -1
| Pixel properties | Quadrant properties | ||||||
|---|---|---|---|---|---|---|---|
| Quadrant | DetID | PixID | Counts | Sigma | Mean | Median | Sigma |
| A | 0 | 29 | 4852 | 11.69 | 1282 | 1205 | 311.9 |
| A | 7 | 110 | 3955 | 8.82 | 1282 | 1205 | 311.9 |
| A | 0 | 30 | 3873 | 8.55 | 1282 | 1205 | 311.9 |
| B | 2 | 9 | 3927 | 11.07 | 1256 | 1196 | 246.7 |
| B | 2 | 8 | 3236 | 8.27 | 1256 | 1196 | 246.7 |
| B | 3 | 17 | 3176 | 8.02 | 1256 | 1196 | 246.7 |
| C | 1 | 80 | 3598 | 7.91 | 1231 | 1151 | 309.2 |
| C | 1 | 81 | 3590 | 7.89 | 1231 | 1151 | 309.2 |
| C | 12 | 241 | 3232 | 6.73 | 1231 | 1151 | 309.2 |
| D | 15 | 46 | 3012 | 6.2 | 1171 | 1063 | 314.1 |
| D | 7 | 3 | 2922 | 5.92 | 1171 | 1063 | 314.1 |
| D | 10 | 189 | 2859 | 5.72 | 1171 | 1063 | 314.1 |
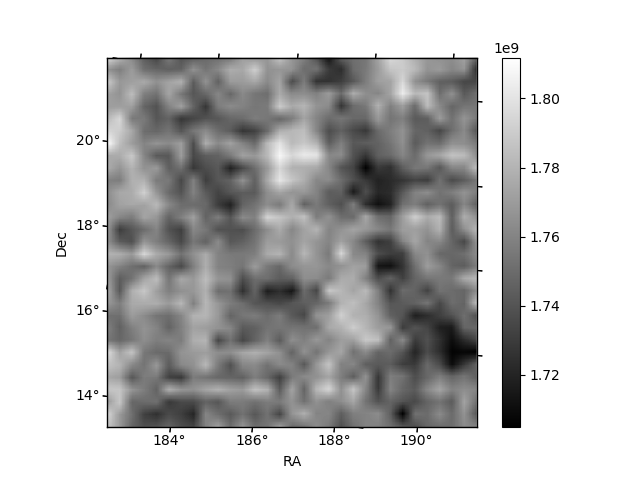
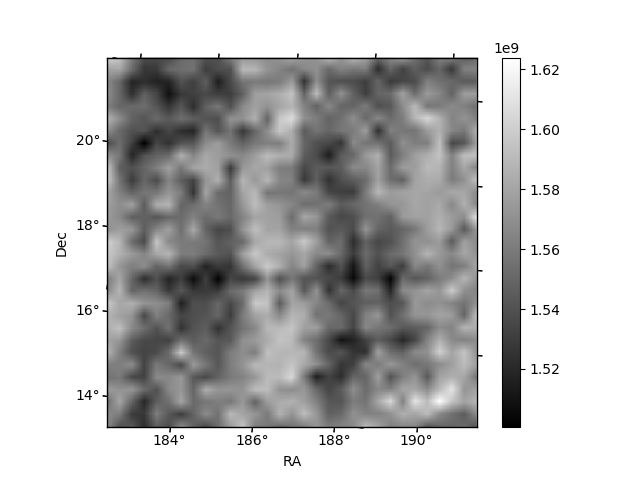
Histogram calculated using DETX and DETY for each event in the final _common_clean file
| Quadrant A | 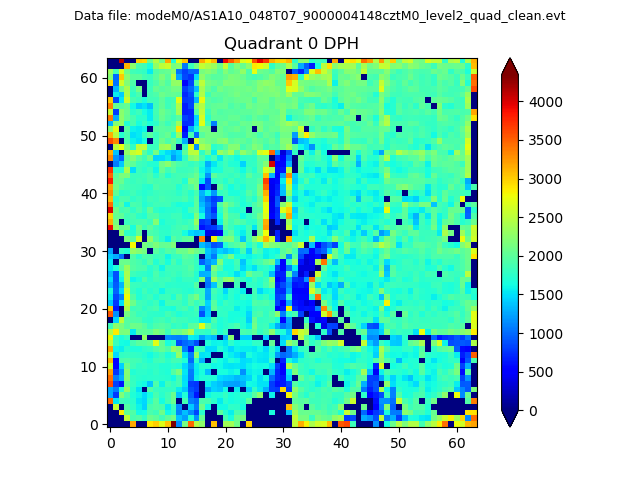 |
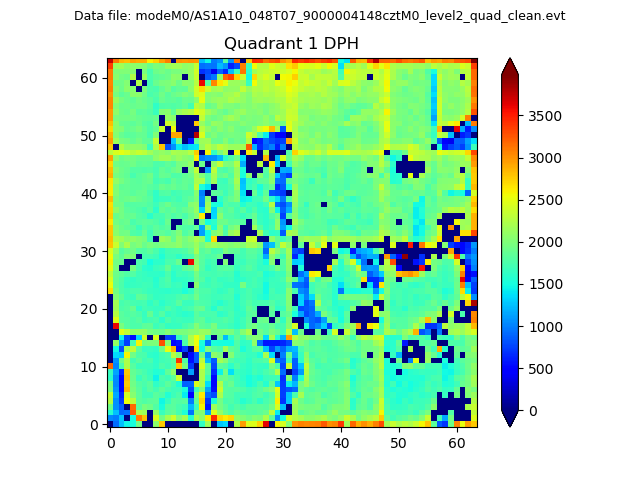 |
Quadrant B |
|---|---|---|---|
| Quadrant D | 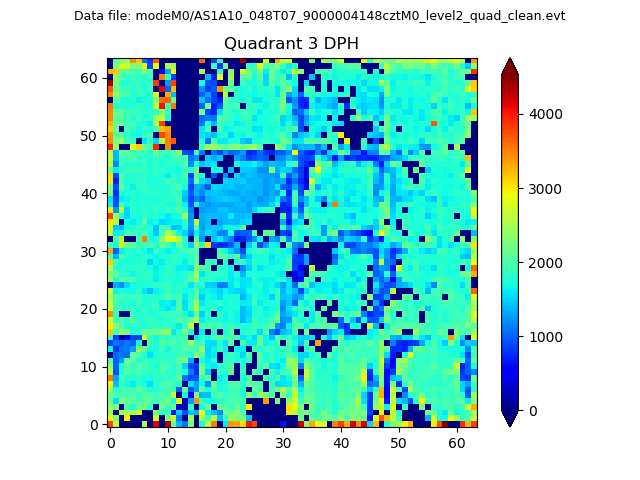 |
 |
Quadrant C |
| Plot type | Count rate plots | Images |
|---|---|---|
| Comparison with Poisson distribution Blue bars denote a histogram of data divided into 1 sec bins. Red curve is a Poisson curve with rate = median count rate of data. |
 |
 |
| Quadrant-wise count rates Data is divided into 100 sec bins |
 |
|
| Module-wise count rates for Quadrant A Data is divided into 100 sec bins |
 |
 |
| Module-wise count rates for Quadrant B Data is divided into 100 sec bins |
 |
 |
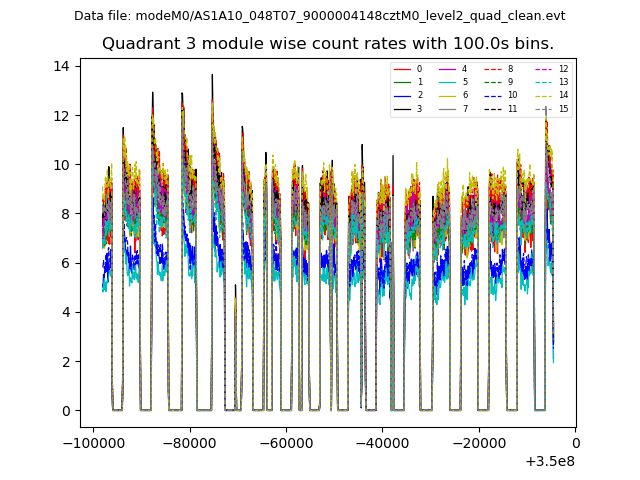
| Module-wise count rates for Quadrant C Data is divided into 100 sec bins |
 |
 |
| Module-wise count rates for Quadrant D Data is divided into 100 sec bins |
 |
 |
| Parameter | Plot |
|---|---|
| CZT HV Monitor | 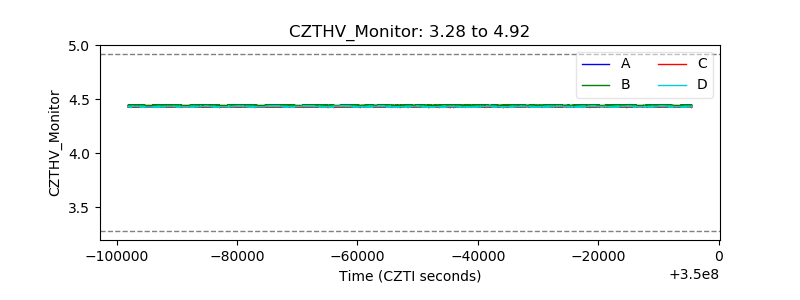 |
| D_VDD | 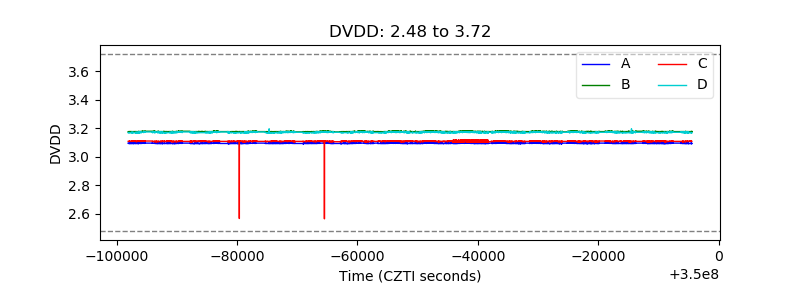 |
| Temperature 1 | 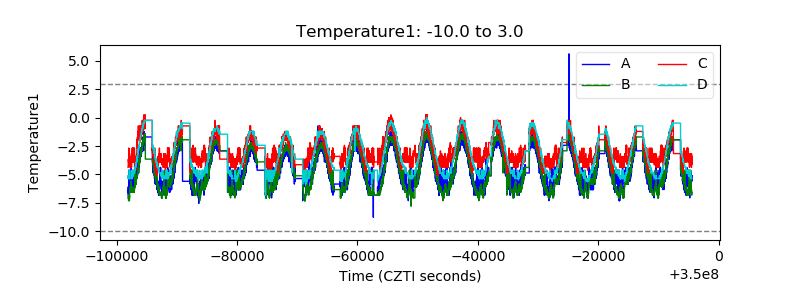 |
| Veto HV Monitor |  |
| Veto LLD | 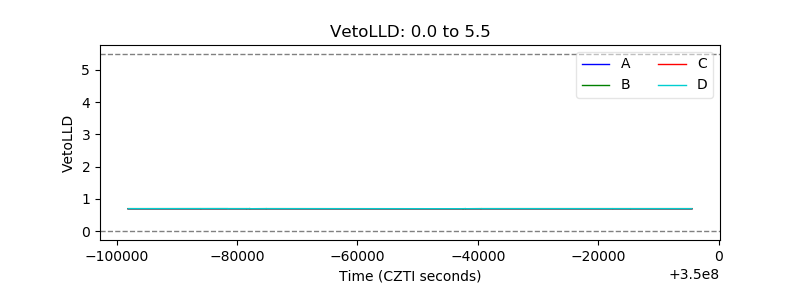 |
| Alpha Counter | 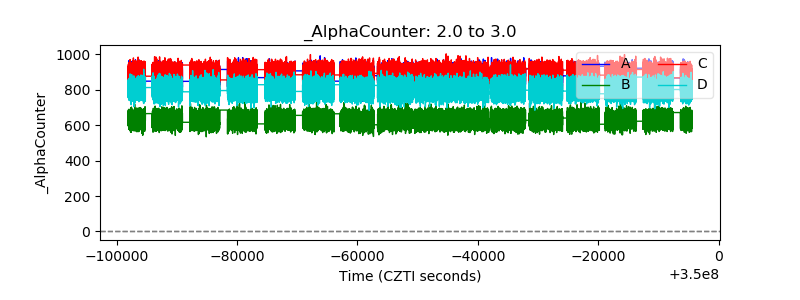 |
| _CPM_Rate |  |
| CZT Counter |  |
| +2.5 Volts monitor |  |
| +5 Volts monitor |  |
| _ROLL_ROT | 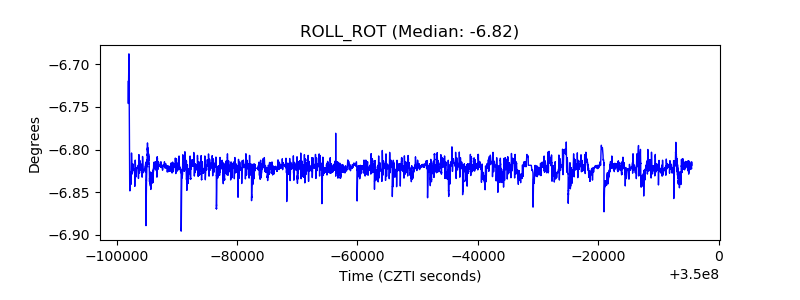 |
| _Roll_DEC |  |
| _Roll_RA |  |
| Veto Counter | 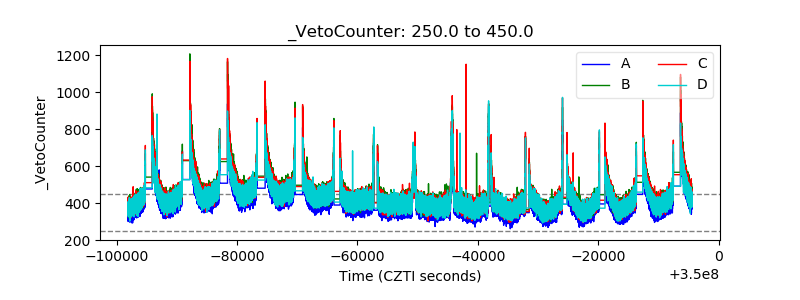 |