| Param | Original file | Final file |
|---|---|---|
| Filename | modeM0/AS1A10_048T07_9000004148_28918cztM0_level2.evt | modeM0/AS1A10_048T07_9000004148_28918cztM0_level2_quad_clean.evt |
| Size (bytes) | 349,047,360 | 63,892,800 |
| Size | 332.9 MB | 60.9 MB |
| Events in quadrant A | 2,059,471 | 414,514 |
| Events in quadrant B | 2,108,874 | 429,926 |
| Events in quadrant C | 2,731,037 | 405,646 |
| Events in quadrant D | 3,386,979 | 390,107 |
| Mode M0 | |||
|---|---|---|---|
| Quadrant | BADHDUFLAG | Total packets | Discarded packets |
| A | 0 | 8816 | 2 |
| B | 0 | 8971 | 1 |
| C | 0 | 10945 | 1 |
| D | 0 | 12952 | 1 |
| Mode M9 | |||
|---|---|---|---|
| Quadrant | BADHDUFLAG | Total packets | Discarded packets |
| A | 0 | 12 | 0 |
| B | 0 | 12 | 0 |
| C | 0 | 12 | 0 |
| D | 0 | 12 | 0 |
| Mode SS | |||
|---|---|---|---|
| Quadrant | BADHDUFLAG | Total packets | Discarded packets |
| A | 0 | 84 | 0 |
| B | 0 | 84 | 0 |
| C | 0 | 84 | 0 |
| D | 0 | 84 | 0 |
| Quadrant | Total seconds | Saturated seconds | Saturation percentage |
|---|---|---|---|
| A | 4185 | 19 | 0.454002% |
| B | 4185 | 31 | 0.740741% |
| C | 4185 | 151 | 3.608124% |
| D | 4185 | 85 | 2.031063% |
Noise dominated data is calculated using 1-second bins in cleaned event files. If a bin has >2000 counts, and if more than 50% of those come from <1% of pixels, then it is considered to be noise-dominated and hence unusable.
| Quadrant | # 1 sec bins | Bins with >0 counts | Bins with >2000 counts | High rate bins dominated by noise | Noise dominated (total time) | Noise dominated (detector-on time) | Marked lightcurve |
|---|---|---|---|---|---|---|---|
| A | 5330 | 4186 | 0 | 0 | 0.00% | 0.00% | 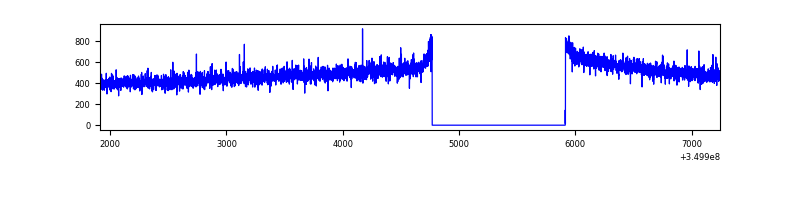 |
| B | 5330 | 4186 | 1 | 1 | 0.02% | 0.02% | 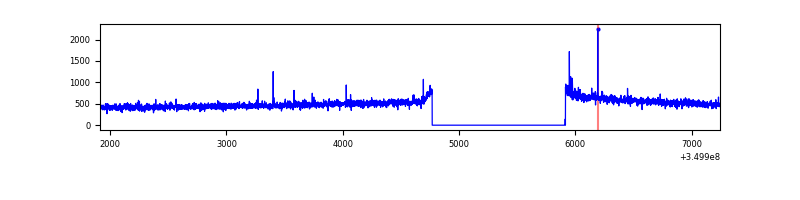 |
| C | 5330 | 4186 | 1 | 1 | 0.02% | 0.02% |  |
| D | 5330 | 4186 | 56 | 56 | 1.05% | 1.34% | 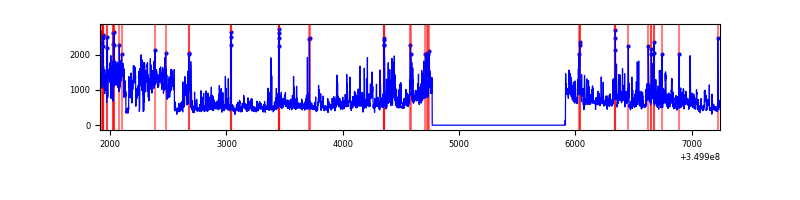 |
Top three noisy pixels from each quadrant. If the there are fewer than three noisy pixels in the level2.evt file, extra rows are filled as -1
| Pixel properties | Quadrant properties | ||||||
|---|---|---|---|---|---|---|---|
| Quadrant | DetID | PixID | Counts | Sigma | Mean | Median | Sigma |
| A | 13 | 254 | 7444 | 64.58 | 533 | 521 | 107.2 |
| A | 3 | 137 | 5092 | 42.64 | 533 | 521 | 107.2 |
| A | 0 | 226 | 4589 | 37.95 | 533 | 521 | 107.2 |
| B | 10 | 245 | 15781 | 148.93 | 532 | 517 | 102.5 |
| B | 12 | 111 | 12452 | 116.45 | 532 | 517 | 102.5 |
| B | 11 | 111 | 11452 | 106.69 | 532 | 517 | 102.5 |
| C | 3 | 233 | 605647 | 5037.17 | 510 | 513 | 120.1 |
| C | 14 | 238 | 87080 | 720.59 | 510 | 513 | 120.1 |
| C | 15 | 208 | 30035 | 245.74 | 510 | 513 | 120.1 |
| D | 8 | 195 | 1234829 | 10051.45 | 512 | 499 | 122.8 |
| D | 1 | 52 | 170190 | 1381.84 | 512 | 499 | 122.8 |
| D | 12 | 233 | 20369 | 161.81 | 512 | 499 | 122.8 |
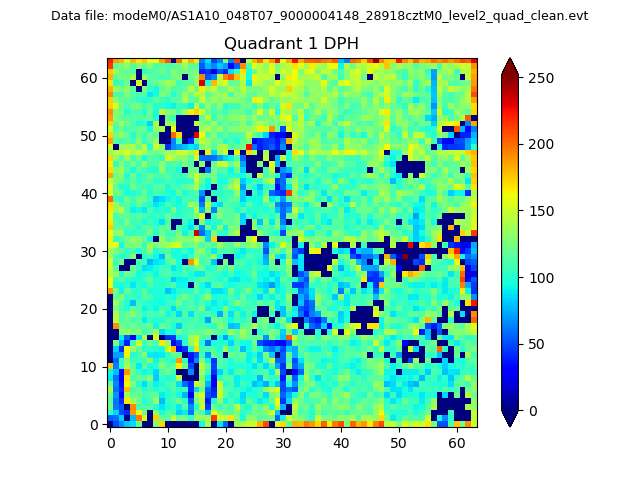
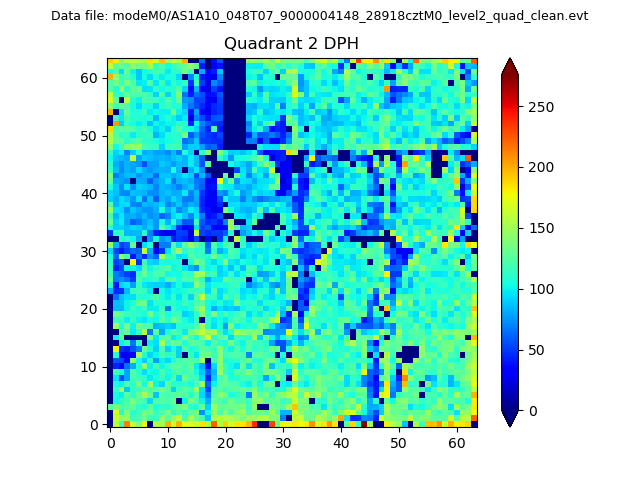
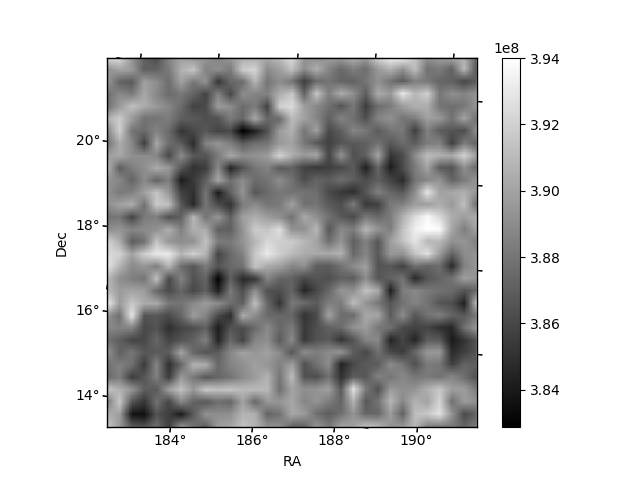
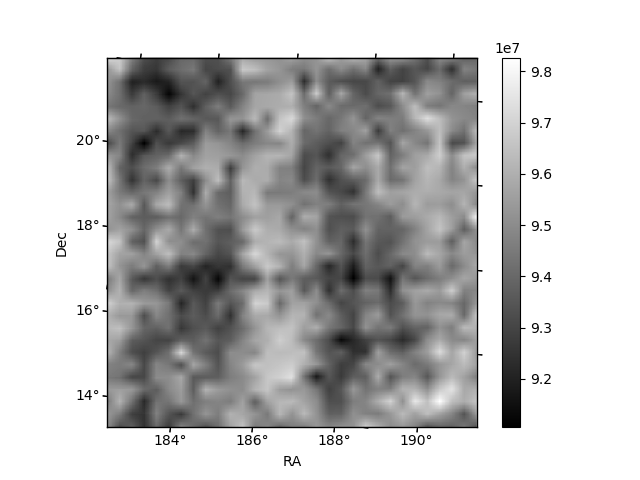
Histogram calculated using DETX and DETY for each event in the final _common_clean file
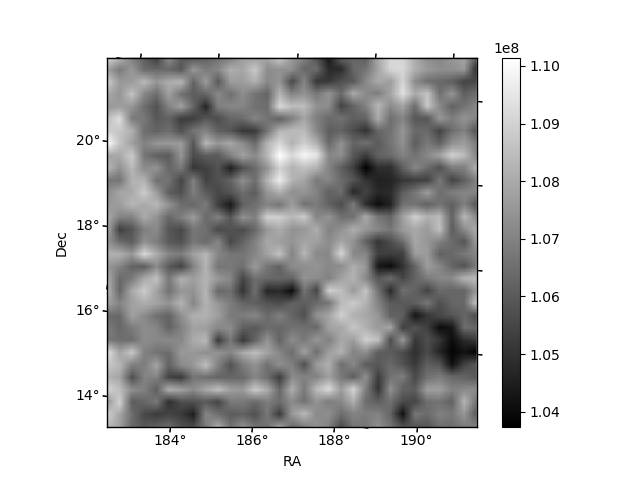
| Quadrant A | 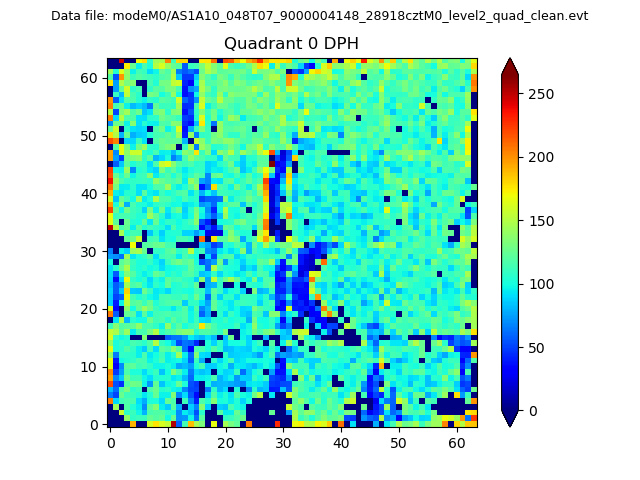 |
 |
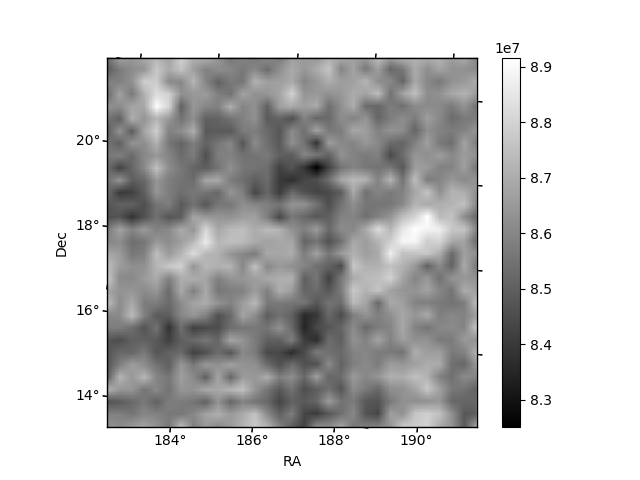
Quadrant B |
|---|---|---|---|
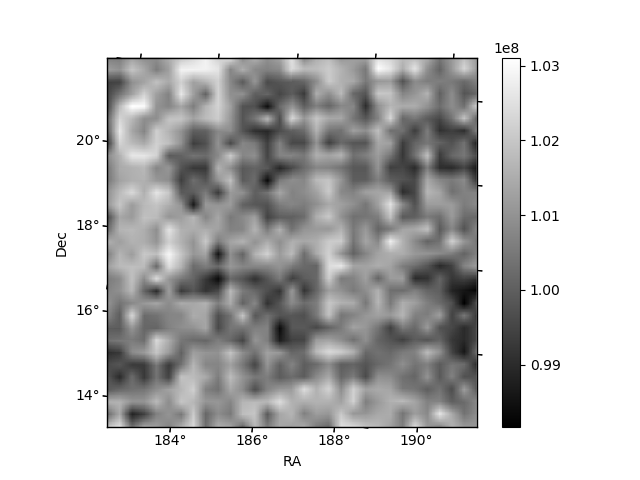
| Quadrant D | 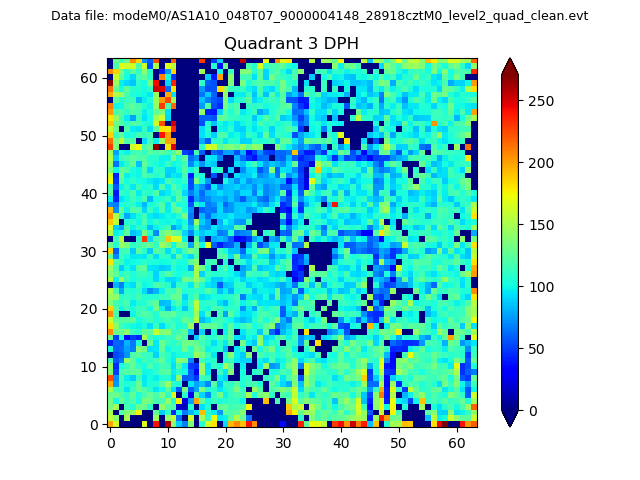 |
 |
Quadrant C |
| Plot type | Count rate plots | Images |
|---|---|---|
| Comparison with Poisson distribution Blue bars denote a histogram of data divided into 1 sec bins. Red curve is a Poisson curve with rate = median count rate of data. |
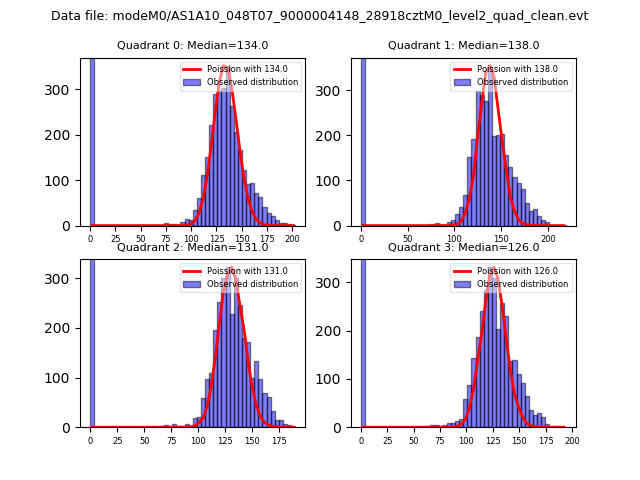 |
 |
| Quadrant-wise count rates Data is divided into 100 sec bins |
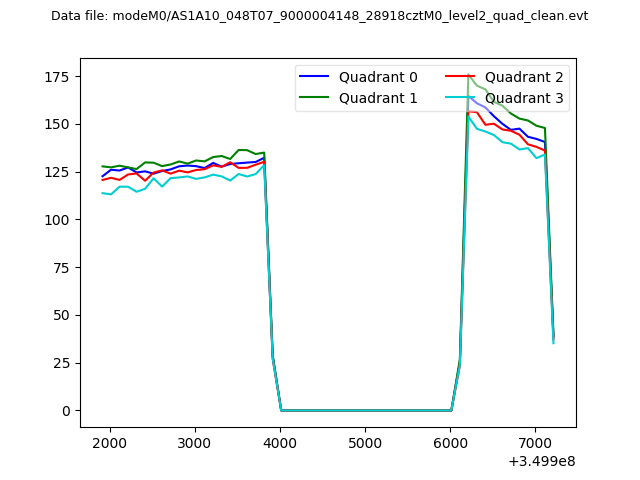 |
|
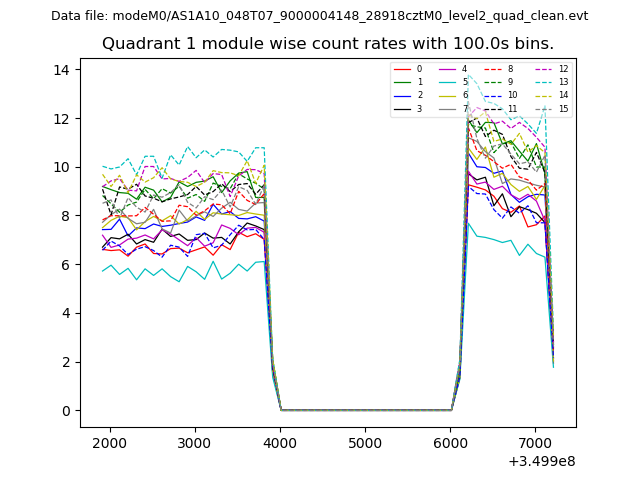
| Module-wise count rates for Quadrant A Data is divided into 100 sec bins |
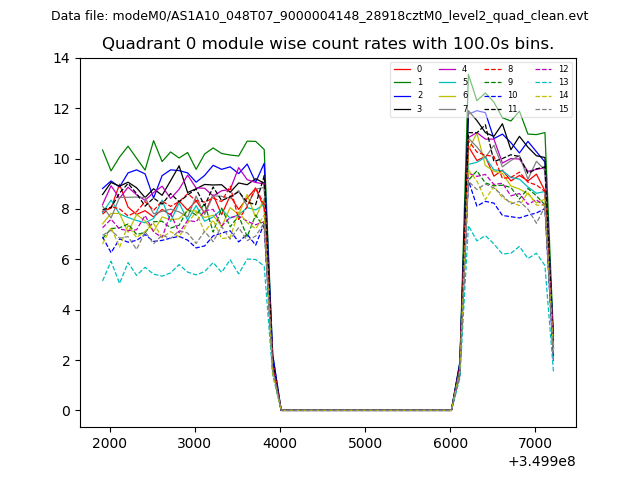 |
 |
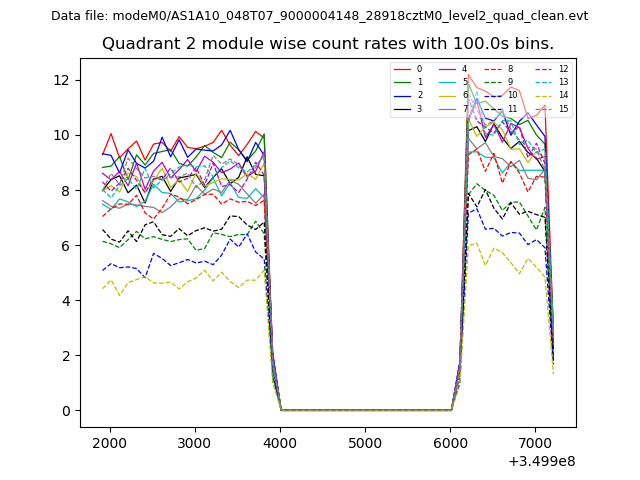
| Module-wise count rates for Quadrant B Data is divided into 100 sec bins |
 |
 |
| Module-wise count rates for Quadrant C Data is divided into 100 sec bins |
 |
 |
| Module-wise count rates for Quadrant D Data is divided into 100 sec bins |
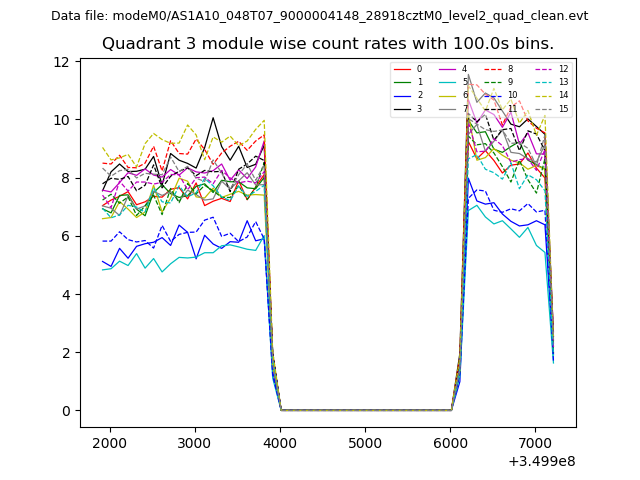 |
 |
| Parameter | Plot |
|---|---|
| CZT HV Monitor | 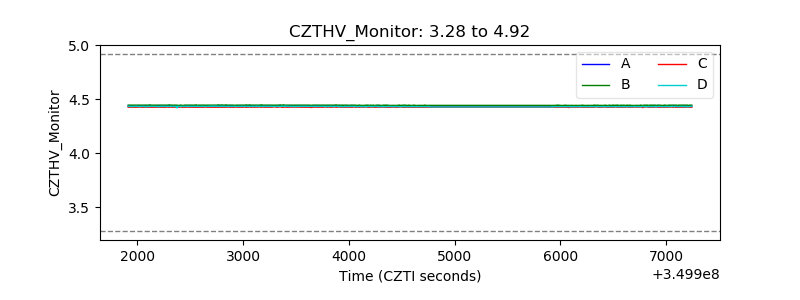 |
| D_VDD | 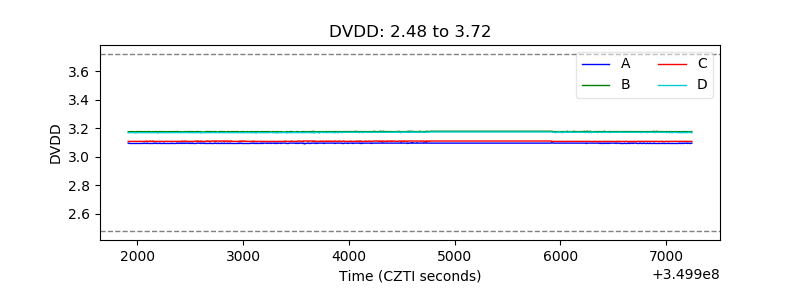 |
| Temperature 1 | 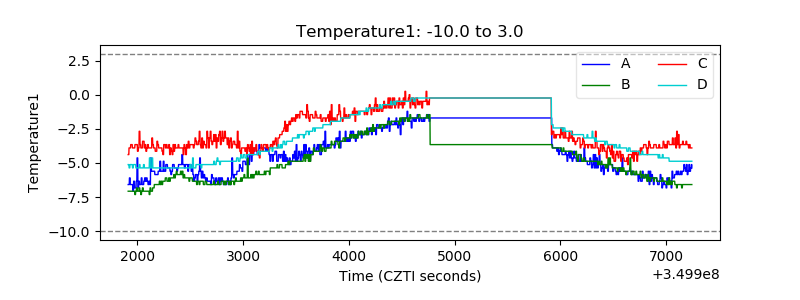 |
| Veto HV Monitor | 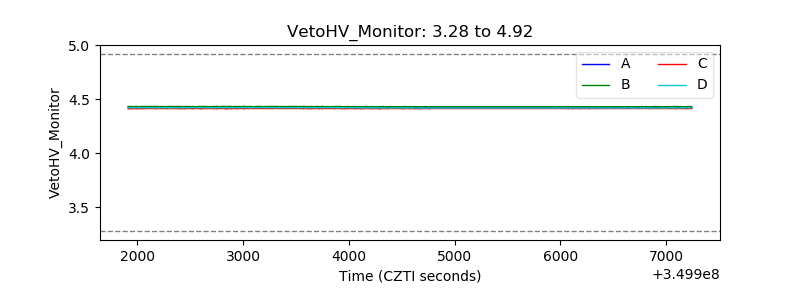 |
| Veto LLD | 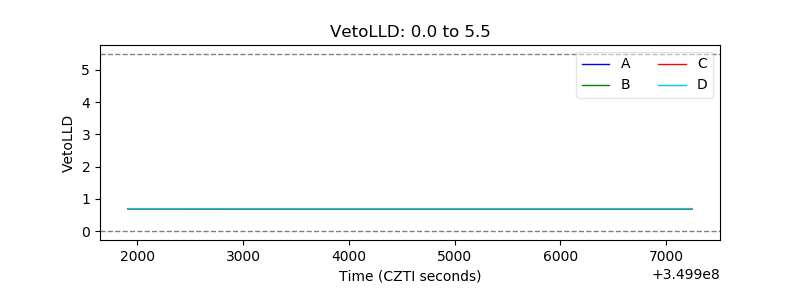 |
| Alpha Counter | 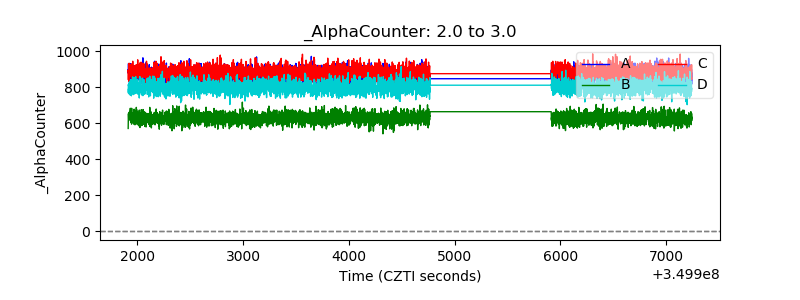 |
| _CPM_Rate | 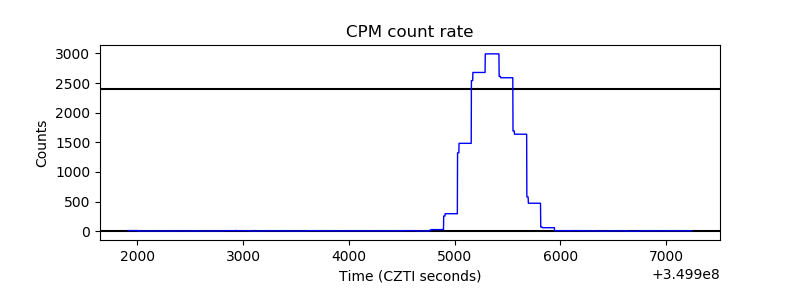 |
| CZT Counter | 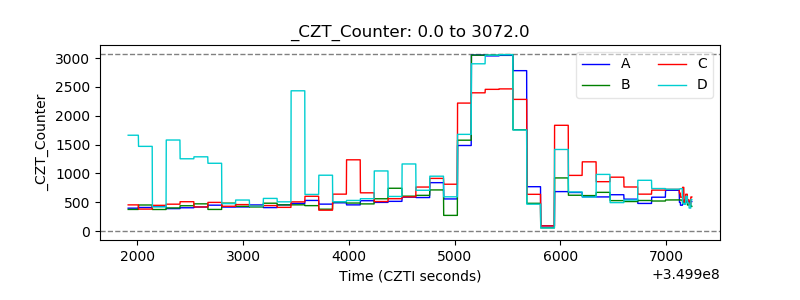 |
| +2.5 Volts monitor | 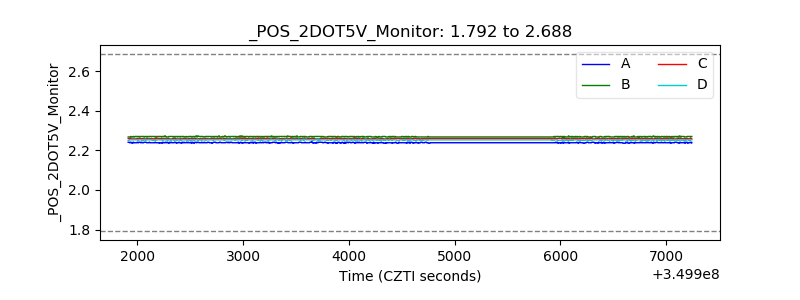 |
| +5 Volts monitor |  |
| _ROLL_ROT | 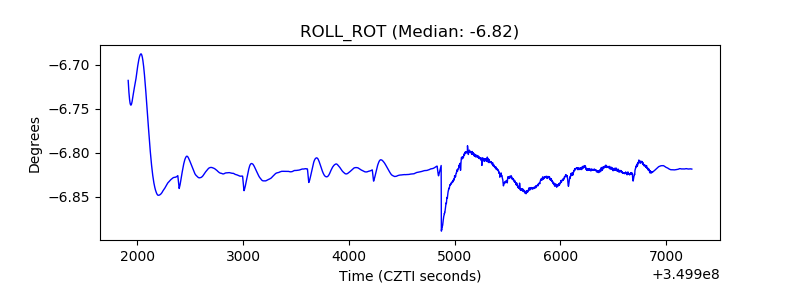 |
| _Roll_DEC | 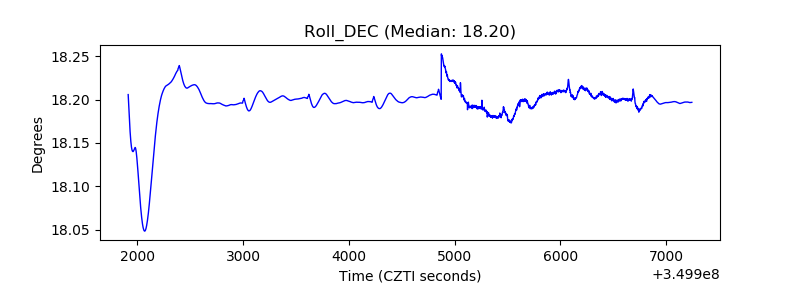 |
| _Roll_RA | 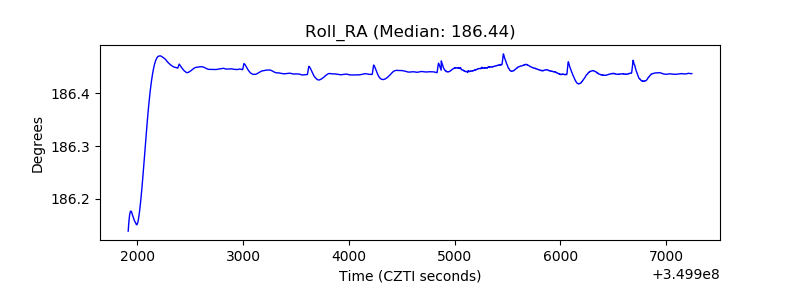 |
| Veto Counter | 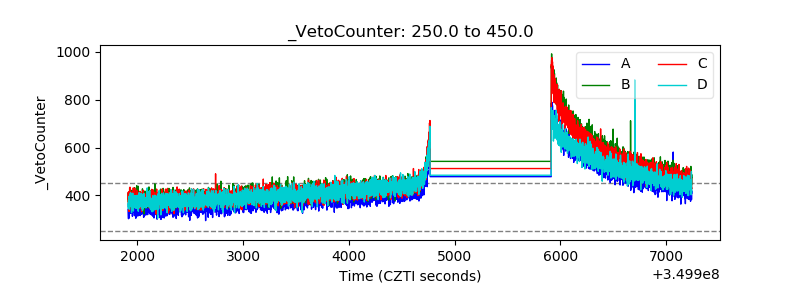 |