| Param | Original file | Final file |
|---|---|---|
| Filename | modeM0/AS1A10_048T07_9000004148_28921cztM0_level2.evt | modeM0/AS1A10_048T07_9000004148_28921cztM0_level2_quad_clean.evt |
| Size (bytes) | 913,921,920 | 187,715,520 |
| Size | 871.6 MB | 179.0 MB |
| Events in quadrant A | 5,974,501 | 1,236,294 |
| Events in quadrant B | 6,183,650 | 1,292,070 |
| Events in quadrant C | 6,594,069 | 1,197,433 |
| Events in quadrant D | 8,131,782 | 1,147,294 |
| Mode M0 | |||
|---|---|---|---|
| Quadrant | BADHDUFLAG | Total packets | Discarded packets |
| A | 0 | 24949 | 3 |
| B | 0 | 25528 | 3 |
| C | 0 | 26811 | 3 |
| D | 0 | 32070 | 3 |
| Mode M9 | |||
|---|---|---|---|
| Quadrant | BADHDUFLAG | Total packets | Discarded packets |
| A | 0 | 38 | 0 |
| B | 0 | 38 | 0 |
| C | 0 | 38 | 0 |
| D | 0 | 38 | 0 |
| Mode SS | |||
|---|---|---|---|
| Quadrant | BADHDUFLAG | Total packets | Discarded packets |
| A | 0 | 242 | 0 |
| B | 0 | 242 | 0 |
| C | 0 | 242 | 0 |
| D | 0 | 242 | 0 |
| Quadrant | Total seconds | Saturated seconds | Saturation percentage |
|---|---|---|---|
| A | 11747 | 87 | 0.740615% |
| B | 11746 | 148 | 1.260003% |
| C | 11746 | 301 | 2.562574% |
| D | 11747 | 343 | 2.919894% |
Noise dominated data is calculated using 1-second bins in cleaned event files. If a bin has >2000 counts, and if more than 50% of those come from <1% of pixels, then it is considered to be noise-dominated and hence unusable.
| Quadrant | # 1 sec bins | Bins with >0 counts | Bins with >2000 counts | High rate bins dominated by noise | Noise dominated (total time) | Noise dominated (detector-on time) | Marked lightcurve |
|---|---|---|---|---|---|---|---|
| A | 15632 | 11750 | 0 | 0 | 0.00% | 0.00% | 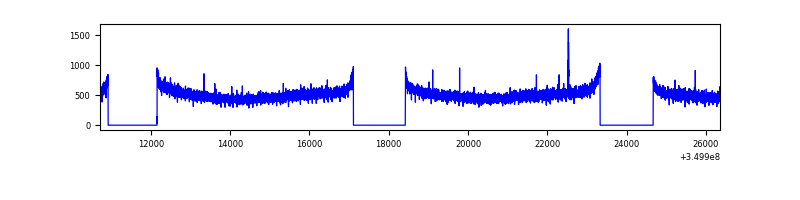 |
| B | 15631 | 11749 | 3 | 3 | 0.02% | 0.03% | 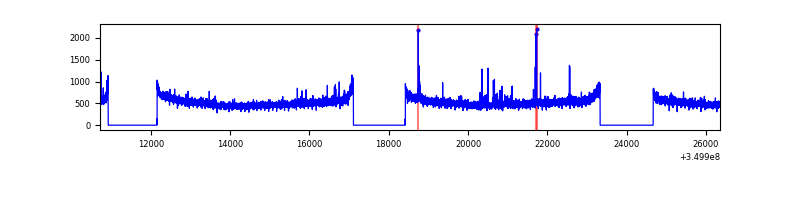 |
| C | 15631 | 11749 | 13 | 13 | 0.08% | 0.11% | 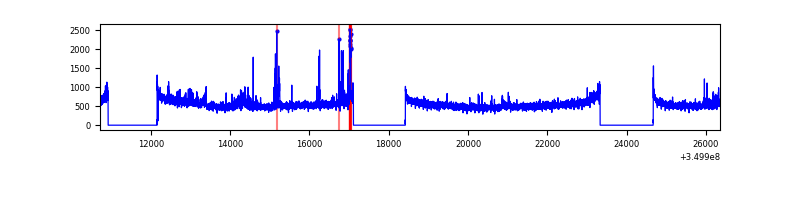 |
| D | 15632 | 11750 | 207 | 207 | 1.32% | 1.76% | 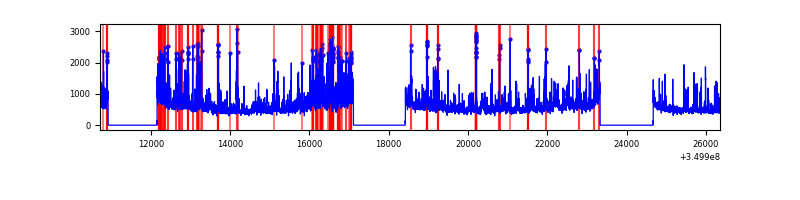 |
Top three noisy pixels from each quadrant. If the there are fewer than three noisy pixels in the level2.evt file, extra rows are filled as -1
| Pixel properties | Quadrant properties | ||||||
|---|---|---|---|---|---|---|---|
| Quadrant | DetID | PixID | Counts | Sigma | Mean | Median | Sigma |
| A | 13 | 254 | 21110 | 63.94 | 1546 | 1518 | 306.4 |
| A | 3 | 137 | 14304 | 41.73 | 1546 | 1518 | 306.4 |
| A | 0 | 226 | 13038 | 37.6 | 1546 | 1518 | 306.4 |
| B | 5 | 255 | 70520 | 238.33 | 1553 | 1516 | 289.5 |
| B | 12 | 111 | 34901 | 115.31 | 1553 | 1516 | 289.5 |
| B | 11 | 111 | 31445 | 103.37 | 1553 | 1516 | 289.5 |
| C | 3 | 233 | 350486 | 1019.16 | 1478 | 1491 | 342.4 |
| C | 14 | 238 | 270983 | 786.99 | 1478 | 1491 | 342.4 |
| C | 15 | 208 | 90706 | 260.53 | 1478 | 1491 | 342.4 |
| D | 8 | 195 | 1854533 | 5387.12 | 1464 | 1431 | 344.0 |
| D | 1 | 52 | 594299 | 1723.51 | 1464 | 1431 | 344.0 |
| D | 13 | 104 | 86596 | 247.58 | 1464 | 1431 | 344.0 |
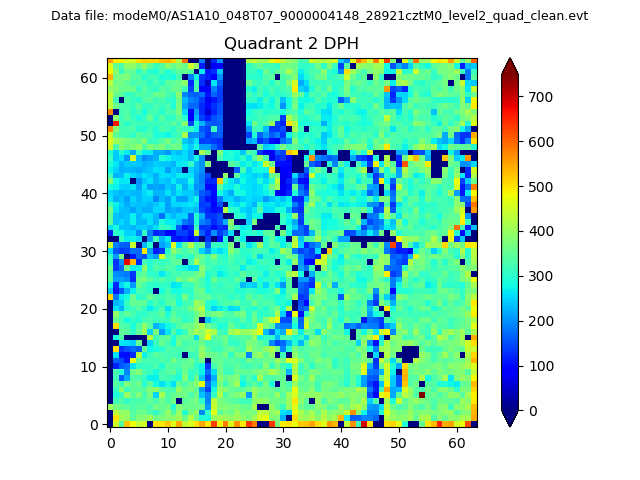
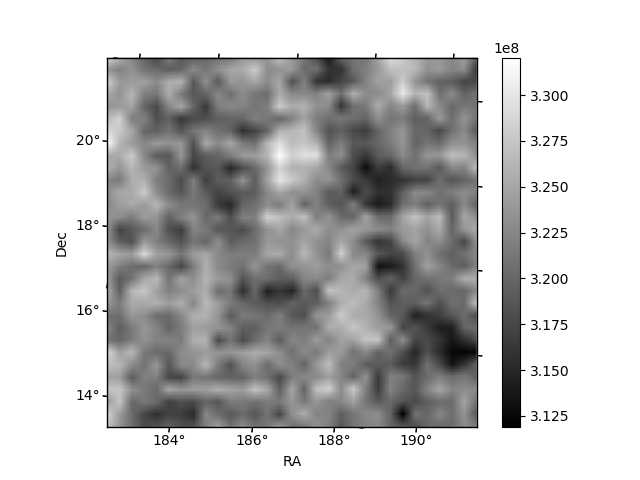
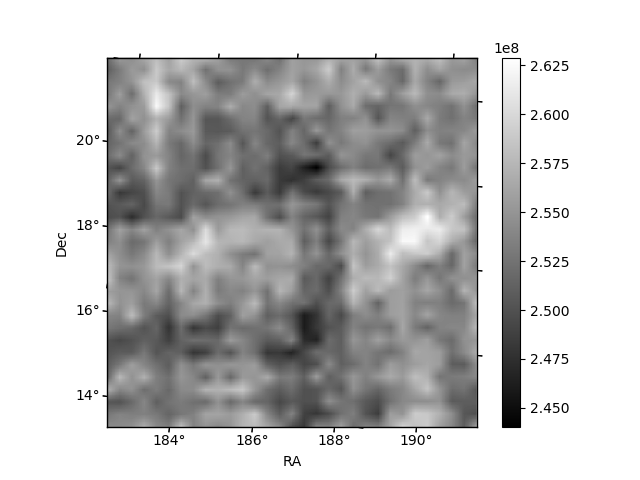
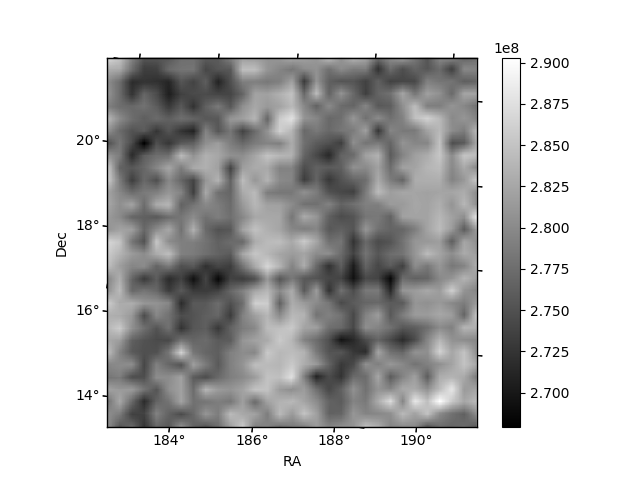
Histogram calculated using DETX and DETY for each event in the final _common_clean file
| Quadrant A | 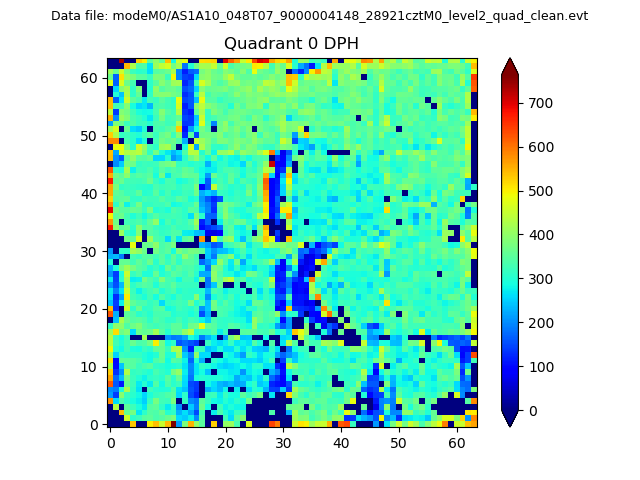 |
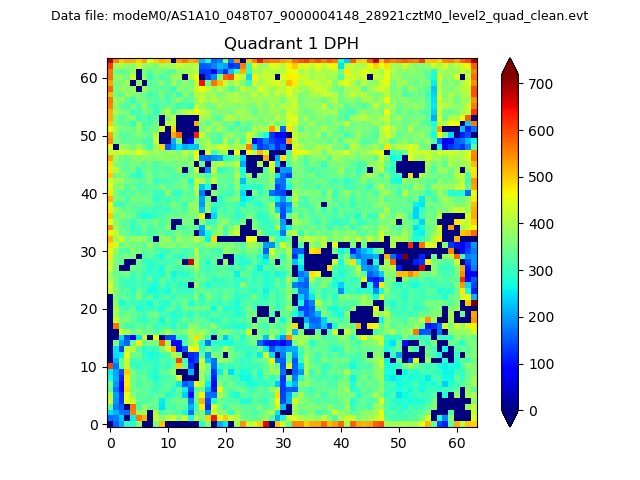 |
Quadrant B |
|---|---|---|---|
| Quadrant D | 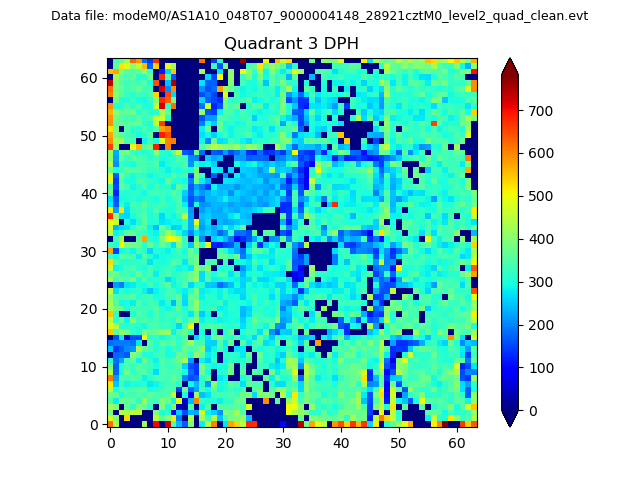 |
 |
Quadrant C |
| Plot type | Count rate plots | Images |
|---|---|---|
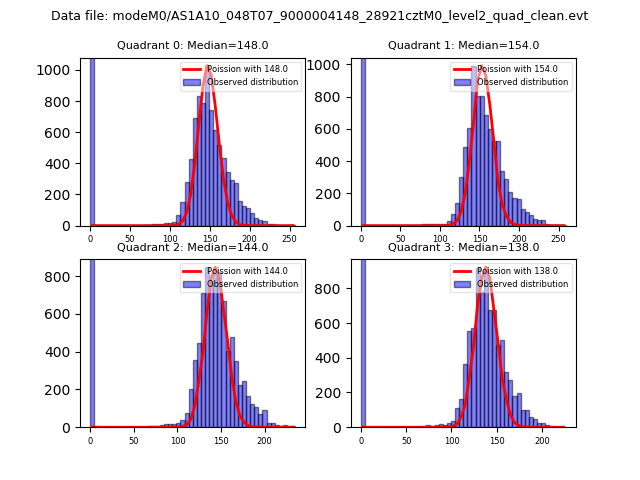
| Comparison with Poisson distribution Blue bars denote a histogram of data divided into 1 sec bins. Red curve is a Poisson curve with rate = median count rate of data. |
 |
 |
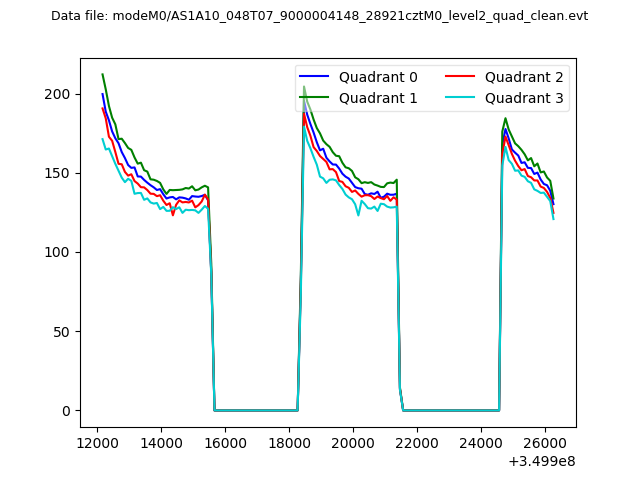
| Quadrant-wise count rates Data is divided into 100 sec bins |
 |
|
| Module-wise count rates for Quadrant A Data is divided into 100 sec bins |
 |
 |
| Module-wise count rates for Quadrant B Data is divided into 100 sec bins |
 |
 |
| Module-wise count rates for Quadrant C Data is divided into 100 sec bins |
 |
 |
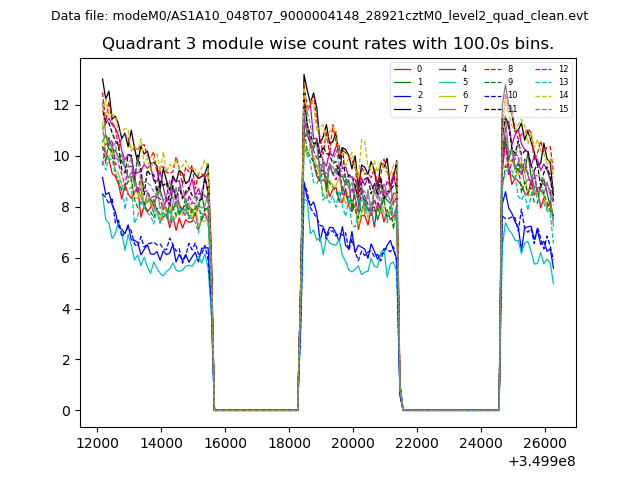
| Module-wise count rates for Quadrant D Data is divided into 100 sec bins |
 |
 |
| Parameter | Plot |
|---|---|
| CZT HV Monitor | 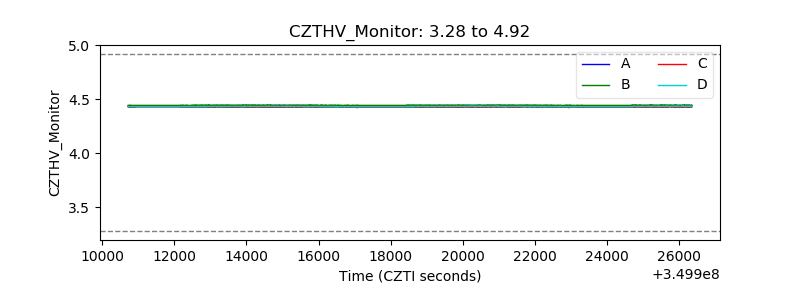 |
| D_VDD | 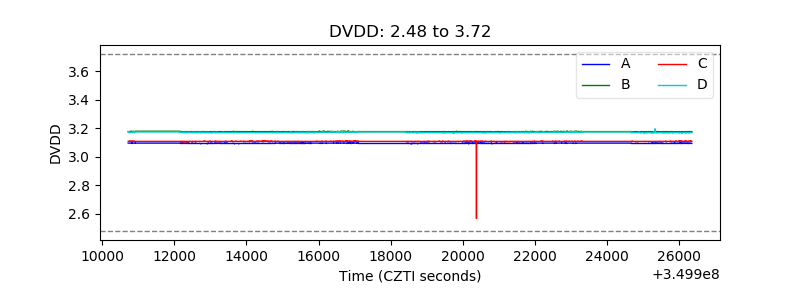 |
| Temperature 1 |  |
| Veto HV Monitor | 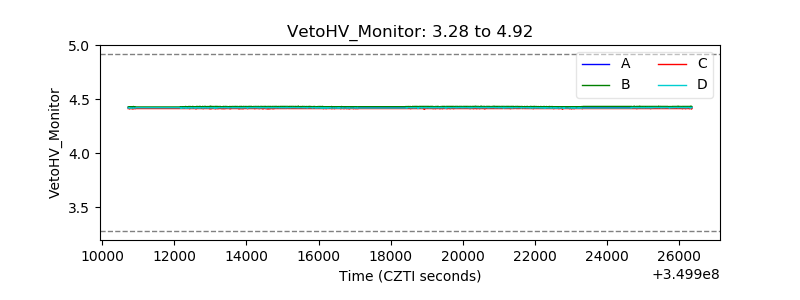 |
| Veto LLD |  |
| Alpha Counter | 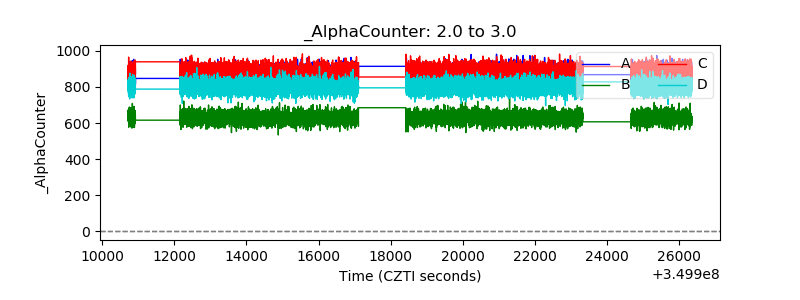 |
| _CPM_Rate | 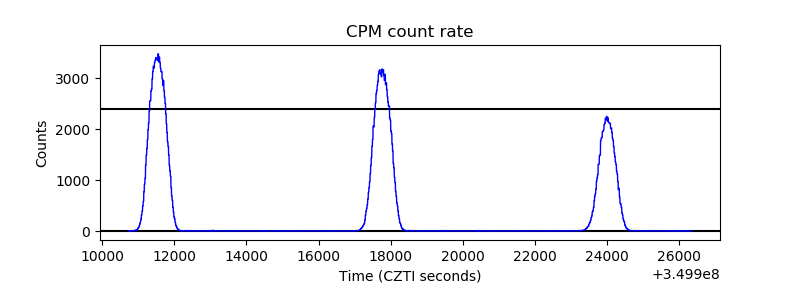 |
| CZT Counter | 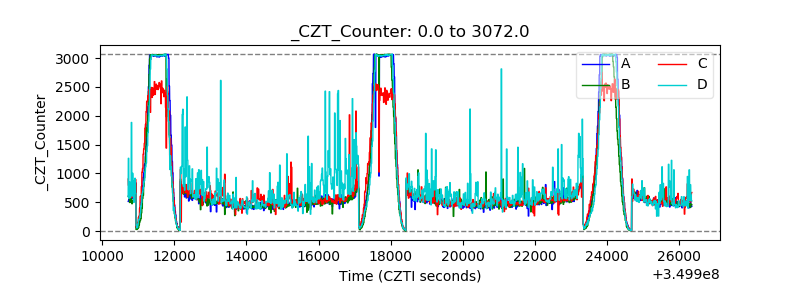 |
| +2.5 Volts monitor |  |
| +5 Volts monitor | 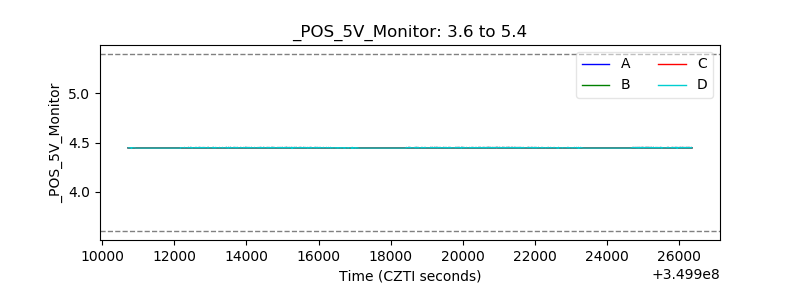 |
| _ROLL_ROT | 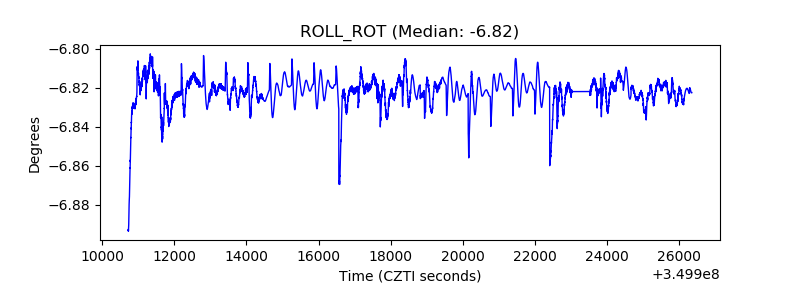 |
| _Roll_DEC | 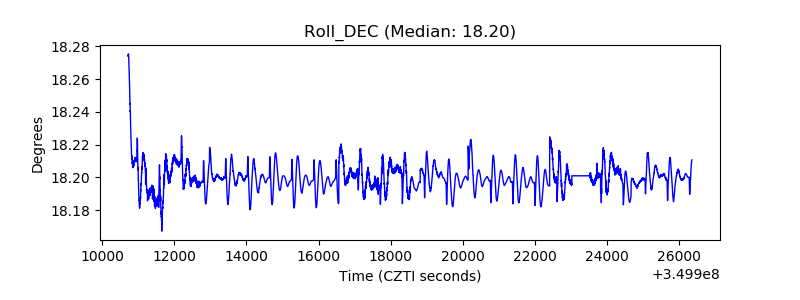 |
| _Roll_RA | 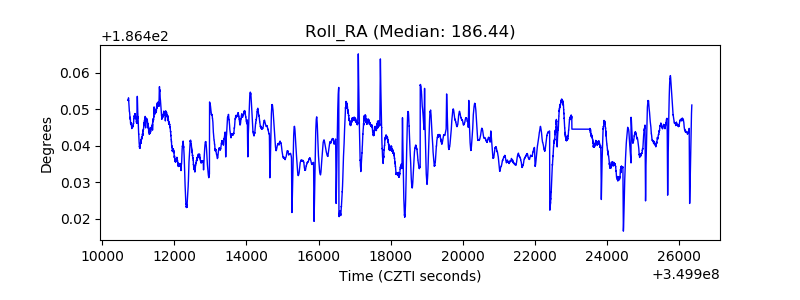 |
| Veto Counter | 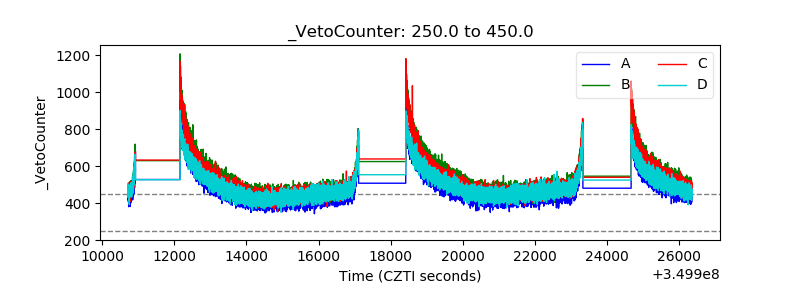 |