| Param | Original file | Final file |
|---|---|---|
| Filename | modeM0/AS1A10_048T07_9000004148_28923cztM0_level2.evt | modeM0/AS1A10_048T07_9000004148_28923cztM0_level2_quad_clean.evt |
| Size (bytes) | 612,717,120 | 97,410,240 |
| Size | 584.3 MB | 92.9 MB |
| Events in quadrant A | 3,329,649 | 630,893 |
| Events in quadrant B | 3,388,835 | 651,552 |
| Events in quadrant C | 4,549,000 | 608,835 |
| Events in quadrant D | 6,829,512 | 585,254 |
| Mode M0 | |||
|---|---|---|---|
| Quadrant | BADHDUFLAG | Total packets | Discarded packets |
| A | 0 | 14051 | 2 |
| B | 0 | 14205 | 2 |
| C | 0 | 18368 | 3 |
| D | 0 | 24930 | 2 |
| Mode M9 | |||
|---|---|---|---|
| Quadrant | BADHDUFLAG | Total packets | Discarded packets |
| A | 0 | 13 | 0 |
| B | 0 | 14 | 0 |
| C | 0 | 14 | 0 |
| D | 0 | 14 | 0 |
| Mode SS | |||
|---|---|---|---|
| Quadrant | BADHDUFLAG | Total packets | Discarded packets |
| A | 0 | 138 | 0 |
| B | 0 | 138 | 0 |
| C | 0 | 138 | 0 |
| D | 0 | 138 | 0 |
| Quadrant | Total seconds | Saturated seconds | Saturation percentage |
|---|---|---|---|
| A | 6791 | 54 | 0.795170% |
| B | 6791 | 64 | 0.942424% |
| C | 6790 | 180 | 2.650957% |
| D | 6790 | 381 | 5.611193% |
Noise dominated data is calculated using 1-second bins in cleaned event files. If a bin has >2000 counts, and if more than 50% of those come from <1% of pixels, then it is considered to be noise-dominated and hence unusable.
| Quadrant | # 1 sec bins | Bins with >0 counts | Bins with >2000 counts | High rate bins dominated by noise | Noise dominated (total time) | Noise dominated (detector-on time) | Marked lightcurve |
|---|---|---|---|---|---|---|---|
| A | 7831 | 6792 | 0 | 0 | 0.00% | 0.00% | 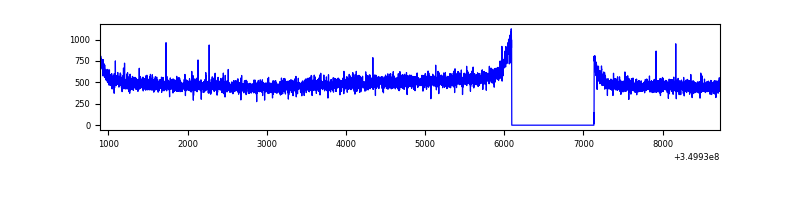 |
| B | 7831 | 6792 | 0 | 0 | 0.00% | 0.00% | 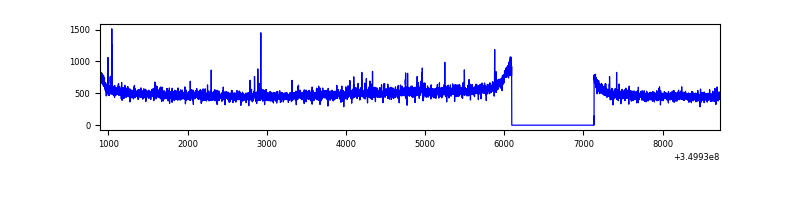 |
| C | 7830 | 6791 | 13 | 13 | 0.17% | 0.19% | 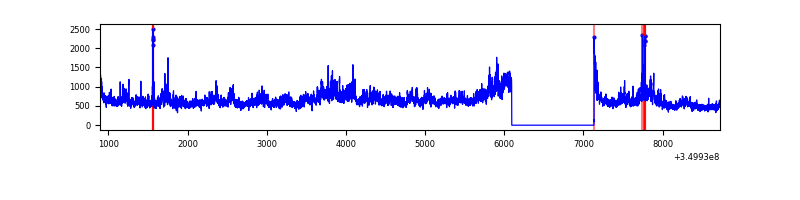 |
| D | 7830 | 6791 | 284 | 284 | 3.63% | 4.18% | 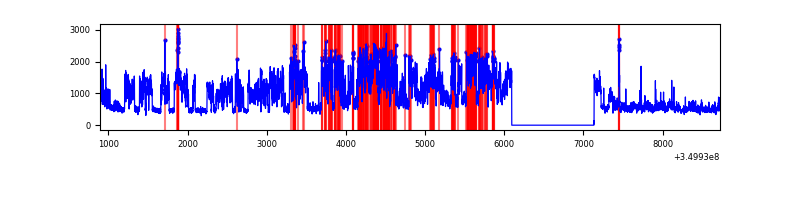 |
Top three noisy pixels from each quadrant. If the there are fewer than three noisy pixels in the level2.evt file, extra rows are filled as -1
| Pixel properties | Quadrant properties | ||||||
|---|---|---|---|---|---|---|---|
| Quadrant | DetID | PixID | Counts | Sigma | Mean | Median | Sigma |
| A | 13 | 254 | 11565 | 61.29 | 862 | 844 | 174.9 |
| A | 3 | 137 | 8349 | 42.91 | 862 | 844 | 174.9 |
| A | 0 | 226 | 7239 | 36.56 | 862 | 844 | 174.9 |
| B | 12 | 111 | 20110 | 117.7 | 854 | 833 | 163.8 |
| B | 11 | 111 | 18251 | 106.35 | 854 | 833 | 163.8 |
| B | 14 | 111 | 16821 | 97.62 | 854 | 833 | 163.8 |
| C | 3 | 233 | 1139910 | 5944.35 | 819 | 825 | 191.6 |
| C | 14 | 238 | 133639 | 693.09 | 819 | 825 | 191.6 |
| C | 15 | 208 | 43364 | 221.99 | 819 | 825 | 191.6 |
| D | 8 | 195 | 3350725 | 17297.75 | 817 | 794 | 193.7 |
| D | 1 | 52 | 359235 | 1850.85 | 817 | 794 | 193.7 |
| D | 2 | 234 | 23721 | 118.38 | 817 | 794 | 193.7 |
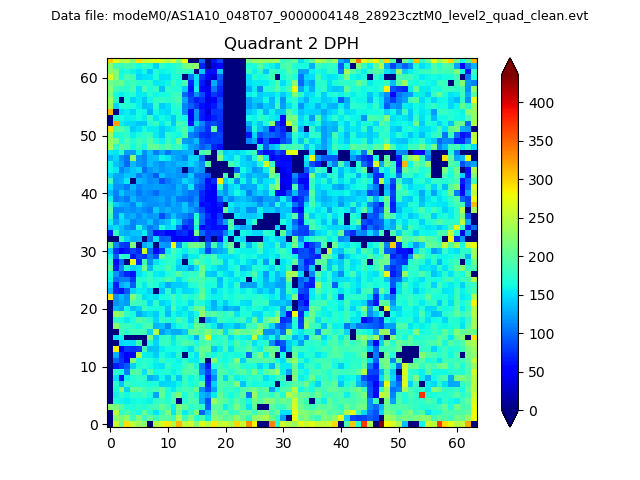
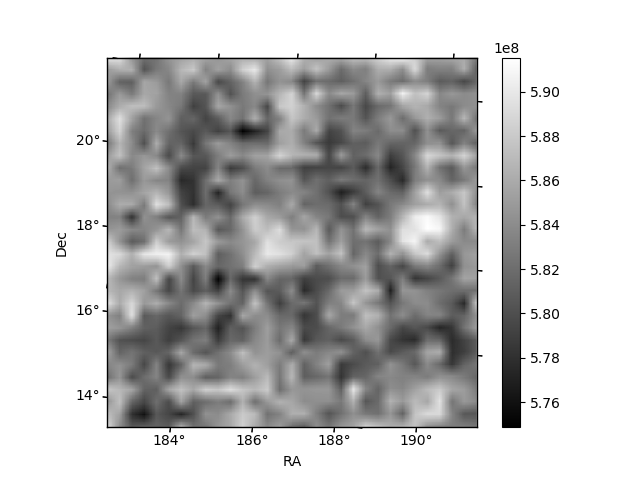
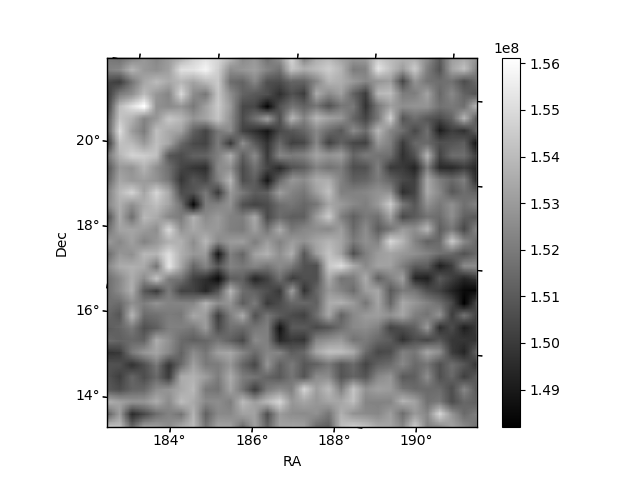
Histogram calculated using DETX and DETY for each event in the final _common_clean file
| Quadrant A | 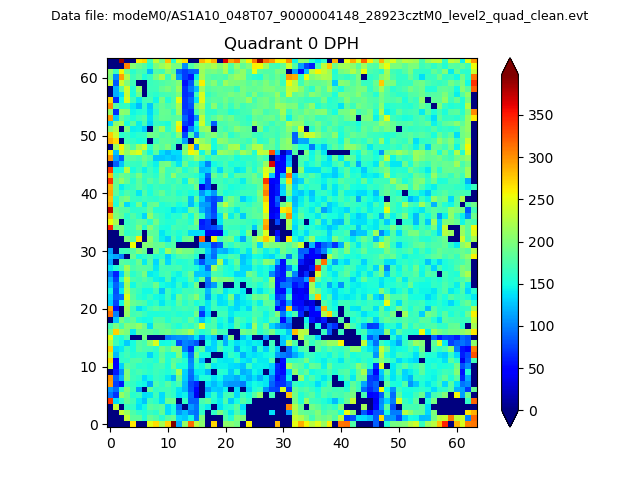 |
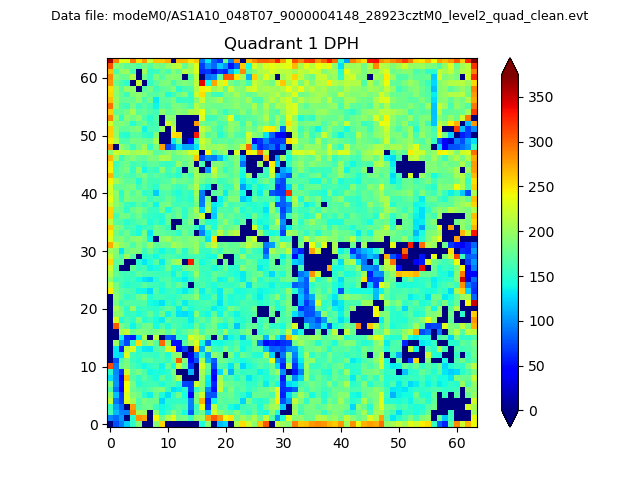 |
Quadrant B |
|---|---|---|---|
| Quadrant D | 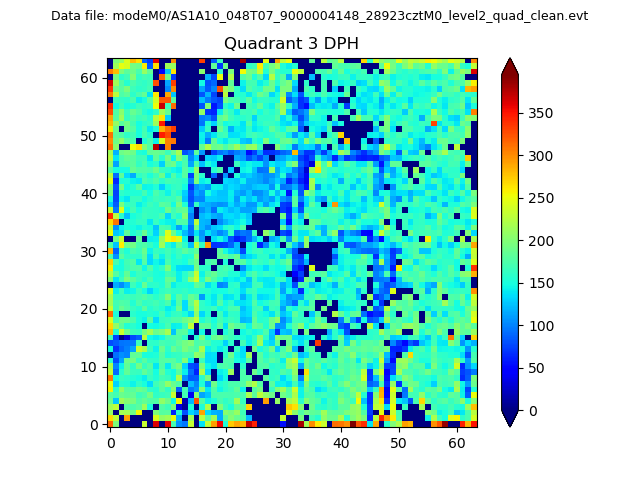 |
 |
Quadrant C |
| Plot type | Count rate plots | Images |
|---|---|---|
| Comparison with Poisson distribution Blue bars denote a histogram of data divided into 1 sec bins. Red curve is a Poisson curve with rate = median count rate of data. |
 |
 |
| Quadrant-wise count rates Data is divided into 100 sec bins |
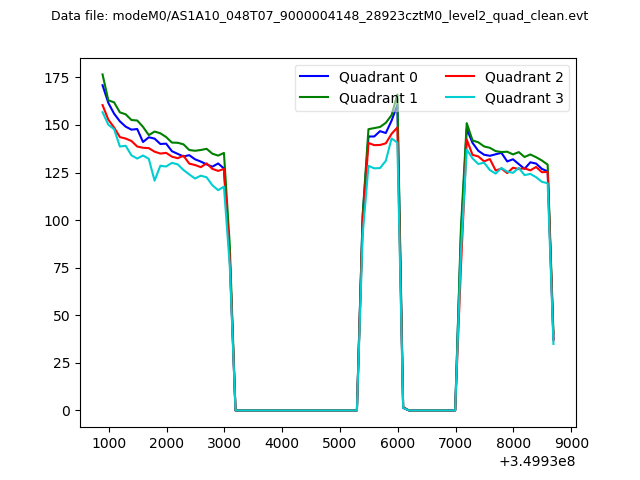 |
|
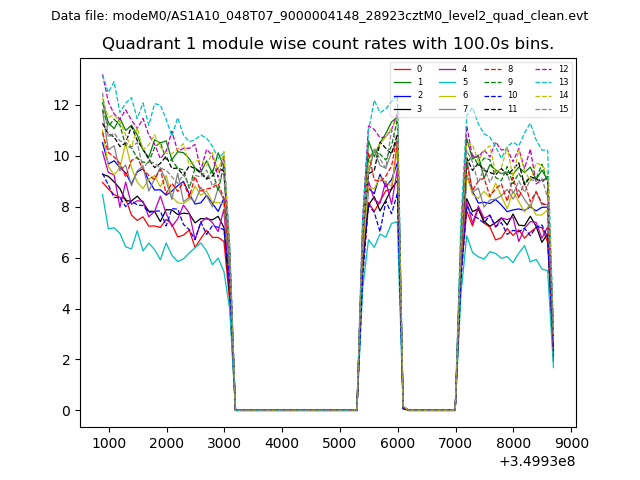
| Module-wise count rates for Quadrant A Data is divided into 100 sec bins |
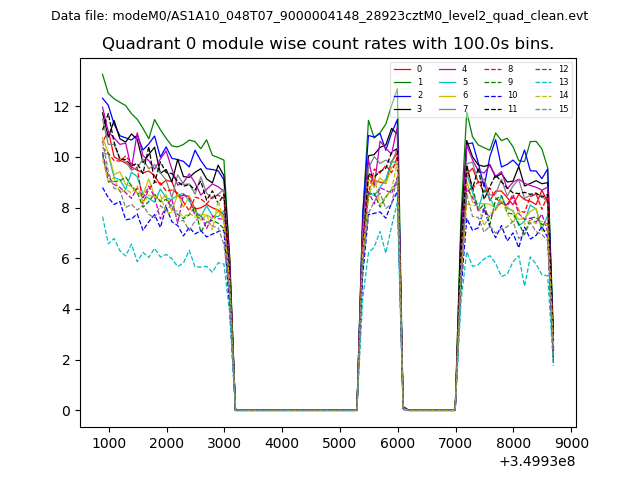 |
 |
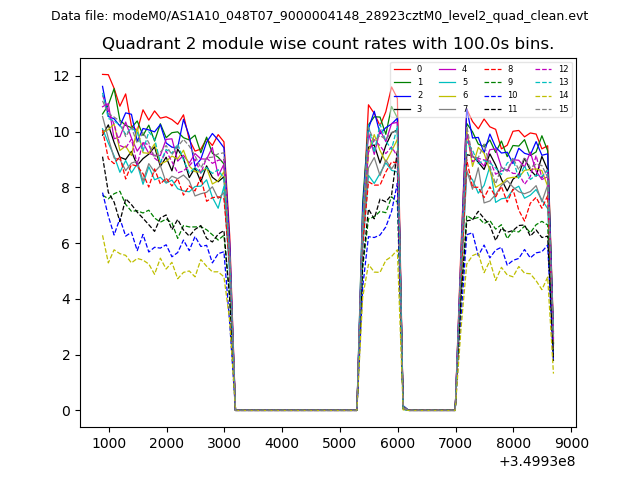
| Module-wise count rates for Quadrant B Data is divided into 100 sec bins |
 |
 |
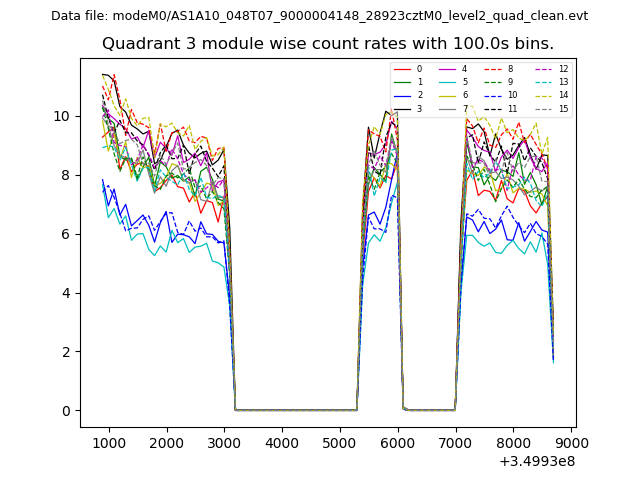
| Module-wise count rates for Quadrant C Data is divided into 100 sec bins |
 |
 |
| Module-wise count rates for Quadrant D Data is divided into 100 sec bins |
 |
 |
| Parameter | Plot |
|---|---|
| CZT HV Monitor | 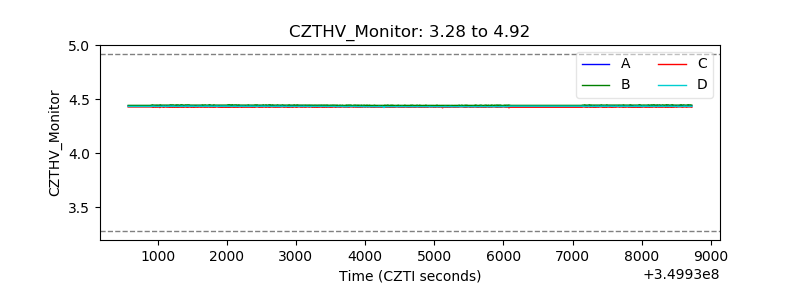 |
| D_VDD | 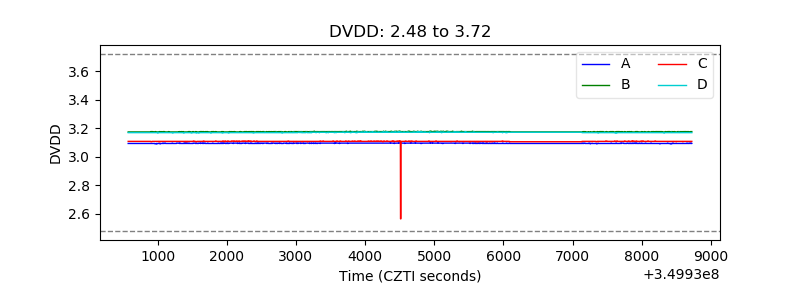 |
| Temperature 1 | 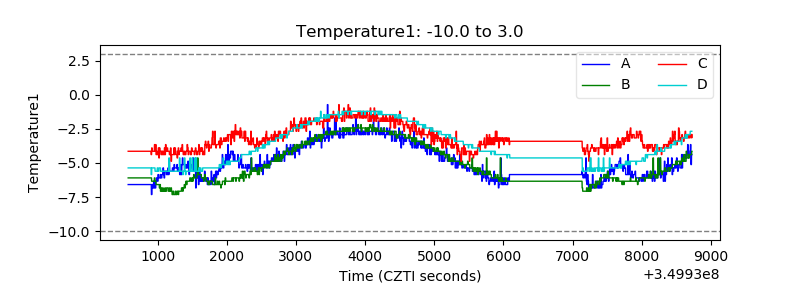 |
| Veto HV Monitor | 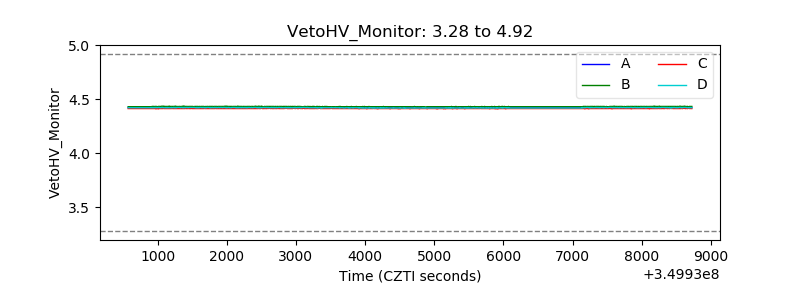 |
| Veto LLD | 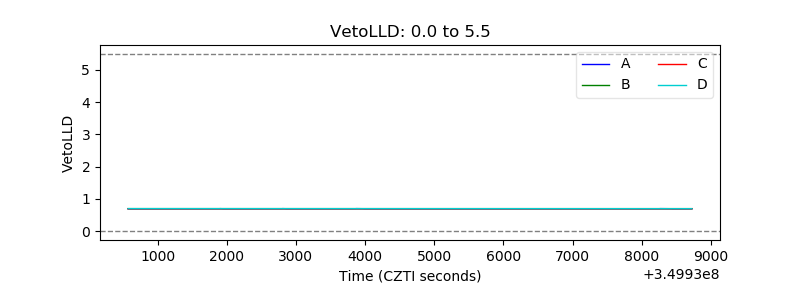 |
| Alpha Counter | 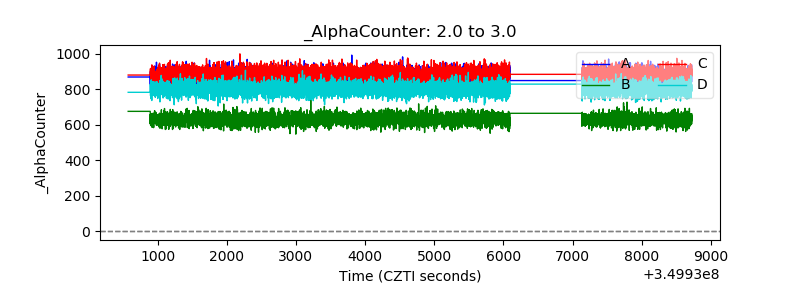 |
| _CPM_Rate | 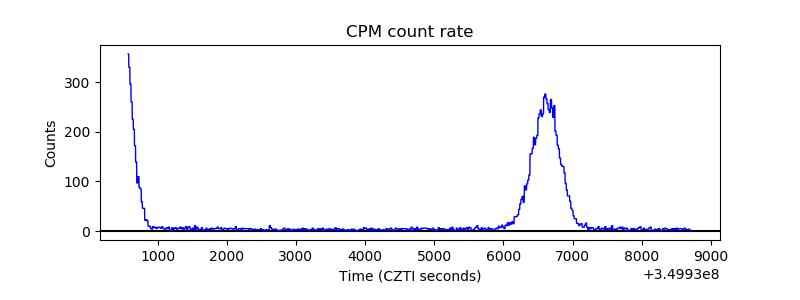 |
| CZT Counter | 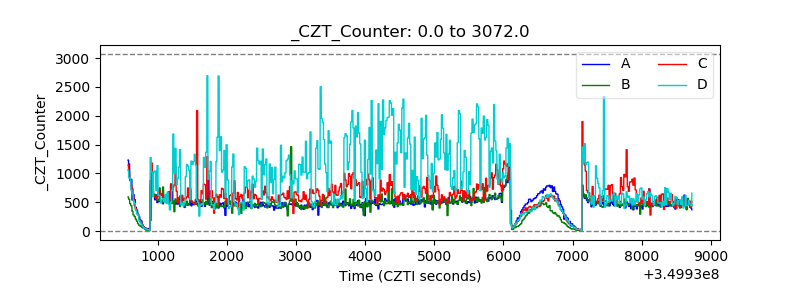 |
| +2.5 Volts monitor |  |
| +5 Volts monitor |  |
| _ROLL_ROT | 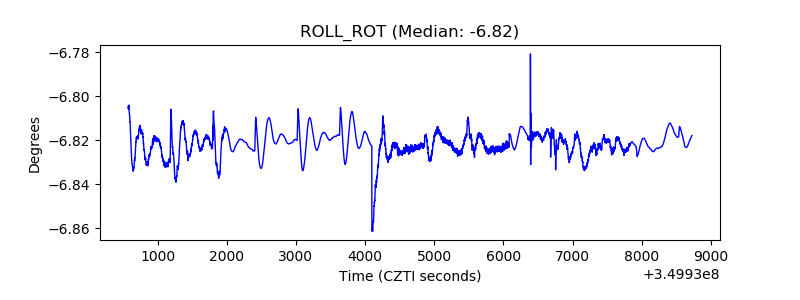 |
| _Roll_DEC | 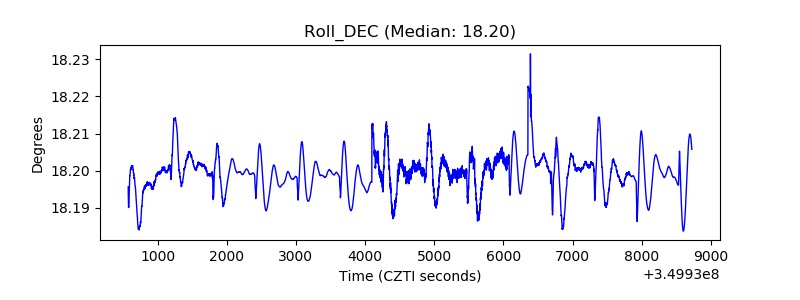 |
| _Roll_RA | 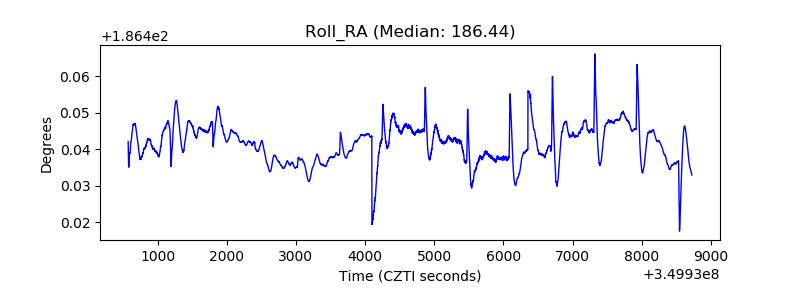 |
| Veto Counter | 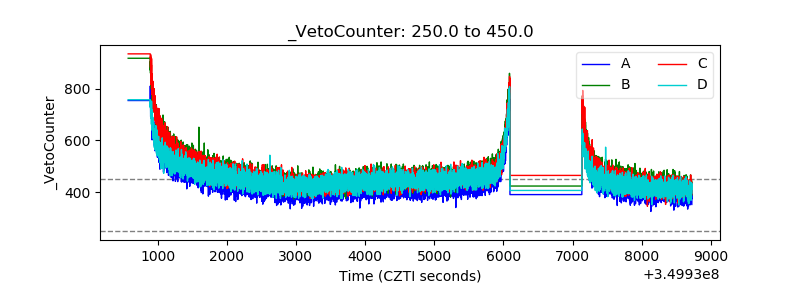 |