| Param | Original file | Final file |
|---|---|---|
| Filename | modeM0/AS1A10_048T07_9000004148_28924cztM0_level2.evt | modeM0/AS1A10_048T07_9000004148_28924cztM0_level2_quad_clean.evt |
| Size (bytes) | 542,724,480 | 83,594,880 |
| Size | 517.6 MB | 79.7 MB |
| Events in quadrant A | 3,275,104 | 530,304 |
| Events in quadrant B | 3,088,568 | 548,150 |
| Events in quadrant C | 4,522,592 | 510,166 |
| Events in quadrant D | 5,120,998 | 500,517 |
| Mode M0 | |||
|---|---|---|---|
| Quadrant | BADHDUFLAG | Total packets | Discarded packets |
| A | 0 | 13706 | 1 |
| B | 0 | 13051 | 1 |
| C | 0 | 17751 | 1 |
| D | 0 | 19700 | 1 |
| Mode M9 | |||
|---|---|---|---|
| Quadrant | BADHDUFLAG | Total packets | Discarded packets |
| A | 0 | 6 | 0 |
| B | 0 | 6 | 0 |
| C | 0 | 6 | 0 |
| D | 0 | 6 | 0 |
| Mode SS | |||
|---|---|---|---|
| Quadrant | BADHDUFLAG | Total packets | Discarded packets |
| A | 0 | 130 | 0 |
| B | 0 | 130 | 0 |
| C | 0 | 130 | 0 |
| D | 0 | 130 | 0 |
| Quadrant | Total seconds | Saturated seconds | Saturation percentage |
|---|---|---|---|
| A | 6333 | 86 | 1.357966% |
| B | 6332 | 95 | 1.500316% |
| C | 6332 | 226 | 3.569172% |
| D | 6332 | 130 | 2.053064% |
Noise dominated data is calculated using 1-second bins in cleaned event files. If a bin has >2000 counts, and if more than 50% of those come from <1% of pixels, then it is considered to be noise-dominated and hence unusable.
| Quadrant | # 1 sec bins | Bins with >0 counts | Bins with >2000 counts | High rate bins dominated by noise | Noise dominated (total time) | Noise dominated (detector-on time) | Marked lightcurve |
|---|---|---|---|---|---|---|---|
| A | 6953 | 6334 | 0 | 0 | 0.00% | 0.00% | 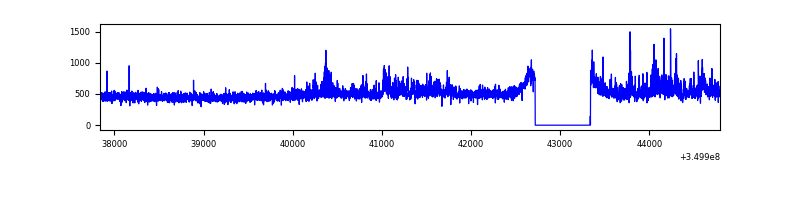 |
| B | 6952 | 6333 | 1 | 1 | 0.01% | 0.02% |  |
| C | 6952 | 6333 | 4 | 4 | 0.06% | 0.06% | 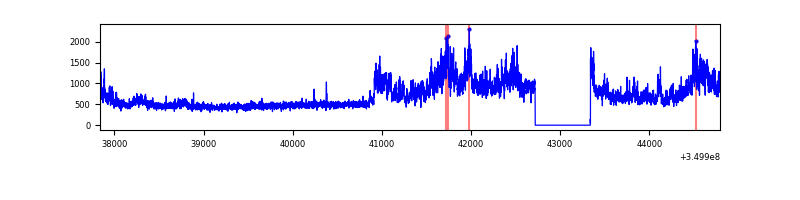 |
| D | 6952 | 6333 | 34 | 34 | 0.49% | 0.54% | 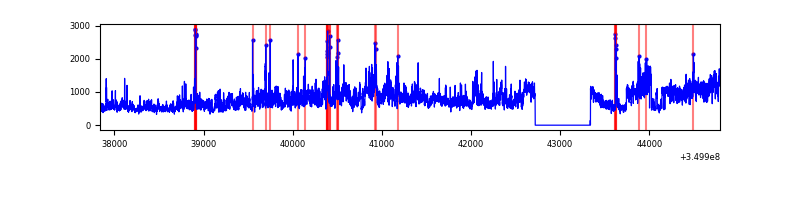 |
Top three noisy pixels from each quadrant. If the there are fewer than three noisy pixels in the level2.evt file, extra rows are filled as -1
| Pixel properties | Quadrant properties | ||||||
|---|---|---|---|---|---|---|---|
| Quadrant | DetID | PixID | Counts | Sigma | Mean | Median | Sigma |
| A | 4 | 2 | 248950 | 1544.97 | 783 | 765 | 160.6 |
| A | 13 | 254 | 11128 | 64.51 | 783 | 765 | 160.6 |
| A | 3 | 137 | 7716 | 43.27 | 783 | 765 | 160.6 |
| B | 10 | 245 | 22814 | 146.62 | 774 | 753 | 150.5 |
| B | 12 | 111 | 18628 | 118.8 | 774 | 753 | 150.5 |
| B | 0 | 190 | 17129 | 108.84 | 774 | 753 | 150.5 |
| C | 3 | 233 | 1486035 | 8467.07 | 743 | 748 | 175.4 |
| C | 14 | 238 | 119986 | 679.73 | 743 | 748 | 175.4 |
| C | 2 | 114 | 14451 | 78.12 | 743 | 748 | 175.4 |
| D | 8 | 195 | 1935455 | 10563.51 | 755 | 733 | 183.2 |
| D | 1 | 52 | 295324 | 1608.46 | 755 | 733 | 183.2 |
| D | 2 | 250 | 27672 | 147.09 | 755 | 733 | 183.2 |
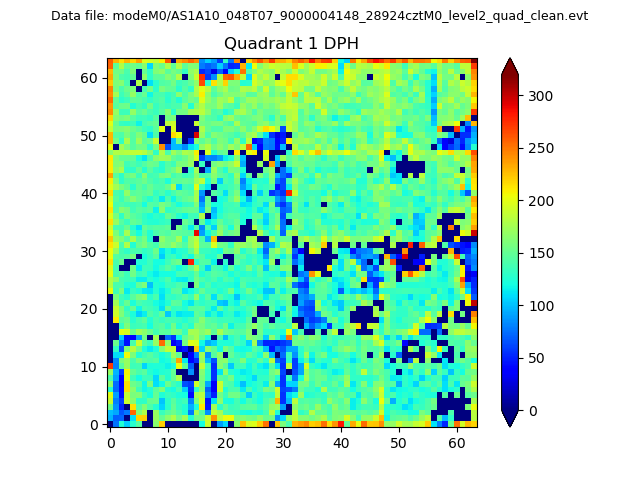
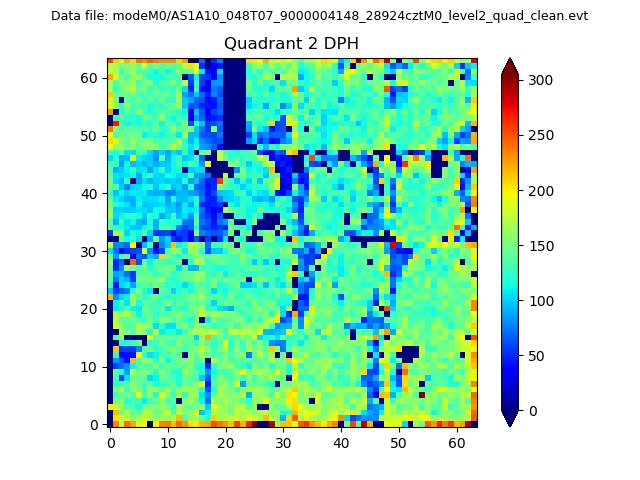
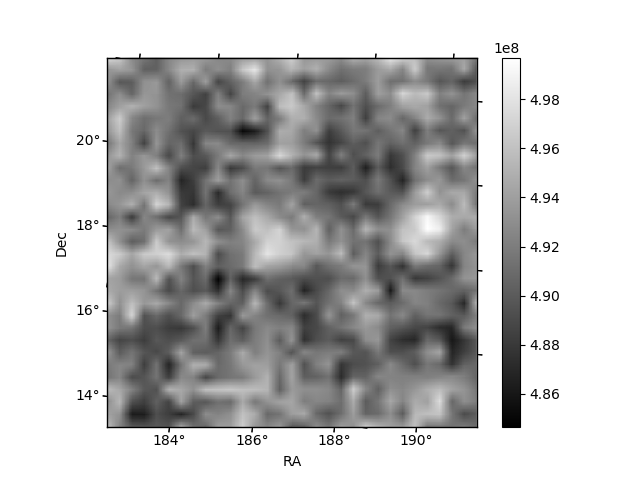
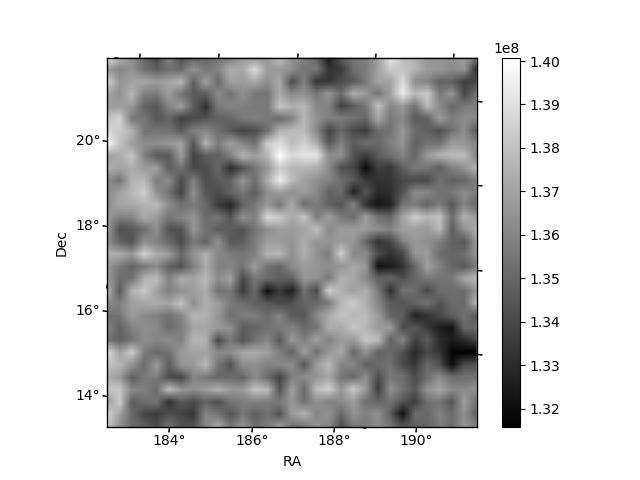
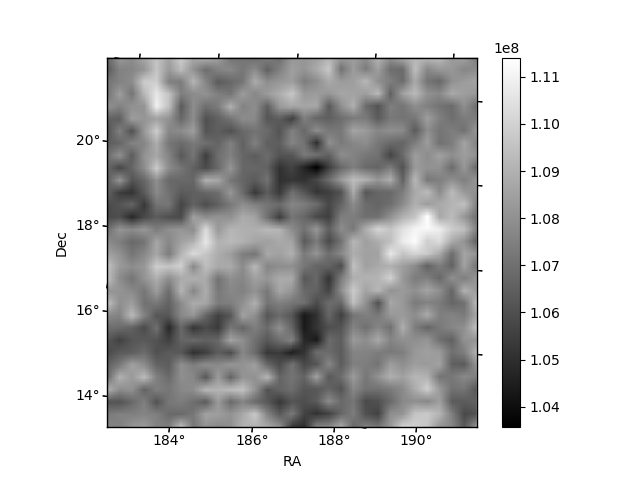
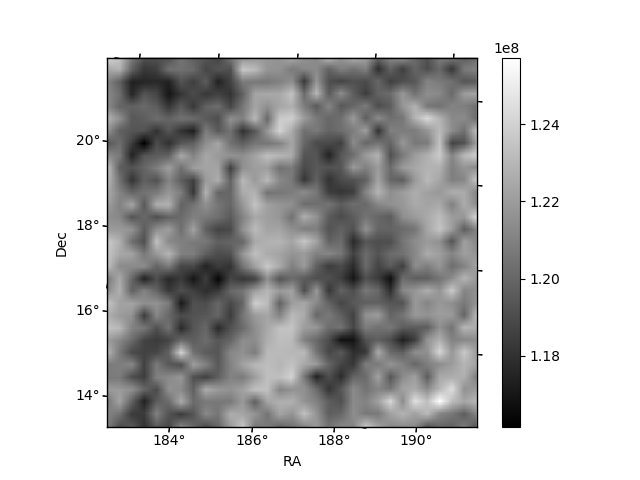
Histogram calculated using DETX and DETY for each event in the final _common_clean file
| Quadrant A | 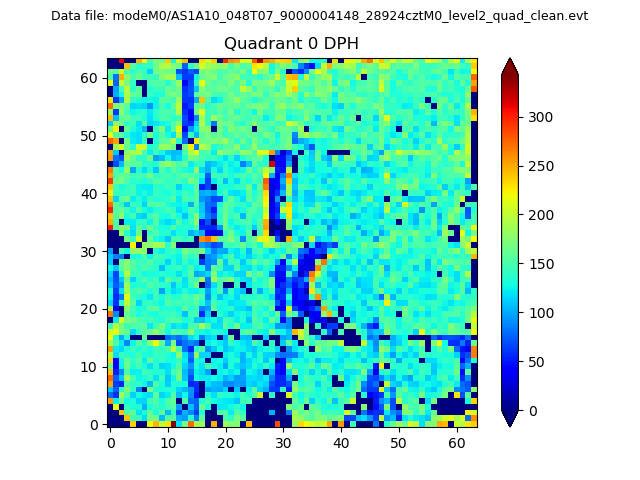 |
 |
Quadrant B |
|---|---|---|---|
| Quadrant D | 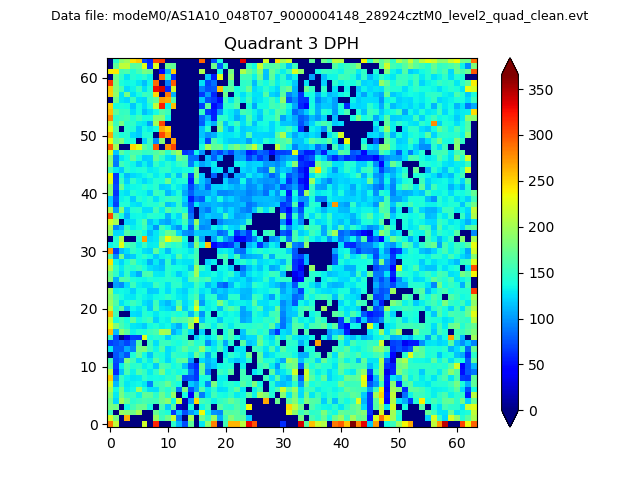 |
 |
Quadrant C |
| Plot type | Count rate plots | Images |
|---|---|---|
| Comparison with Poisson distribution Blue bars denote a histogram of data divided into 1 sec bins. Red curve is a Poisson curve with rate = median count rate of data. |
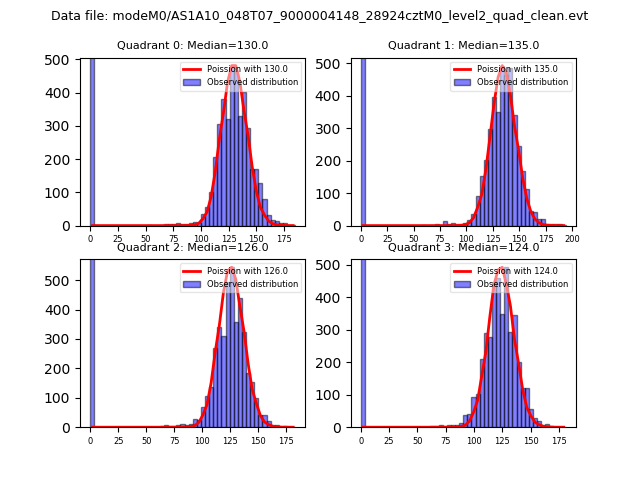 |
 |
| Quadrant-wise count rates Data is divided into 100 sec bins |
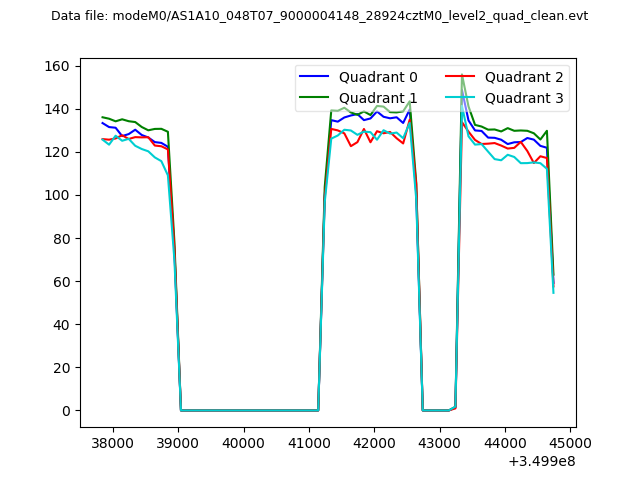 |
|
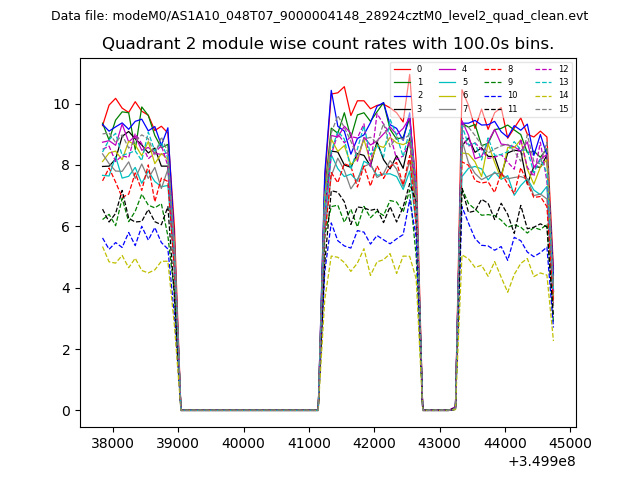
| Module-wise count rates for Quadrant A Data is divided into 100 sec bins |
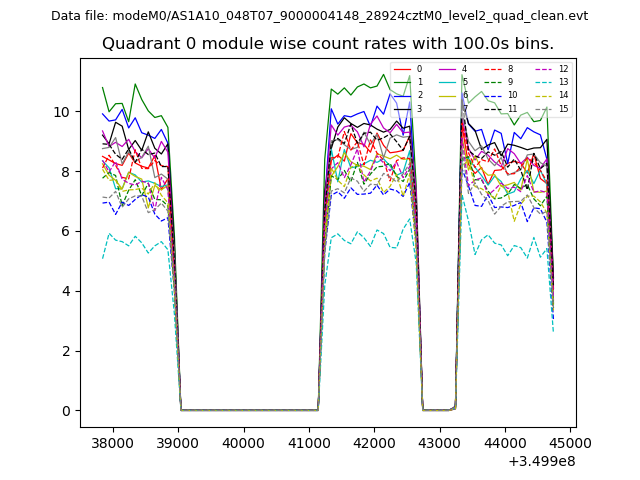 |
 |
| Module-wise count rates for Quadrant B Data is divided into 100 sec bins |
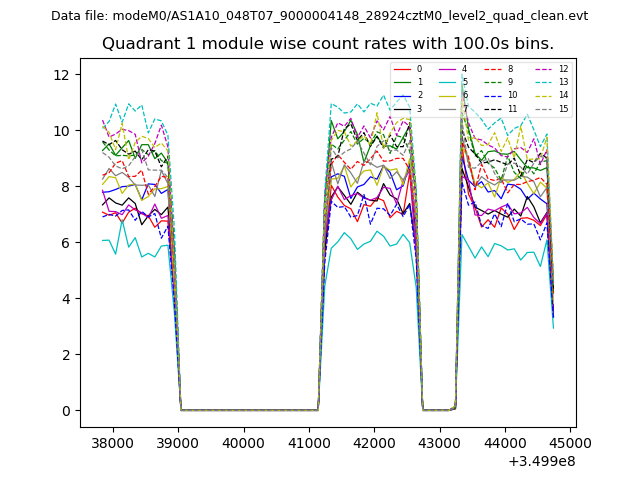 |
 |
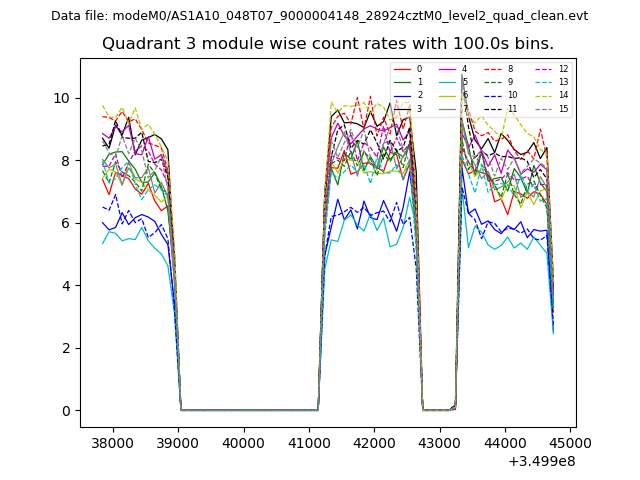
| Module-wise count rates for Quadrant C Data is divided into 100 sec bins |
 |
 |
| Module-wise count rates for Quadrant D Data is divided into 100 sec bins |
 |
 |
| Parameter | Plot |
|---|---|
| CZT HV Monitor | 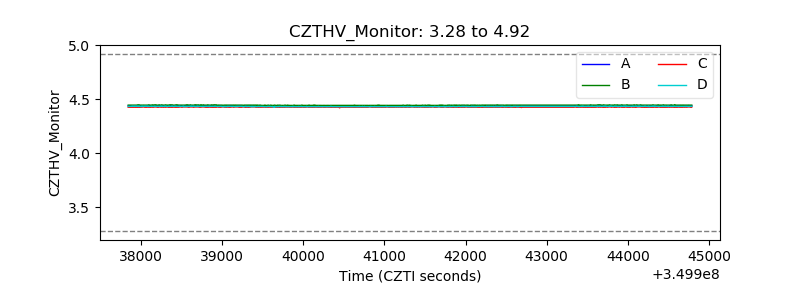 |
| D_VDD |  |
| Temperature 1 | 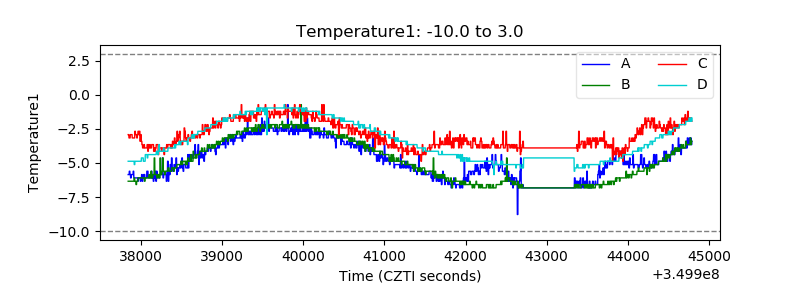 |
| Veto HV Monitor | 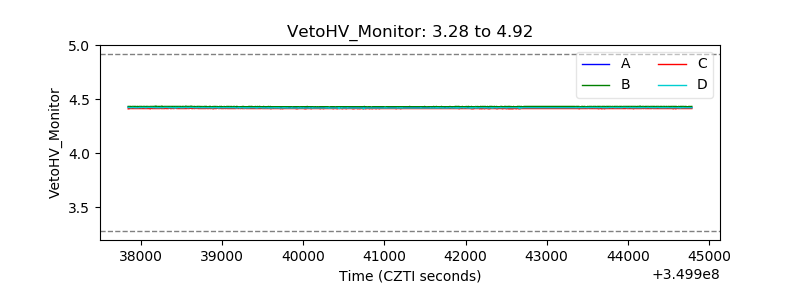 |
| Veto LLD | 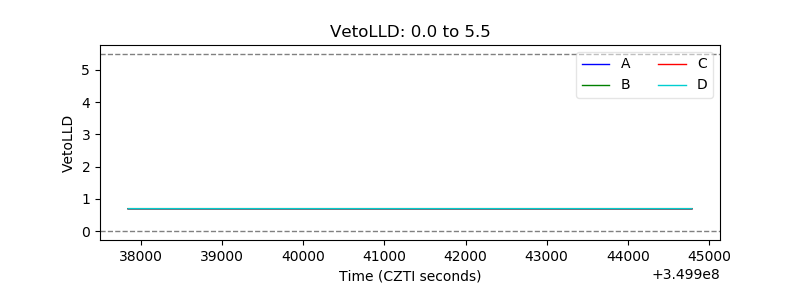 |
| Alpha Counter | 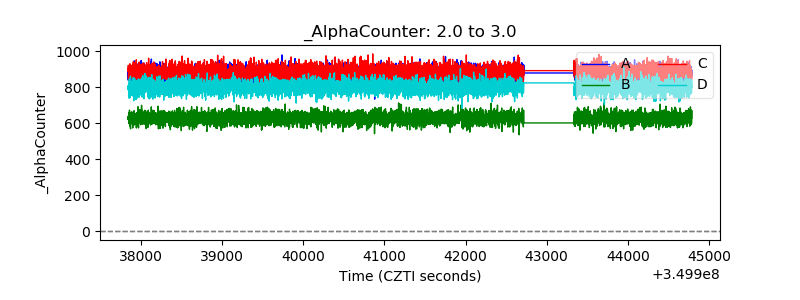 |
| _CPM_Rate | 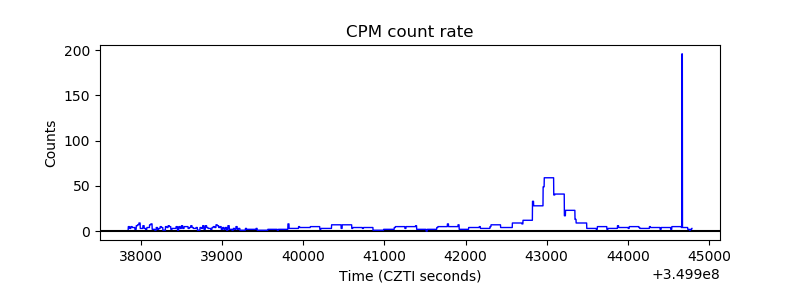 |
| CZT Counter | 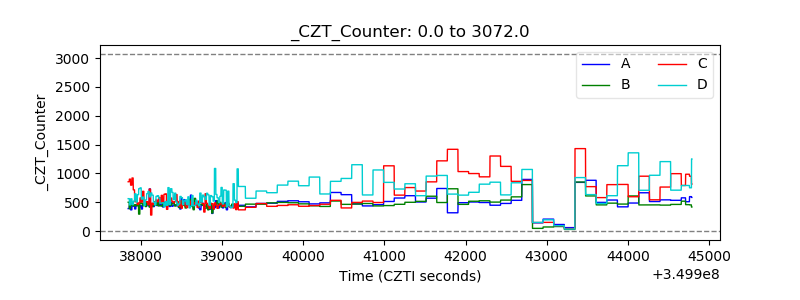 |
| +2.5 Volts monitor |  |
| +5 Volts monitor |  |
| _ROLL_ROT | 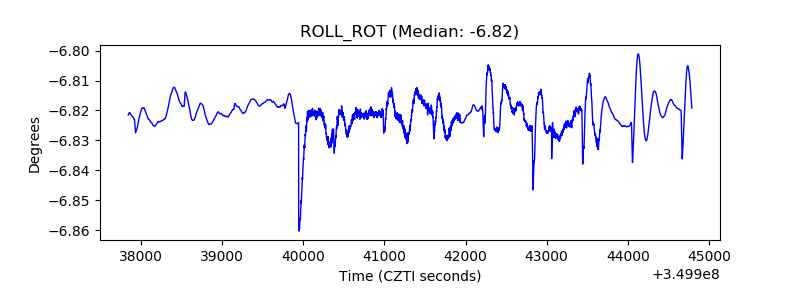 |
| _Roll_DEC | 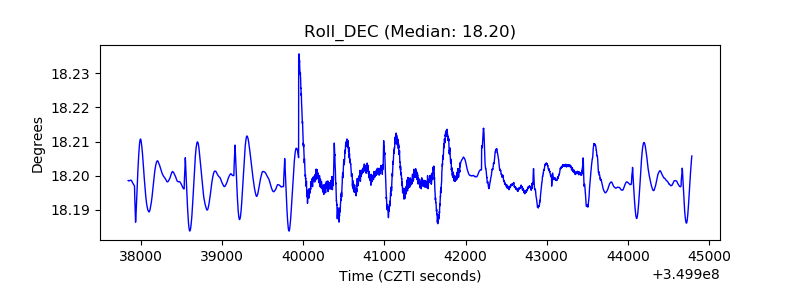 |
| _Roll_RA | 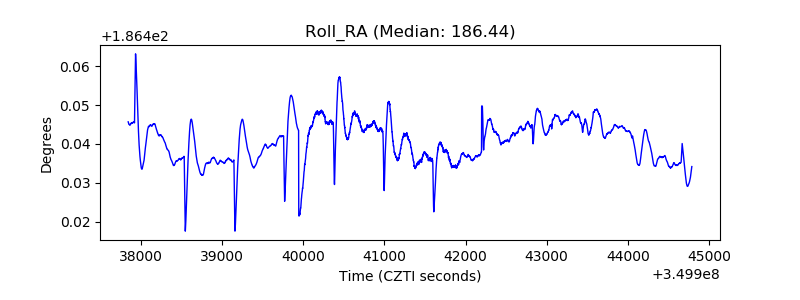 |
| Veto Counter | 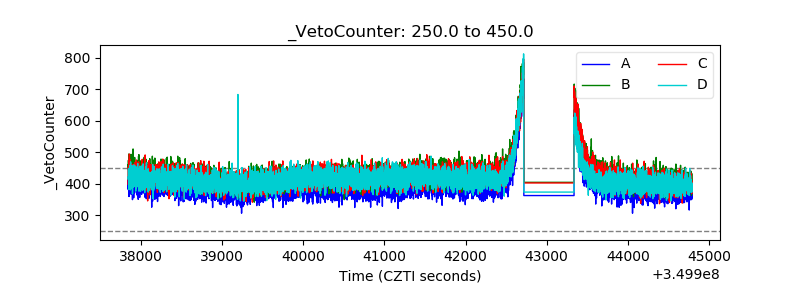 |