| Param | Original file | Final file |
|---|---|---|
| Filename | modeM0/AS1A10_048T07_9000004148_28925cztM0_level2.evt | modeM0/AS1A10_048T07_9000004148_28925cztM0_level2_quad_clean.evt |
| Size (bytes) | 696,461,760 | 87,733,440 |
| Size | 664.2 MB | 83.7 MB |
| Events in quadrant A | 3,462,276 | 552,767 |
| Events in quadrant B | 3,393,441 | 569,942 |
| Events in quadrant C | 7,384,157 | 524,905 |
| Events in quadrant D | 6,382,092 | 524,240 |
| Mode M0 | |||
|---|---|---|---|
| Quadrant | BADHDUFLAG | Total packets | Discarded packets |
| A | 0 | 14672 | 1 |
| B | 0 | 14395 | 1 |
| C | 0 | 26935 | 1 |
| D | 0 | 23814 | 3 |
| Mode M9 | |||
|---|---|---|---|
| Quadrant | BADHDUFLAG | Total packets | Discarded packets |
| A | 0 | 2 | 0 |
| B | 0 | 2 | 0 |
| C | 0 | 2 | 0 |
| D | 0 | 2 | 0 |
| Mode SS | |||
|---|---|---|---|
| Quadrant | BADHDUFLAG | Total packets | Discarded packets |
| A | 0 | 142 | 0 |
| B | 0 | 142 | 0 |
| C | 0 | 142 | 0 |
| D | 0 | 142 | 0 |
| Quadrant | Total seconds | Saturated seconds | Saturation percentage |
|---|---|---|---|
| A | 6948 | 128 | 1.842257% |
| B | 6949 | 143 | 2.057850% |
| C | 6949 | 1378 | 19.830191% |
| D | 6948 | 452 | 6.505469% |
Noise dominated data is calculated using 1-second bins in cleaned event files. If a bin has >2000 counts, and if more than 50% of those come from <1% of pixels, then it is considered to be noise-dominated and hence unusable.
| Quadrant | # 1 sec bins | Bins with >0 counts | Bins with >2000 counts | High rate bins dominated by noise | Noise dominated (total time) | Noise dominated (detector-on time) | Marked lightcurve |
|---|---|---|---|---|---|---|---|
| A | 7213 | 6949 | 0 | 0 | 0.00% | 0.00% | 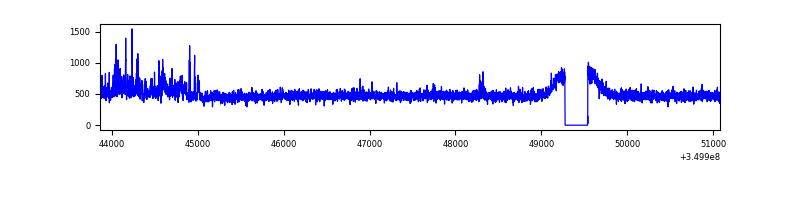 |
| B | 7214 | 6950 | 1 | 1 | 0.01% | 0.01% | 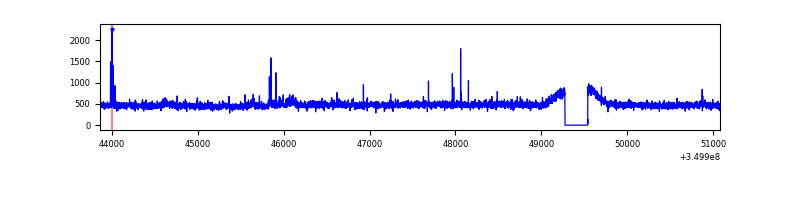 |
| C | 7214 | 6950 | 771 | 771 | 10.69% | 11.09% | 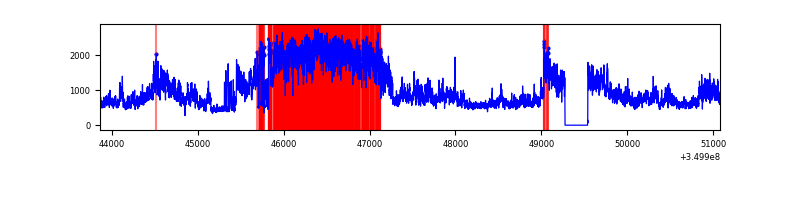 |
| D | 7213 | 6949 | 370 | 370 | 5.13% | 5.32% | 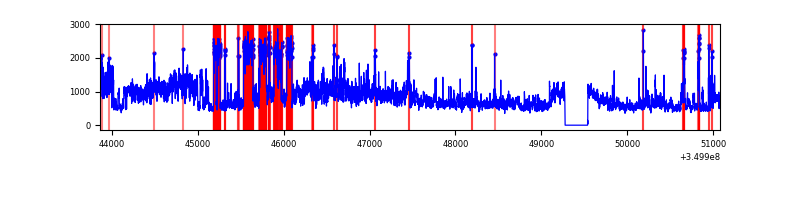 |
Top three noisy pixels from each quadrant. If the there are fewer than three noisy pixels in the level2.evt file, extra rows are filled as -1
| Pixel properties | Quadrant properties | ||||||
|---|---|---|---|---|---|---|---|
| Quadrant | DetID | PixID | Counts | Sigma | Mean | Median | Sigma |
| A | 4 | 2 | 141383 | 804.35 | 854 | 834 | 174.7 |
| A | 13 | 254 | 12040 | 64.13 | 854 | 834 | 174.7 |
| A | 6 | 16 | 11887 | 63.26 | 854 | 834 | 174.7 |
| B | 15 | 33 | 27651 | 163.77 | 846 | 824 | 163.8 |
| B | 10 | 245 | 24247 | 142.99 | 846 | 824 | 163.8 |
| B | 12 | 111 | 20583 | 120.62 | 846 | 824 | 163.8 |
| C | 3 | 233 | 4186495 | 22691.51 | 781 | 785 | 184.5 |
| C | 14 | 238 | 127519 | 687.05 | 781 | 785 | 184.5 |
| C | 2 | 114 | 15658 | 80.63 | 781 | 785 | 184.5 |
| D | 8 | 195 | 2922736 | 14874.18 | 816 | 795 | 196.4 |
| D | 1 | 52 | 237878 | 1206.87 | 816 | 795 | 196.4 |
| D | 12 | 79 | 45571 | 227.93 | 816 | 795 | 196.4 |
Histogram calculated using DETX and DETY for each event in the final _common_clean file
| Quadrant A | 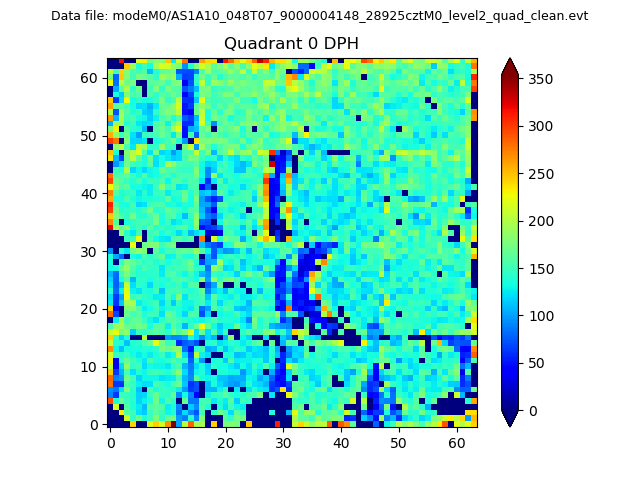 |
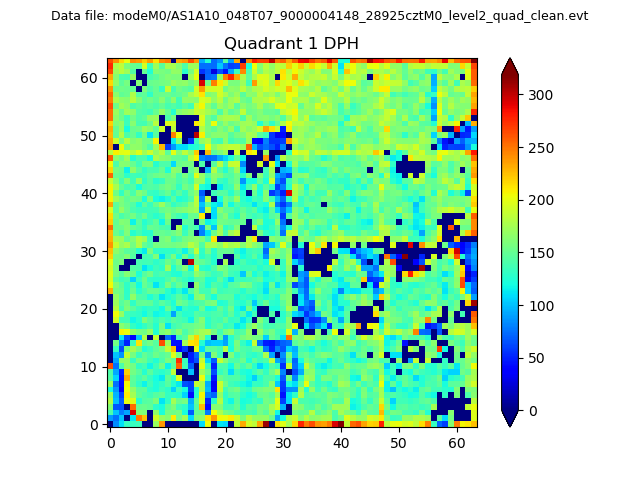 |
Quadrant B |
|---|---|---|---|
| Quadrant D | 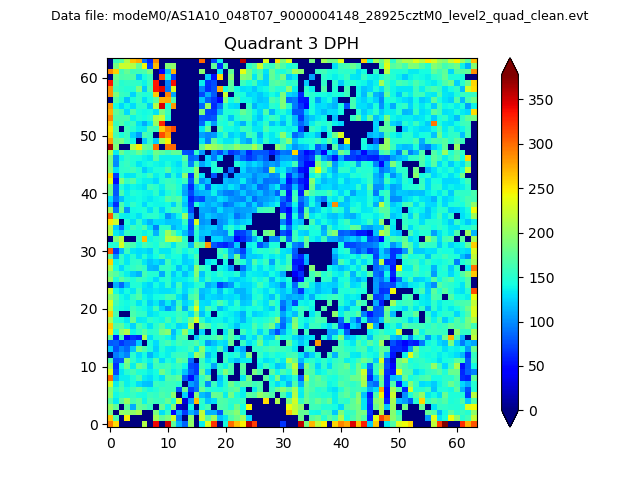 |
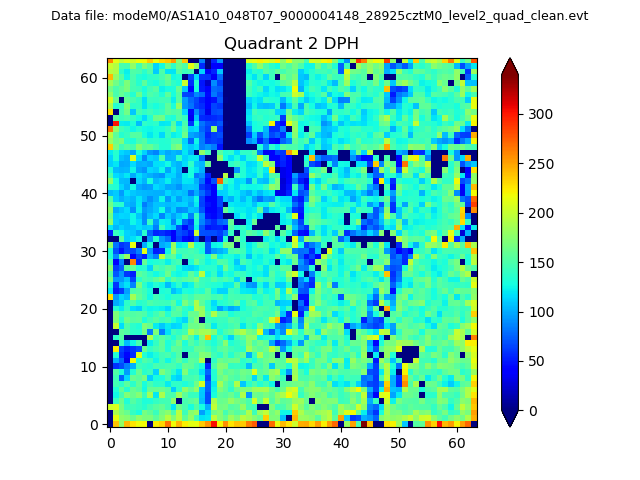 |
Quadrant C |
| Plot type | Count rate plots | Images |
|---|---|---|
| Comparison with Poisson distribution Blue bars denote a histogram of data divided into 1 sec bins. Red curve is a Poisson curve with rate = median count rate of data. |
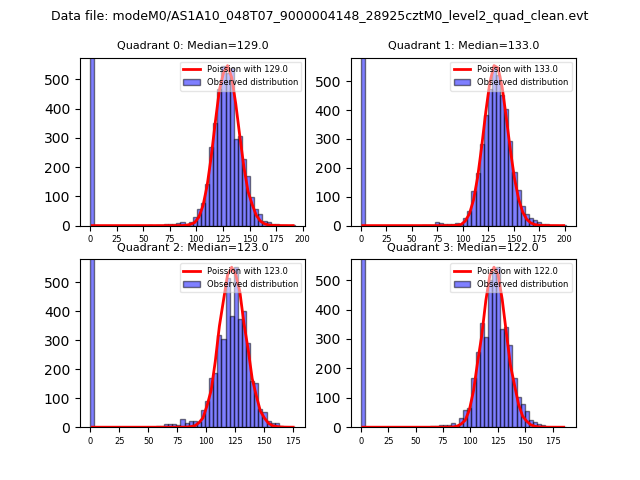 |
 |
| Quadrant-wise count rates Data is divided into 100 sec bins |
 |
|
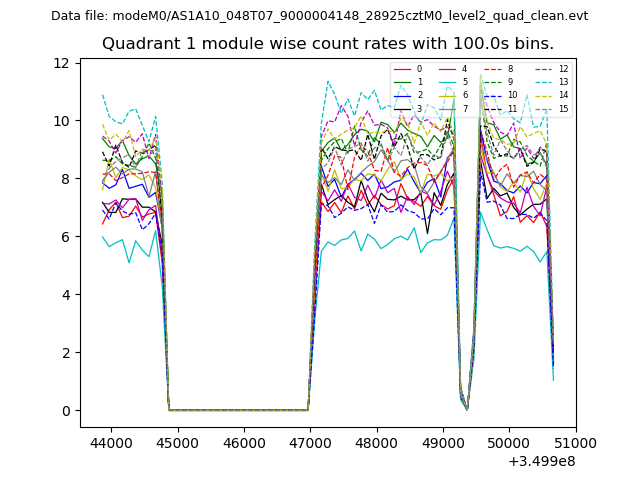
| Module-wise count rates for Quadrant A Data is divided into 100 sec bins |
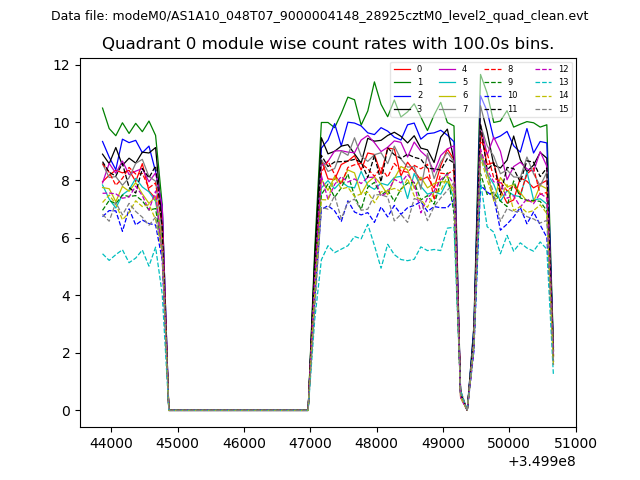 |
 |
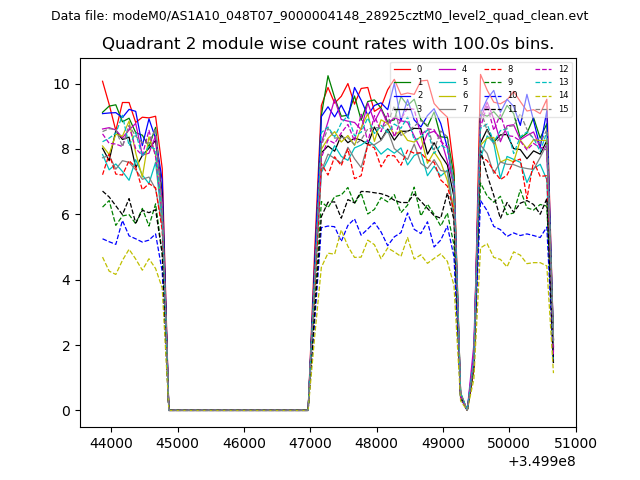
| Module-wise count rates for Quadrant B Data is divided into 100 sec bins |
 |
 |
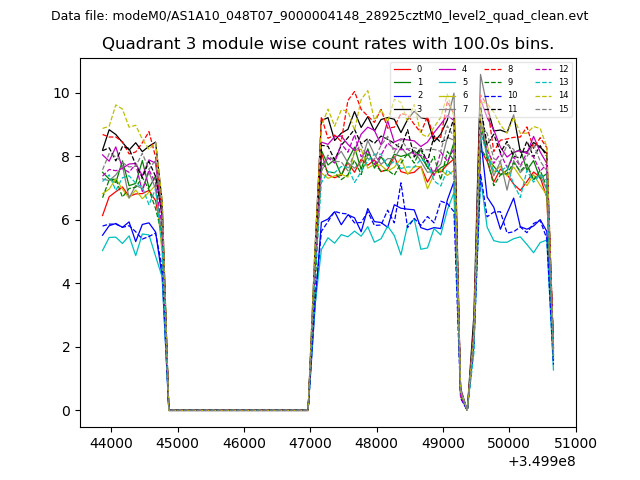
| Module-wise count rates for Quadrant C Data is divided into 100 sec bins |
 |
 |
| Module-wise count rates for Quadrant D Data is divided into 100 sec bins |
 |
 |
| Parameter | Plot |
|---|---|
| CZT HV Monitor | 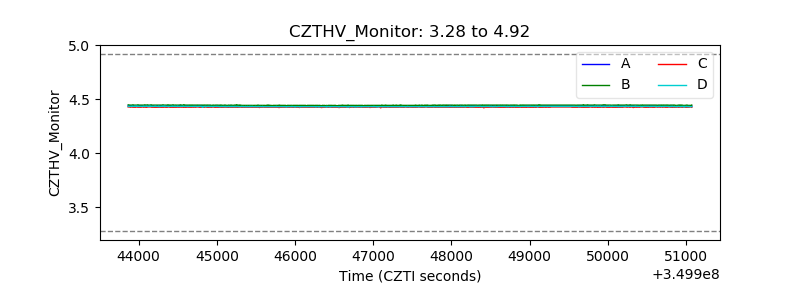 |
| D_VDD | 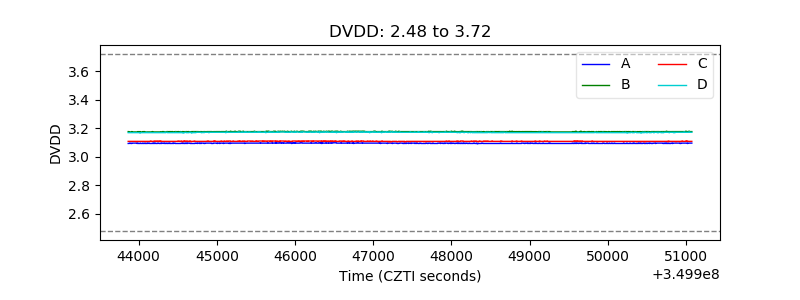 |
| Temperature 1 |  |
| Veto HV Monitor | 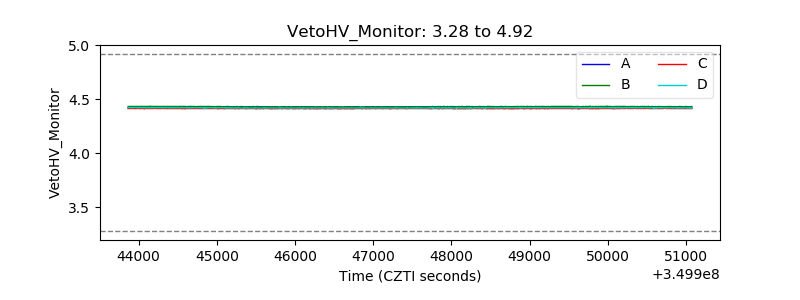 |
| Veto LLD |  |
| Alpha Counter | 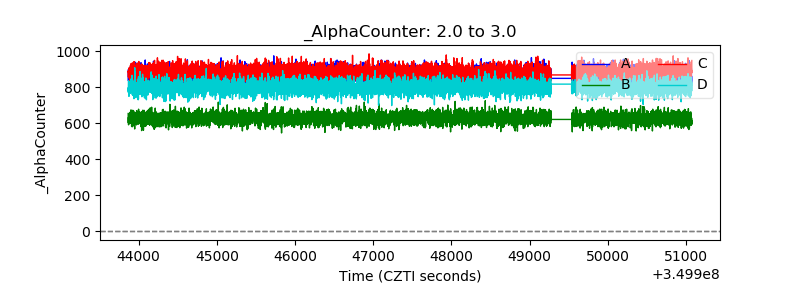 |
| _CPM_Rate | 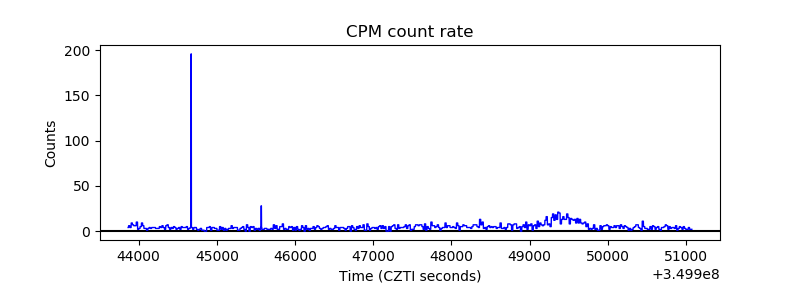 |
| CZT Counter | 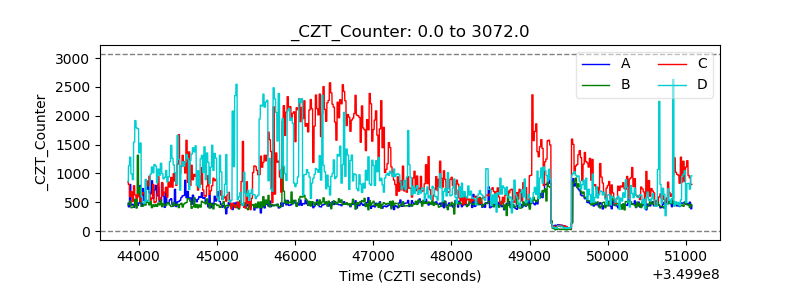 |
| +2.5 Volts monitor |  |
| +5 Volts monitor |  |
| _ROLL_ROT | 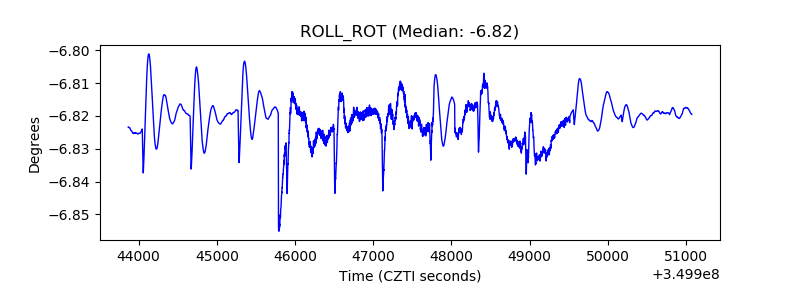 |
| _Roll_DEC | 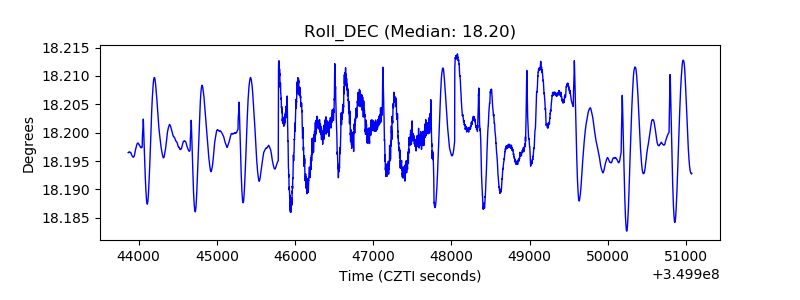 |
| _Roll_RA | 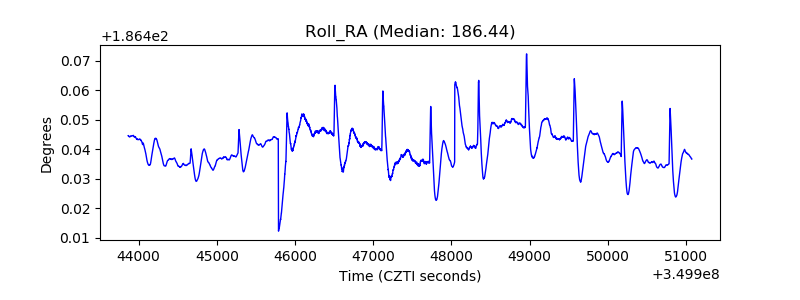 |
| Veto Counter | 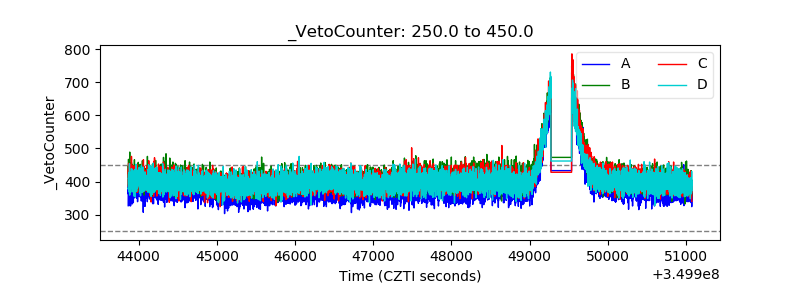 |