| Param | Original file | Final file |
|---|---|---|
| Filename | modeM0/AS1A10_048T07_9000004148_28926cztM0_level2.evt | modeM0/AS1A10_048T07_9000004148_28926cztM0_level2_quad_clean.evt |
| Size (bytes) | 775,463,040 | 93,792,960 |
| Size | 739.5 MB | 89.4 MB |
| Events in quadrant A | 3,817,615 | 589,641 |
| Events in quadrant B | 3,928,090 | 602,381 |
| Events in quadrant C | 8,073,212 | 555,016 |
| Events in quadrant D | 7,139,294 | 550,172 |
| Mode M0 | |||
|---|---|---|---|
| Quadrant | BADHDUFLAG | Total packets | Discarded packets |
| A | 0 | 16297 | 3 |
| B | 0 | 16463 | 3 |
| C | 0 | 29496 | 3 |
| D | 0 | 26464 | 3 |
| Mode M9 | |||
|---|---|---|---|
| Quadrant | BADHDUFLAG | Total packets | Discarded packets |
| A | 0 | 1 | 0 |
| B | 0 | 2 | 0 |
| C | 0 | 2 | 0 |
| D | 0 | 2 | 0 |
| Mode SS | |||
|---|---|---|---|
| Quadrant | BADHDUFLAG | Total packets | Discarded packets |
| A | 0 | 160 | 0 |
| B | 0 | 160 | 0 |
| C | 0 | 160 | 0 |
| D | 0 | 160 | 0 |
| Quadrant | Total seconds | Saturated seconds | Saturation percentage |
|---|---|---|---|
| A | 7796 | 229 | 2.937404% |
| B | 7796 | 256 | 3.283735% |
| C | 7796 | 982 | 12.596203% |
| D | 7796 | 767 | 9.838379% |
Noise dominated data is calculated using 1-second bins in cleaned event files. If a bin has >2000 counts, and if more than 50% of those come from <1% of pixels, then it is considered to be noise-dominated and hence unusable.
| Quadrant | # 1 sec bins | Bins with >0 counts | Bins with >2000 counts | High rate bins dominated by noise | Noise dominated (total time) | Noise dominated (detector-on time) | Marked lightcurve |
|---|---|---|---|---|---|---|---|
| A | 7962 | 7799 | 0 | 0 | 0.00% | 0.00% | 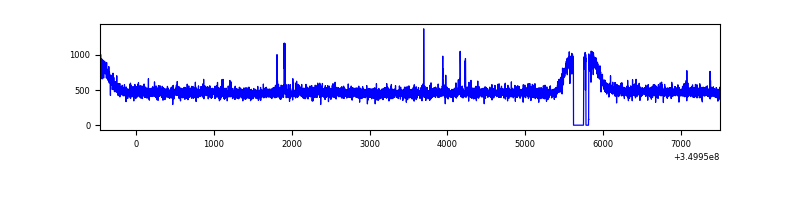 |
| B | 7962 | 7799 | 1 | 1 | 0.01% | 0.01% | 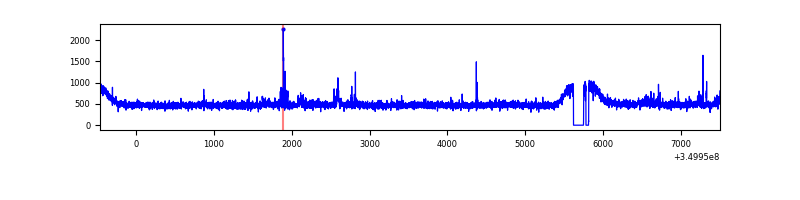 |
| C | 7962 | 7799 | 237 | 237 | 2.98% | 3.04% | 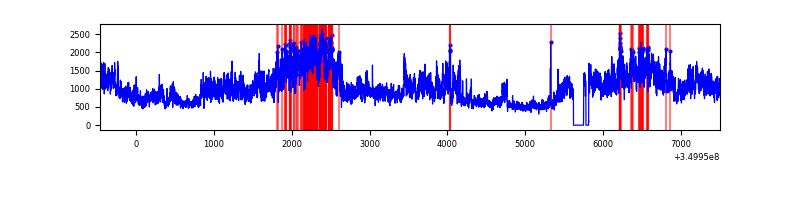 |
| D | 7962 | 7799 | 536 | 536 | 6.73% | 6.87% | 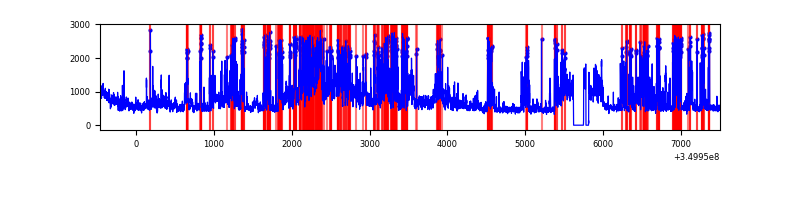 |
Top three noisy pixels from each quadrant. If the there are fewer than three noisy pixels in the level2.evt file, extra rows are filled as -1
| Pixel properties | Quadrant properties | ||||||
|---|---|---|---|---|---|---|---|
| Quadrant | DetID | PixID | Counts | Sigma | Mean | Median | Sigma |
| A | 13 | 254 | 13638 | 63.3 | 980 | 957 | 200.3 |
| A | 15 | 174 | 13105 | 60.64 | 980 | 957 | 200.3 |
| A | 5 | 168 | 12668 | 58.46 | 980 | 957 | 200.3 |
| B | 5 | 255 | 77189 | 402.32 | 968 | 940 | 189.5 |
| B | 12 | 111 | 23676 | 119.96 | 968 | 940 | 189.5 |
| B | 11 | 111 | 21813 | 110.13 | 968 | 940 | 189.5 |
| C | 3 | 233 | 4300970 | 19950.4 | 909 | 913 | 215.5 |
| C | 14 | 238 | 157138 | 724.82 | 909 | 913 | 215.5 |
| C | 15 | 208 | 26881 | 120.48 | 909 | 913 | 215.5 |
| D | 8 | 195 | 3159428 | 13898.69 | 933 | 906 | 227.3 |
| D | 1 | 52 | 351574 | 1543.07 | 933 | 906 | 227.3 |
| D | 12 | 79 | 45961 | 198.26 | 933 | 906 | 227.3 |
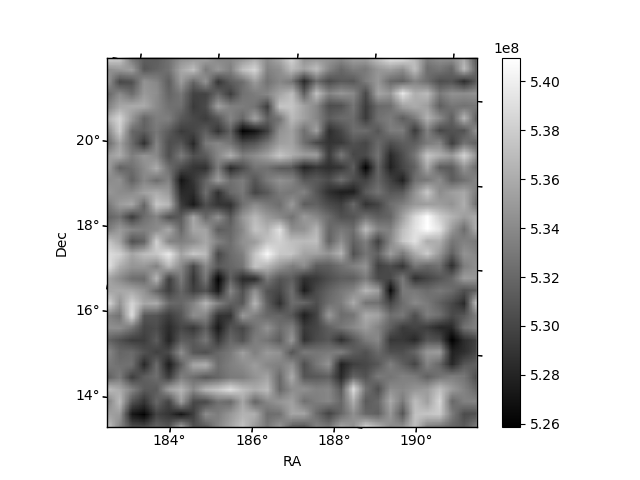
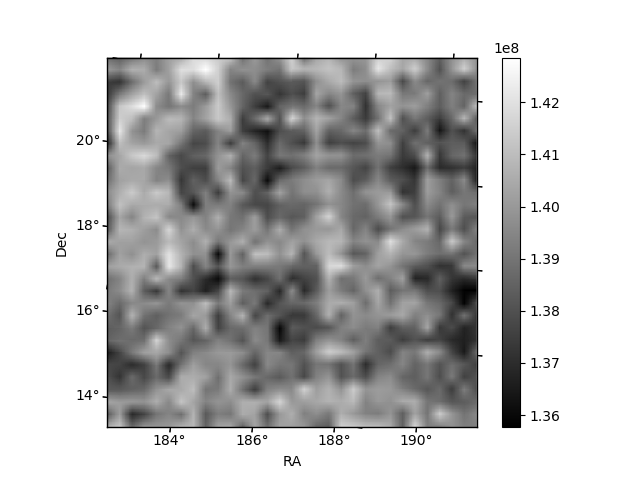
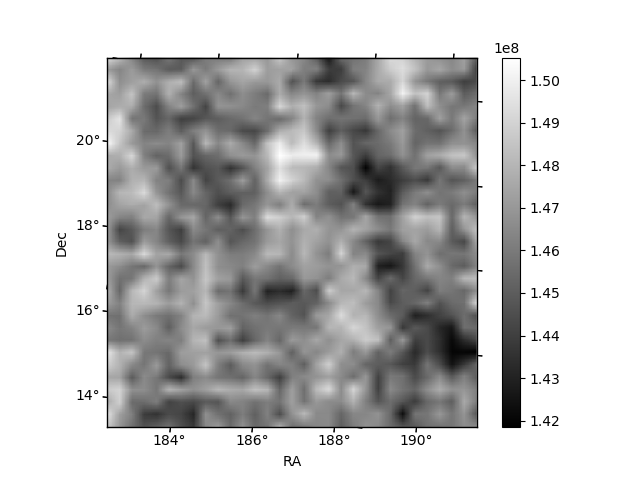
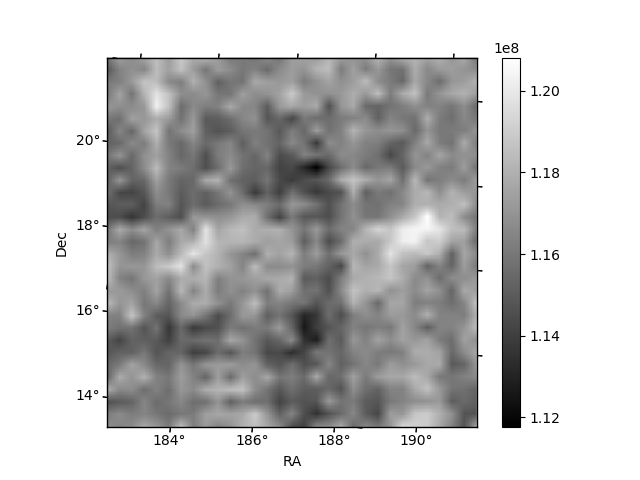
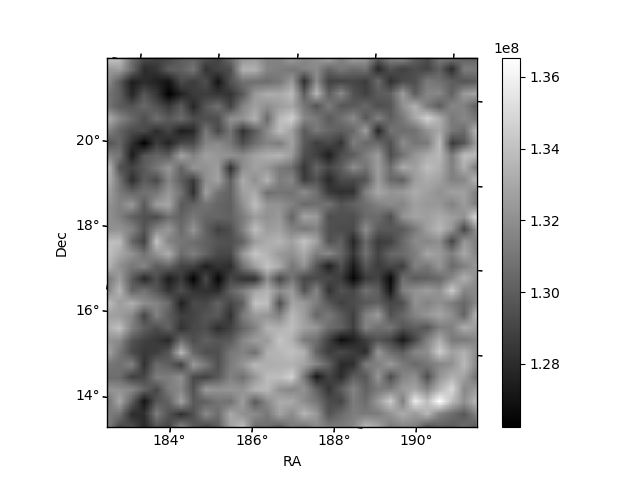
Histogram calculated using DETX and DETY for each event in the final _common_clean file
| Quadrant A | 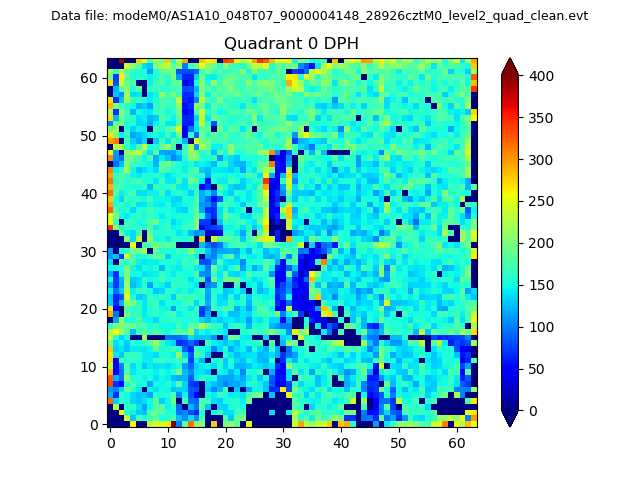 |
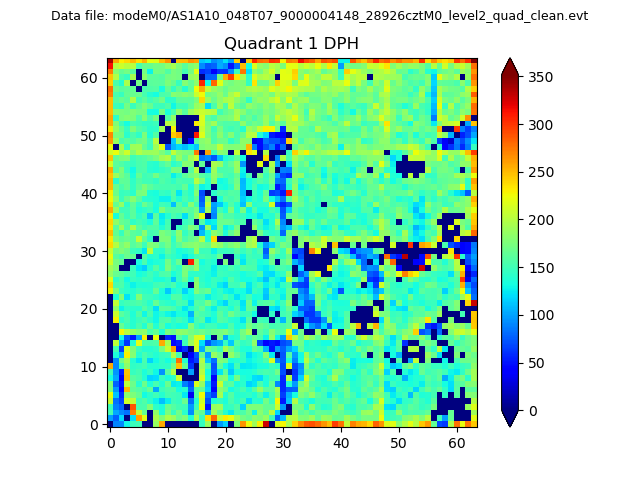 |
Quadrant B |
|---|---|---|---|
| Quadrant D | 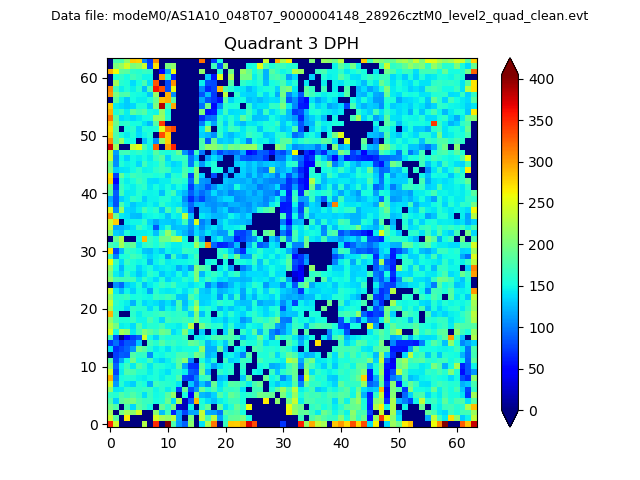 |
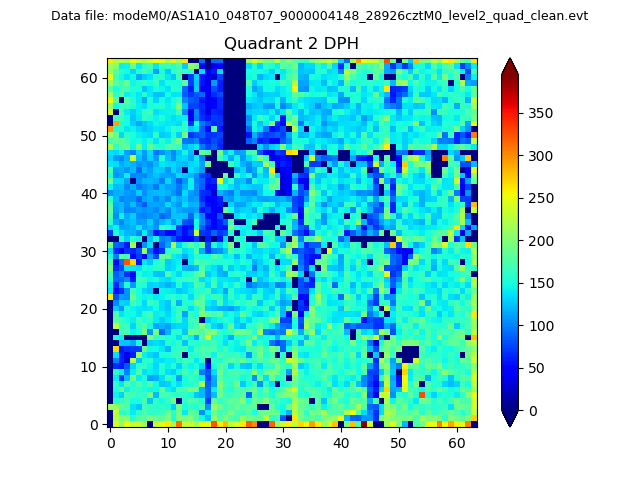 |
Quadrant C |
| Plot type | Count rate plots | Images |
|---|---|---|
| Comparison with Poisson distribution Blue bars denote a histogram of data divided into 1 sec bins. Red curve is a Poisson curve with rate = median count rate of data. |
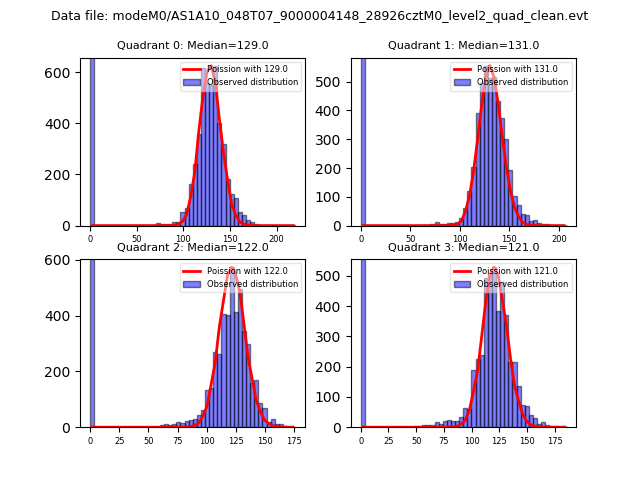 |
 |
| Quadrant-wise count rates Data is divided into 100 sec bins |
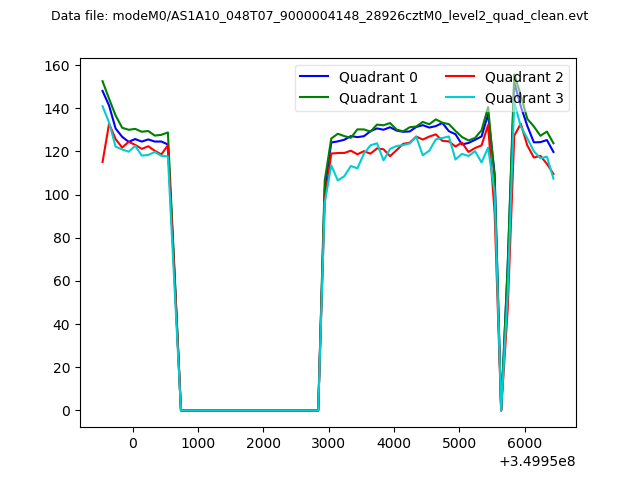 |
|
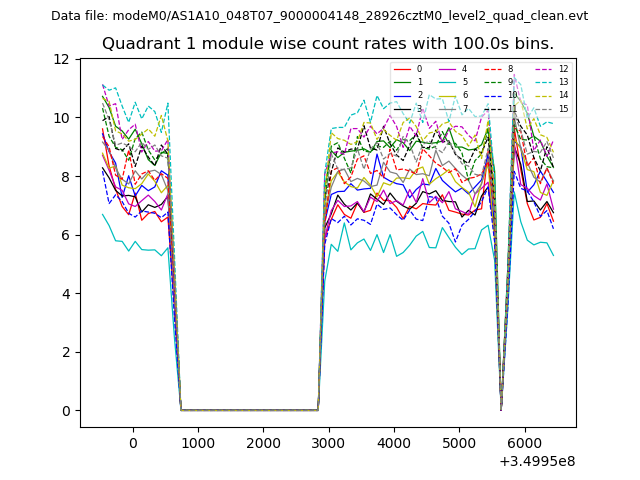
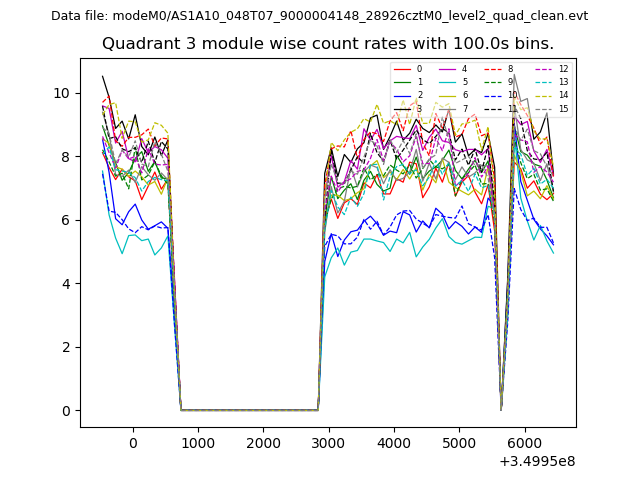
| Module-wise count rates for Quadrant A Data is divided into 100 sec bins |
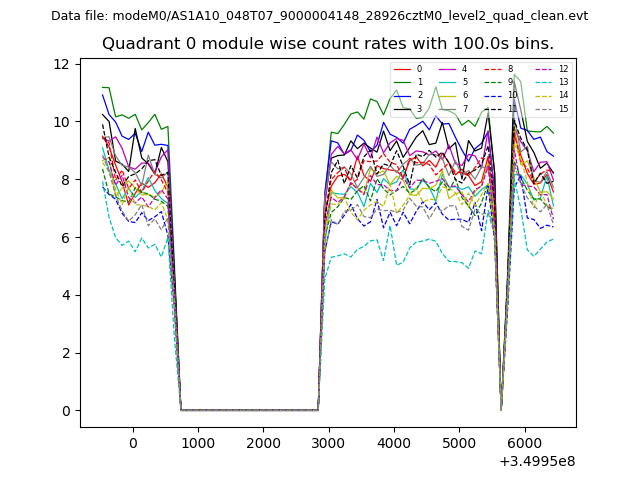 |
 |
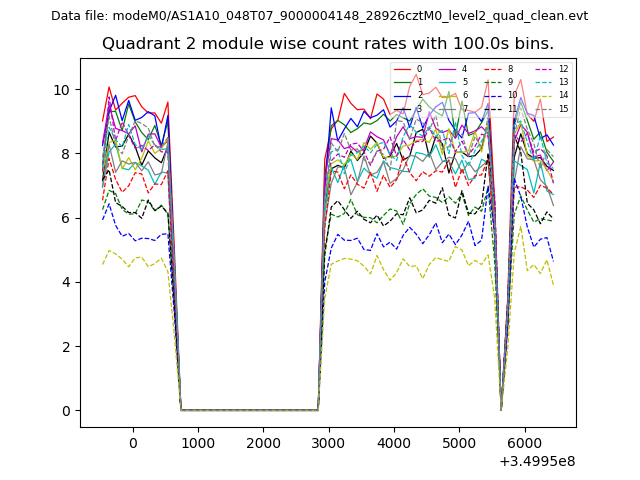
| Module-wise count rates for Quadrant B Data is divided into 100 sec bins |
 |
 |
| Module-wise count rates for Quadrant C Data is divided into 100 sec bins |
 |
 |
| Module-wise count rates for Quadrant D Data is divided into 100 sec bins |
 |
 |
| Parameter | Plot |
|---|---|
| CZT HV Monitor | 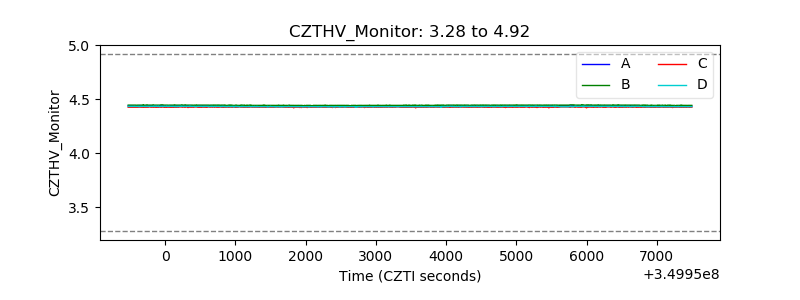 |
| D_VDD | 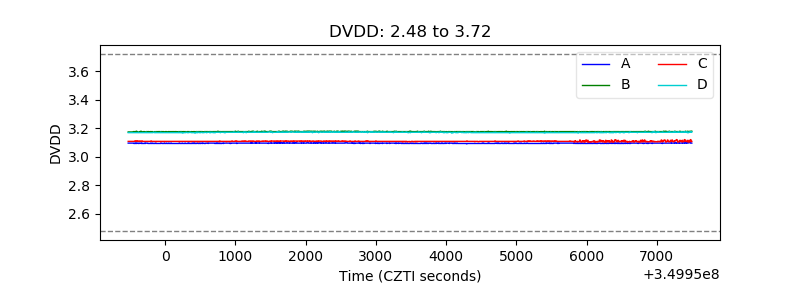 |
| Temperature 1 | 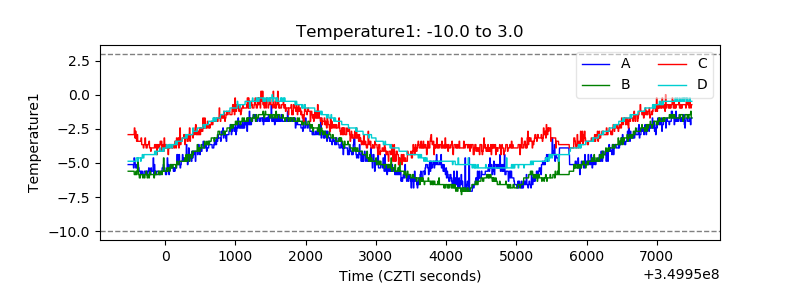 |
| Veto HV Monitor | 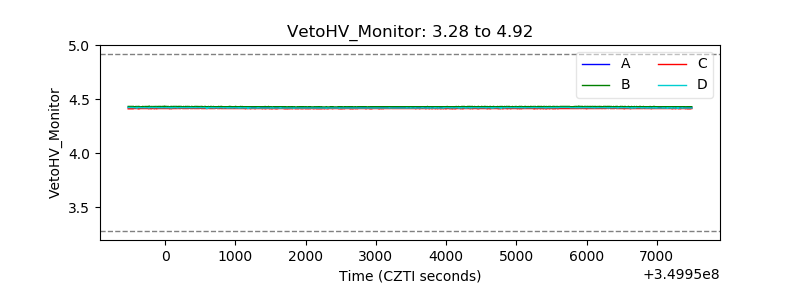 |
| Veto LLD | 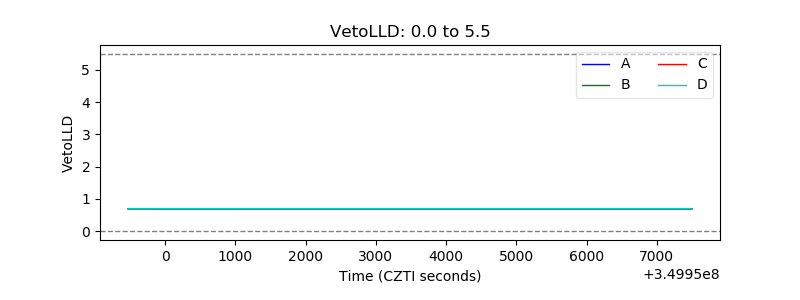 |
| Alpha Counter | 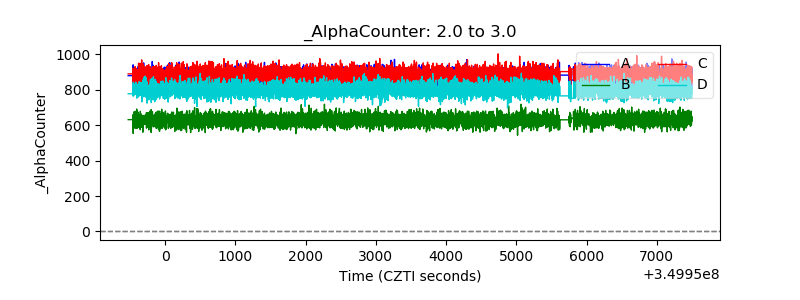 |
| _CPM_Rate | 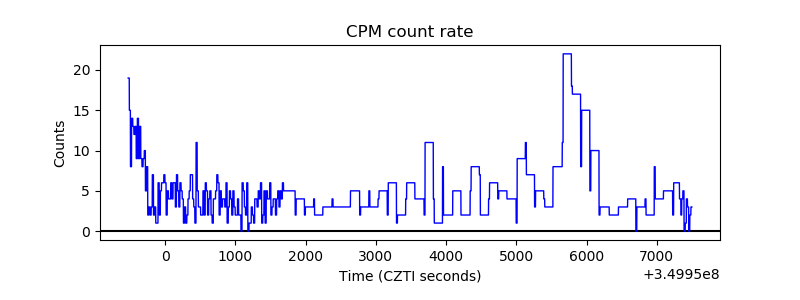 |
| CZT Counter | 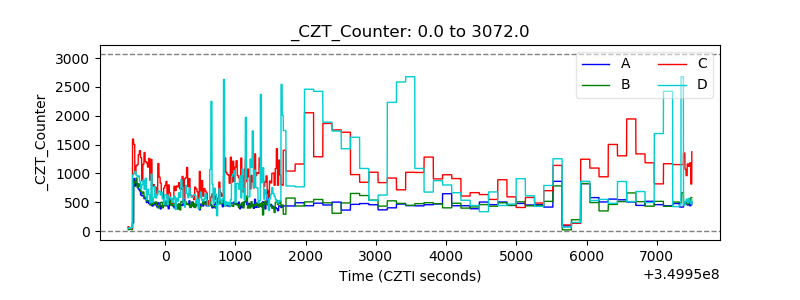 |
| +2.5 Volts monitor |  |
| +5 Volts monitor |  |
| _ROLL_ROT | 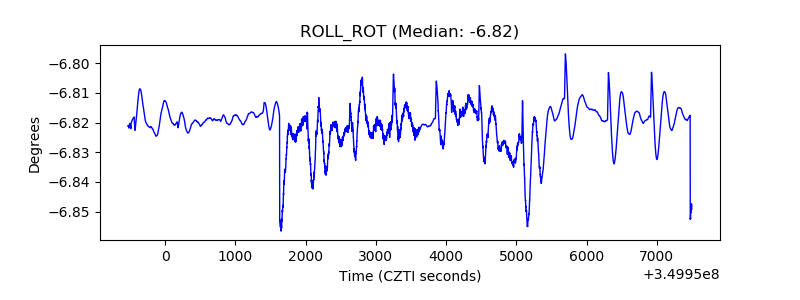 |
| _Roll_DEC | 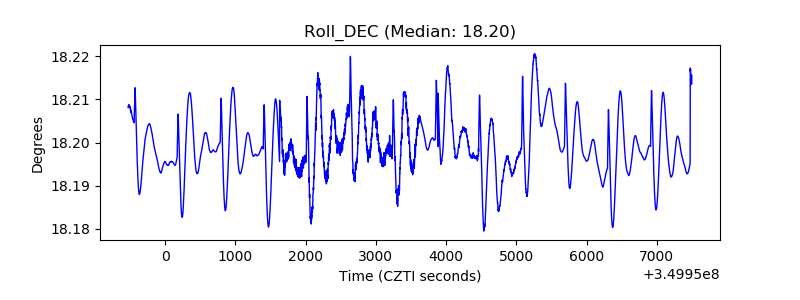 |
| _Roll_RA | 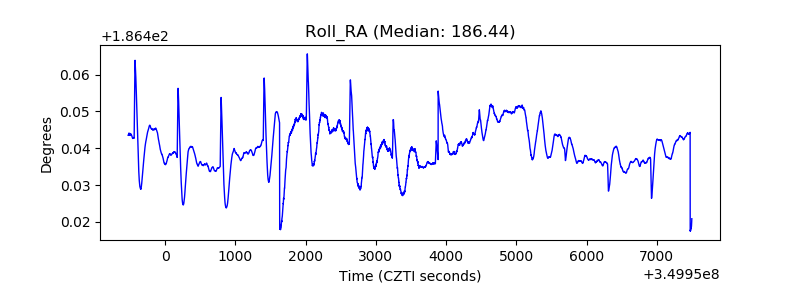 |
| Veto Counter | 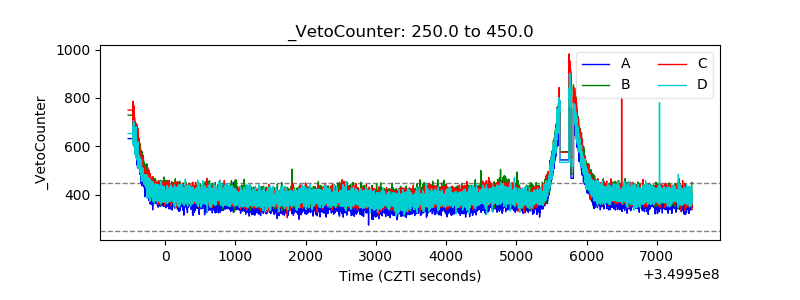 |