| Param | Original file | Final file |
|---|---|---|
| Filename | modeM0/AS1A10_048T07_9000004148_28930cztM0_level2.evt | modeM0/AS1A10_048T07_9000004148_28930cztM0_level2_quad_clean.evt |
| Size (bytes) | 617,083,200 | 83,390,400 |
| Size | 588.5 MB | 79.5 MB |
| Events in quadrant A | 3,426,509 | 519,108 |
| Events in quadrant B | 3,558,233 | 527,977 |
| Events in quadrant C | 5,308,698 | 500,783 |
| Events in quadrant D | 5,921,451 | 489,948 |
| Mode M0 | |||
|---|---|---|---|
| Quadrant | BADHDUFLAG | Total packets | Discarded packets |
| A | 0 | 14622 | 2 |
| B | 0 | 15053 | 2 |
| C | 0 | 20839 | 2 |
| D | 0 | 22453 | 2 |
| Mode M9 | |||
|---|---|---|---|
| Quadrant | BADHDUFLAG | Total packets | Discarded packets |
| A | 0 | 17 | 0 |
| B | 0 | 17 | 0 |
| C | 0 | 17 | 0 |
| D | 0 | 17 | 0 |
| Mode SS | |||
|---|---|---|---|
| Quadrant | BADHDUFLAG | Total packets | Discarded packets |
| A | 0 | 144 | 0 |
| B | 0 | 144 | 0 |
| C | 0 | 144 | 0 |
| D | 0 | 144 | 0 |
| Quadrant | Total seconds | Saturated seconds | Saturation percentage |
|---|---|---|---|
| A | 6995 | 85 | 1.215154% |
| B | 6996 | 113 | 1.615209% |
| C | 6996 | 378 | 5.403087% |
| D | 6996 | 610 | 8.719268% |
Noise dominated data is calculated using 1-second bins in cleaned event files. If a bin has >2000 counts, and if more than 50% of those come from <1% of pixels, then it is considered to be noise-dominated and hence unusable.
| Quadrant | # 1 sec bins | Bins with >0 counts | Bins with >2000 counts | High rate bins dominated by noise | Noise dominated (total time) | Noise dominated (detector-on time) | Marked lightcurve |
|---|---|---|---|---|---|---|---|
| A | 8670 | 6998 | 0 | 0 | 0.00% | 0.00% | 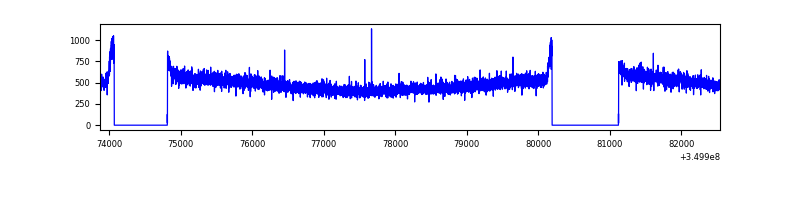 |
| B | 8672 | 7000 | 3 | 3 | 0.03% | 0.04% | 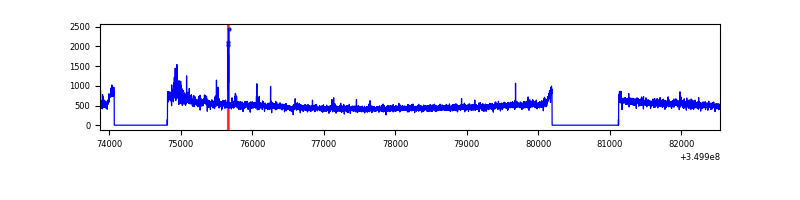 |
| C | 8672 | 7000 | 30 | 30 | 0.35% | 0.43% | 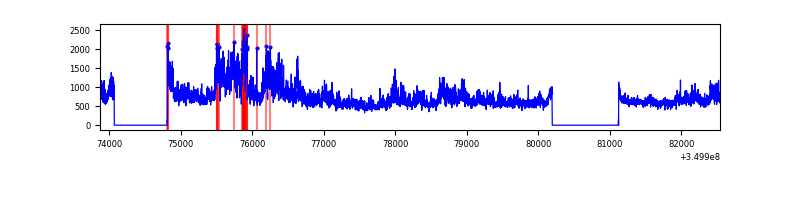 |
| D | 8672 | 7000 | 454 | 454 | 5.24% | 6.49% |  |
Top three noisy pixels from each quadrant. If the there are fewer than three noisy pixels in the level2.evt file, extra rows are filled as -1
| Pixel properties | Quadrant properties | ||||||
|---|---|---|---|---|---|---|---|
| Quadrant | DetID | PixID | Counts | Sigma | Mean | Median | Sigma |
| A | 13 | 254 | 12273 | 63.43 | 886 | 865 | 179.8 |
| A | 3 | 137 | 8849 | 44.39 | 886 | 865 | 179.8 |
| A | 0 | 226 | 7401 | 36.34 | 886 | 865 | 179.8 |
| B | 15 | 33 | 64419 | 373.58 | 879 | 857 | 170.1 |
| B | 15 | 35 | 22077 | 124.72 | 879 | 857 | 170.1 |
| B | 12 | 111 | 21181 | 119.45 | 879 | 857 | 170.1 |
| C | 3 | 233 | 1840094 | 9173.3 | 844 | 849 | 200.5 |
| C | 14 | 238 | 141987 | 703.93 | 844 | 849 | 200.5 |
| C | 2 | 114 | 16775 | 79.43 | 844 | 849 | 200.5 |
| D | 8 | 195 | 2139866 | 10563.66 | 842 | 820 | 202.5 |
| D | 1 | 52 | 457162 | 2253.64 | 842 | 820 | 202.5 |
| D | 12 | 79 | 104559 | 512.31 | 842 | 820 | 202.5 |
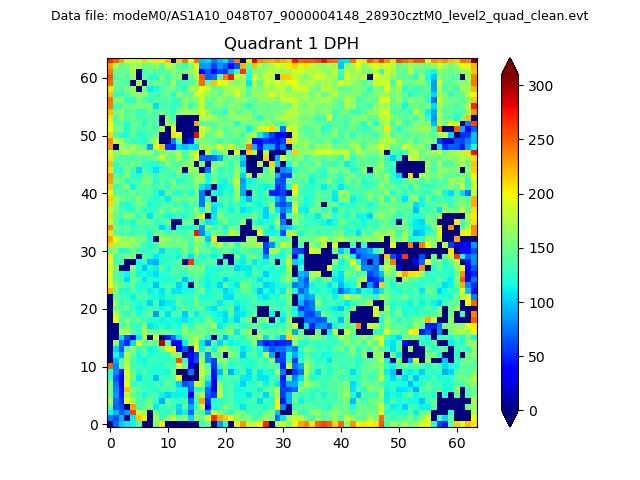
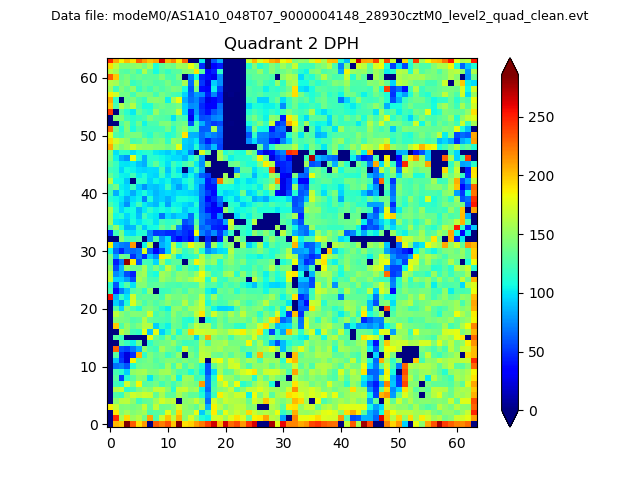
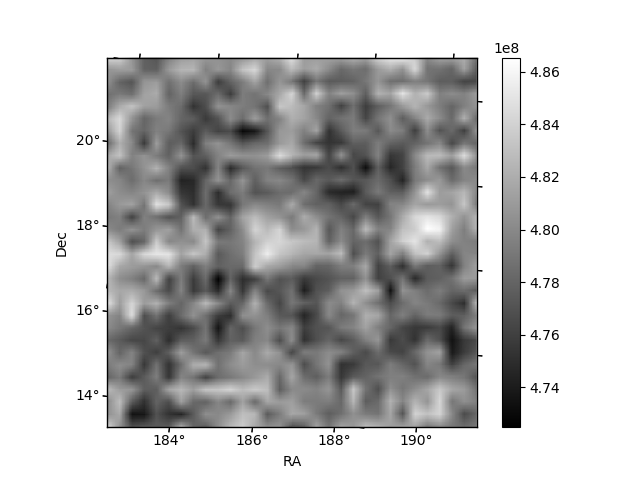
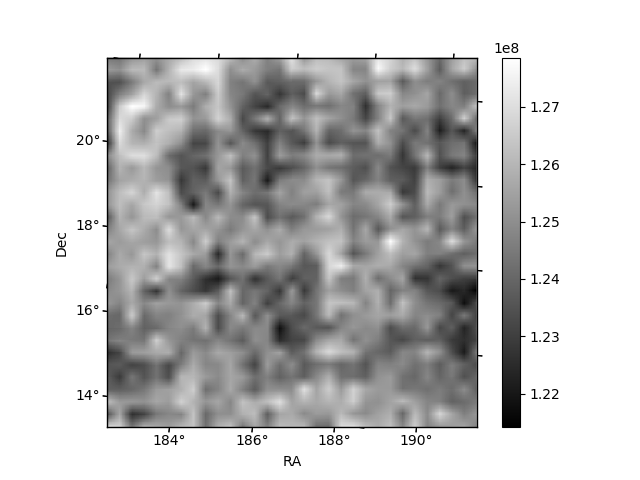
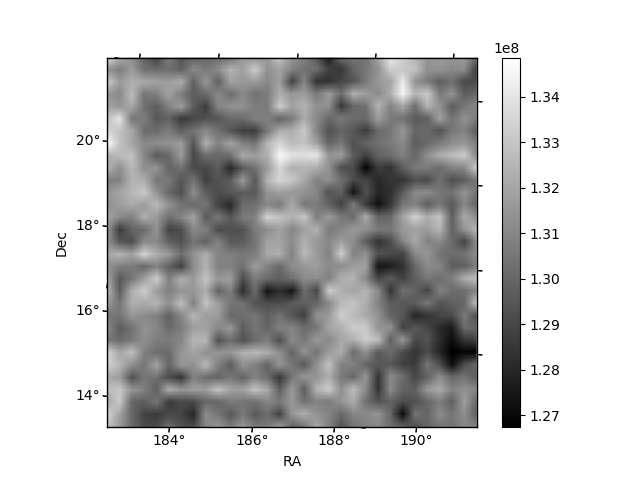
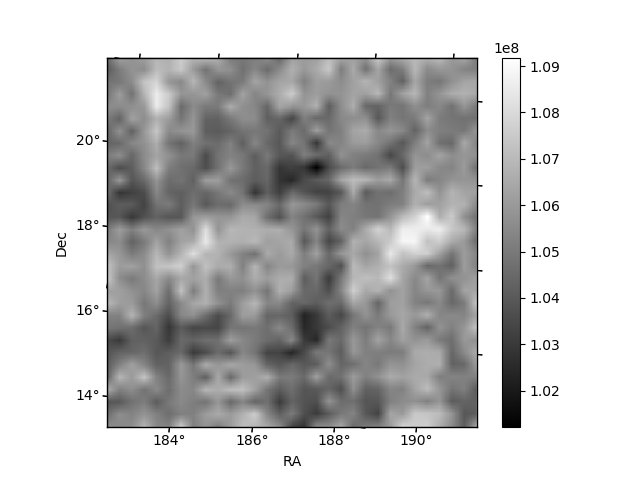
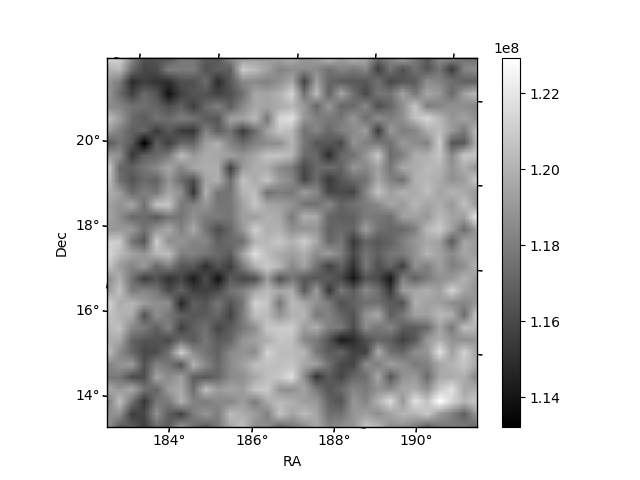
Histogram calculated using DETX and DETY for each event in the final _common_clean file
| Quadrant A | 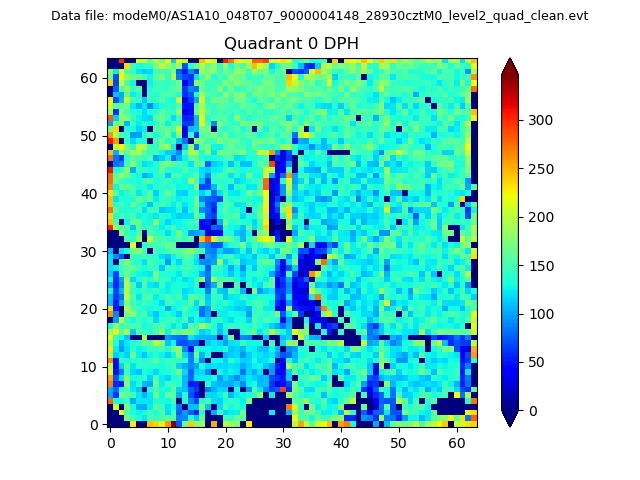 |
 |
Quadrant B |
|---|---|---|---|
| Quadrant D | 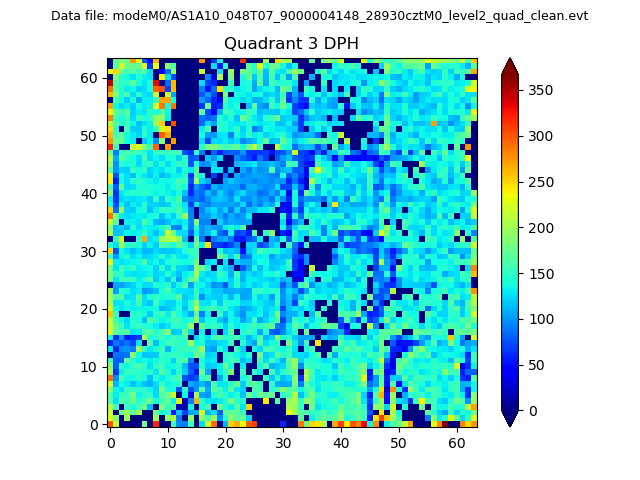 |
 |
Quadrant C |
| Plot type | Count rate plots | Images |
|---|---|---|
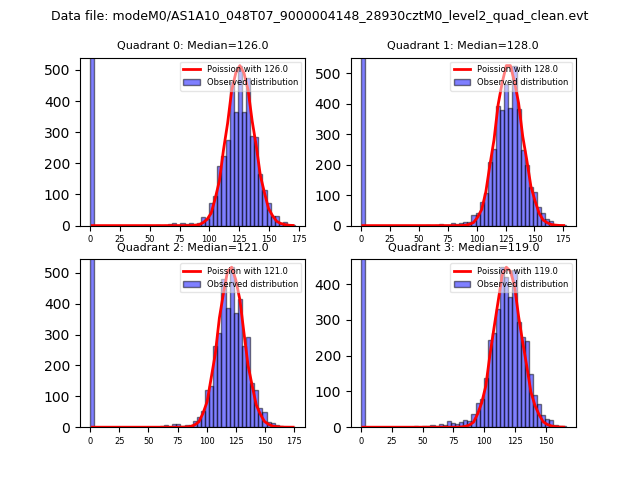
| Comparison with Poisson distribution Blue bars denote a histogram of data divided into 1 sec bins. Red curve is a Poisson curve with rate = median count rate of data. |
 |
 |
| Quadrant-wise count rates Data is divided into 100 sec bins |
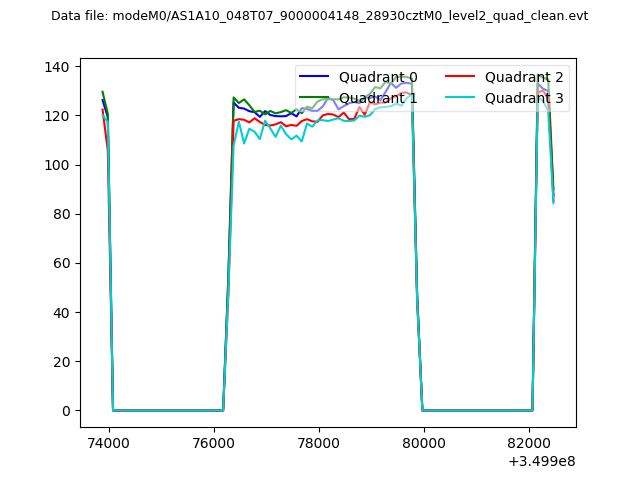 |
|
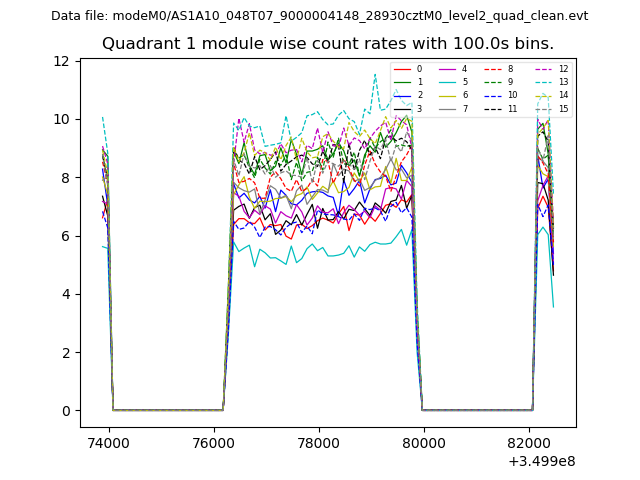
| Module-wise count rates for Quadrant A Data is divided into 100 sec bins |
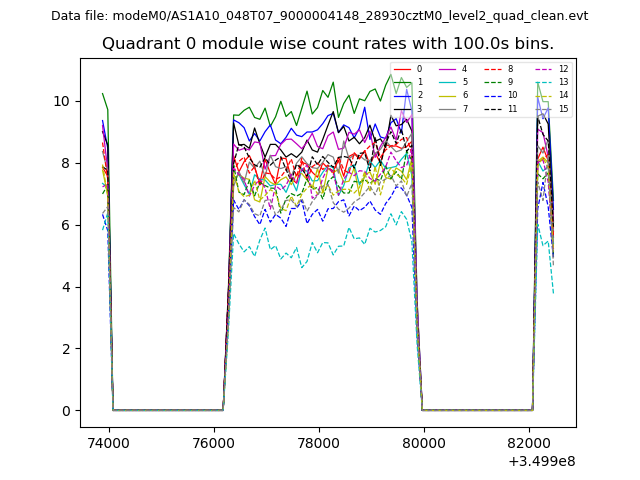 |
 |
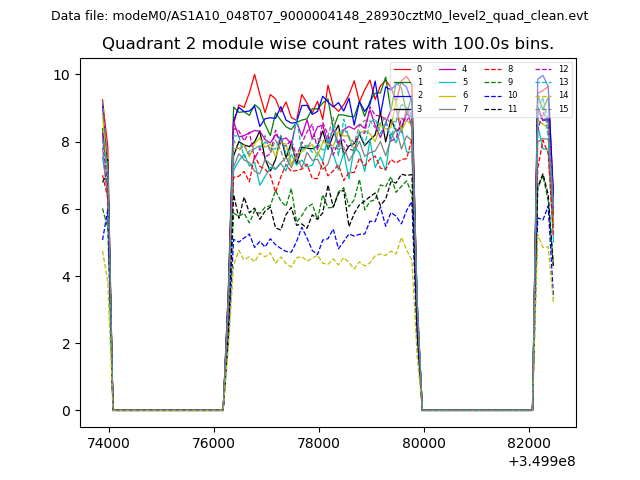
| Module-wise count rates for Quadrant B Data is divided into 100 sec bins |
 |
 |
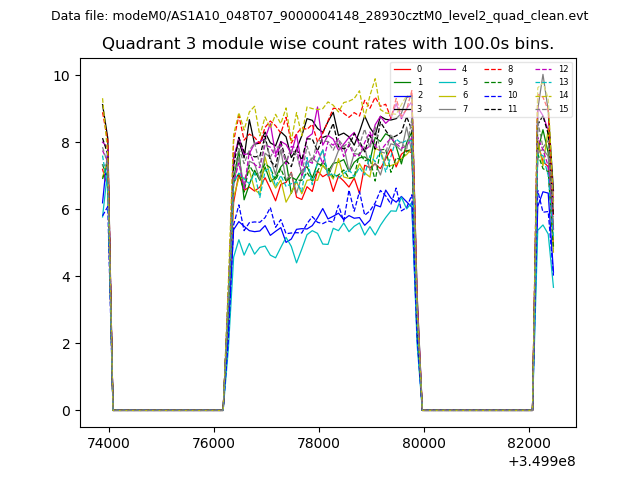
| Module-wise count rates for Quadrant C Data is divided into 100 sec bins |
 |
 |
| Module-wise count rates for Quadrant D Data is divided into 100 sec bins |
 |
 |
| Parameter | Plot |
|---|---|
| CZT HV Monitor | 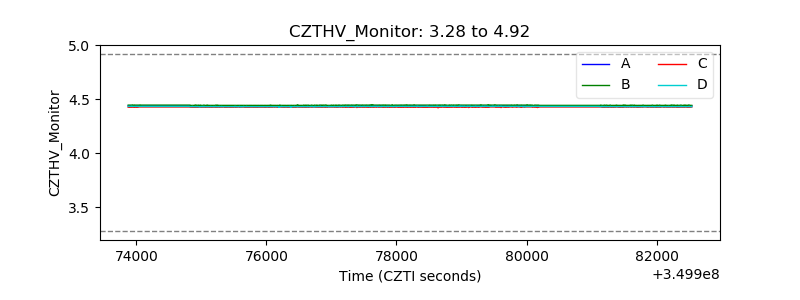 |
| D_VDD | 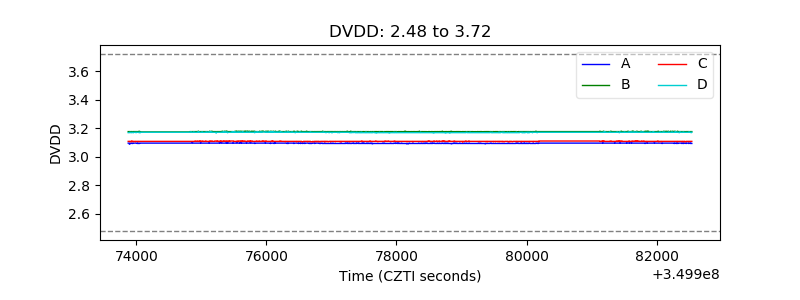 |
| Temperature 1 | 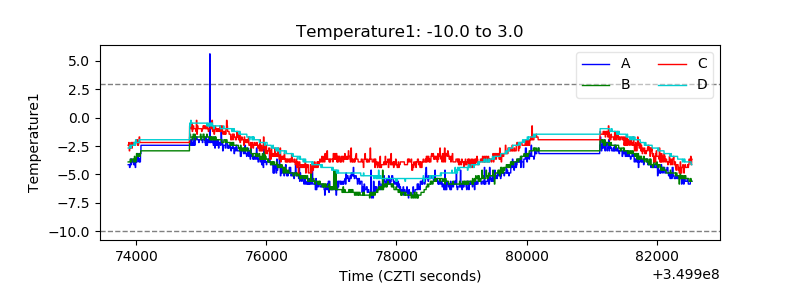 |
| Veto HV Monitor | 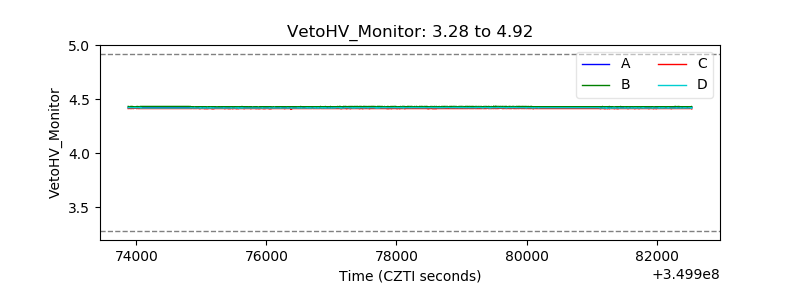 |
| Veto LLD | 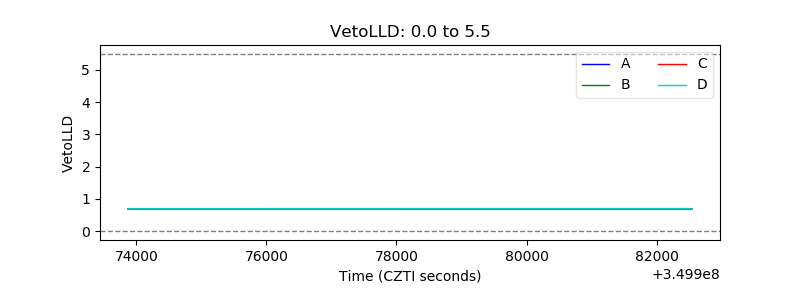 |
| Alpha Counter | 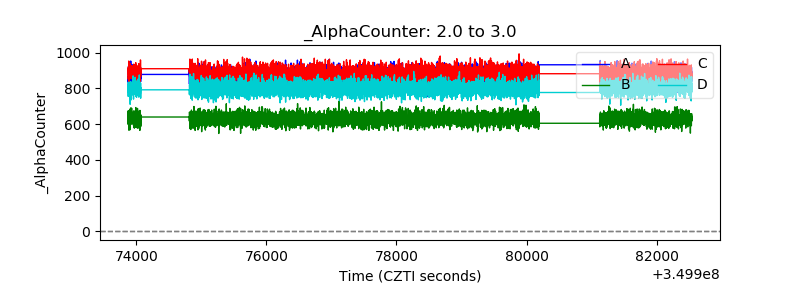 |
| _CPM_Rate | 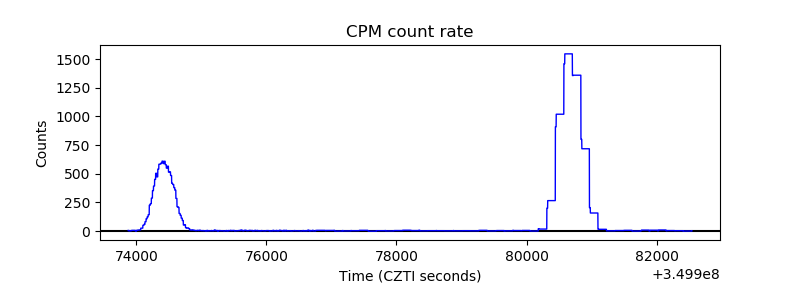 |
| CZT Counter | 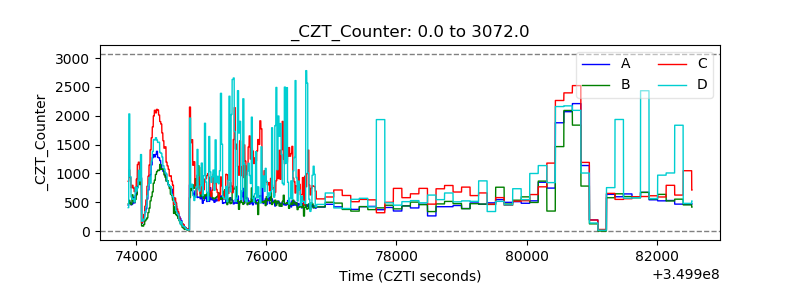 |
| +2.5 Volts monitor |  |
| +5 Volts monitor |  |
| _ROLL_ROT | 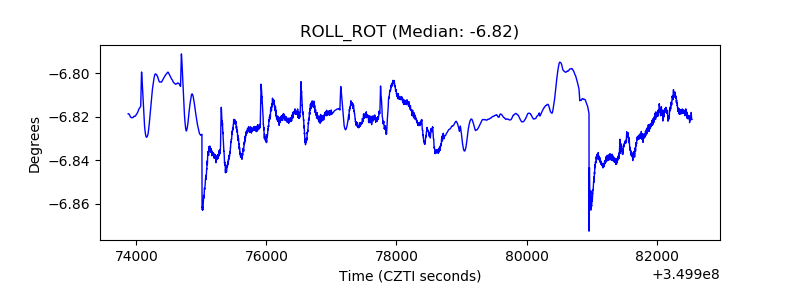 |
| _Roll_DEC | 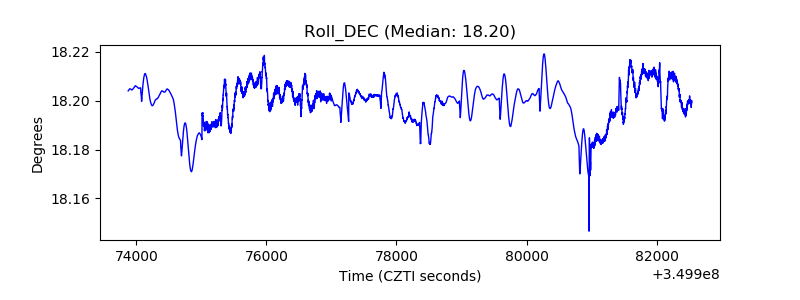 |
| _Roll_RA | 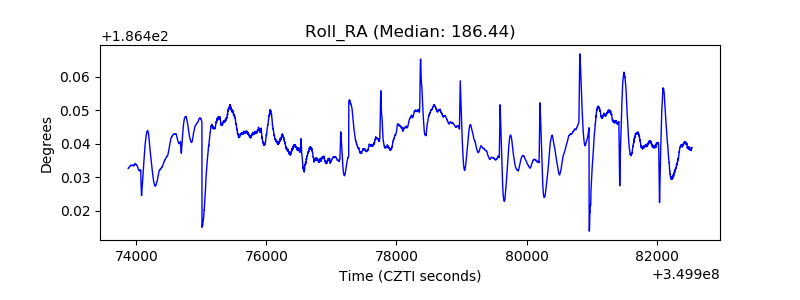 |
| Veto Counter | 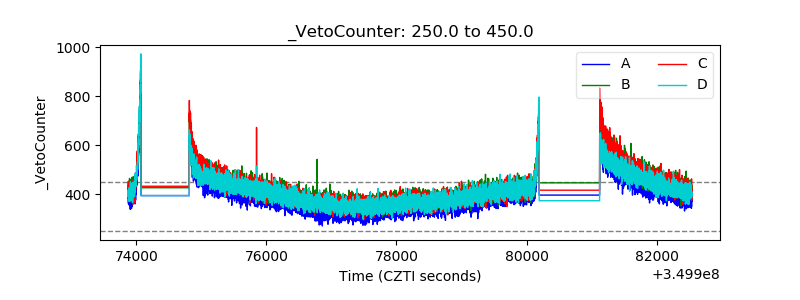 |