| Param | Original file | Final file |
|---|---|---|
| Filename | modeM0/AS1A10_048T07_9000004148_28933cztM0_level2.evt | modeM0/AS1A10_048T07_9000004148_28933cztM0_level2_quad_clean.evt |
| Size (bytes) | 476,804,160 | 98,953,920 |
| Size | 454.7 MB | 94.4 MB |
| Events in quadrant A | 3,167,010 | 643,483 |
| Events in quadrant B | 3,268,930 | 668,683 |
| Events in quadrant C | 3,434,772 | 631,649 |
| Events in quadrant D | 4,138,157 | 610,025 |
| Mode M0 | |||
|---|---|---|---|
| Quadrant | BADHDUFLAG | Total packets | Discarded packets |
| A | 0 | 13589 | 2 |
| B | 0 | 13861 | 2 |
| C | 0 | 14361 | 2 |
| D | 0 | 16599 | 2 |
| Mode M9 | |||
|---|---|---|---|
| Quadrant | BADHDUFLAG | Total packets | Discarded packets |
| A | 0 | 19 | 0 |
| B | 0 | 20 | 0 |
| C | 0 | 20 | 0 |
| D | 0 | 20 | 0 |
| Mode SS | |||
|---|---|---|---|
| Quadrant | BADHDUFLAG | Total packets | Discarded packets |
| A | 0 | 128 | 0 |
| B | 0 | 128 | 0 |
| C | 0 | 128 | 0 |
| D | 0 | 128 | 0 |
| Quadrant | Total seconds | Saturated seconds | Saturation percentage |
|---|---|---|---|
| A | 6353 | 31 | 0.487958% |
| B | 6353 | 43 | 0.676846% |
| C | 6353 | 181 | 2.849048% |
| D | 6353 | 144 | 2.266646% |
Noise dominated data is calculated using 1-second bins in cleaned event files. If a bin has >2000 counts, and if more than 50% of those come from <1% of pixels, then it is considered to be noise-dominated and hence unusable.
| Quadrant | # 1 sec bins | Bins with >0 counts | Bins with >2000 counts | High rate bins dominated by noise | Noise dominated (total time) | Noise dominated (detector-on time) | Marked lightcurve |
|---|---|---|---|---|---|---|---|
| A | 7543 | 6353 | 0 | 0 | 0.00% | 0.00% | 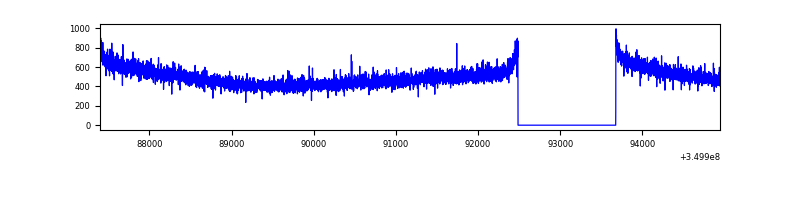 |
| B | 7543 | 6353 | 0 | 0 | 0.00% | 0.00% | 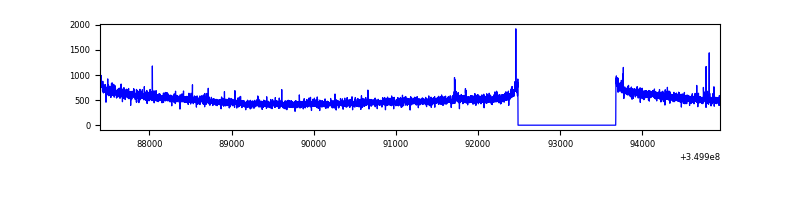 |
| C | 7543 | 6353 | 1 | 1 | 0.01% | 0.02% | 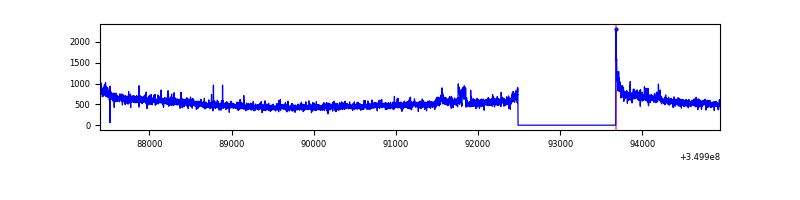 |
| D | 7543 | 6353 | 116 | 116 | 1.54% | 1.83% | 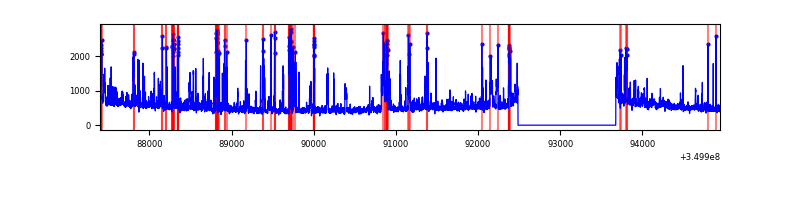 |
Top three noisy pixels from each quadrant. If the there are fewer than three noisy pixels in the level2.evt file, extra rows are filled as -1
| Pixel properties | Quadrant properties | ||||||
|---|---|---|---|---|---|---|---|
| Quadrant | DetID | PixID | Counts | Sigma | Mean | Median | Sigma |
| A | 13 | 254 | 11292 | 63.74 | 820 | 802 | 164.6 |
| A | 3 | 137 | 7857 | 42.87 | 820 | 802 | 164.6 |
| A | 0 | 226 | 7068 | 38.07 | 820 | 802 | 164.6 |
| B | 12 | 111 | 19147 | 116.63 | 825 | 806 | 157.3 |
| B | 11 | 111 | 17353 | 105.22 | 825 | 806 | 157.3 |
| B | 10 | 245 | 16721 | 101.21 | 825 | 806 | 157.3 |
| C | 14 | 238 | 152934 | 824.59 | 790 | 798 | 184.5 |
| C | 3 | 233 | 141767 | 764.07 | 790 | 798 | 184.5 |
| C | 14 | 254 | 34702 | 183.76 | 790 | 798 | 184.5 |
| D | 8 | 195 | 931769 | 4875.85 | 790 | 767 | 190.9 |
| D | 1 | 52 | 180022 | 938.8 | 790 | 767 | 190.9 |
| D | 12 | 233 | 29017 | 147.95 | 790 | 767 | 190.9 |
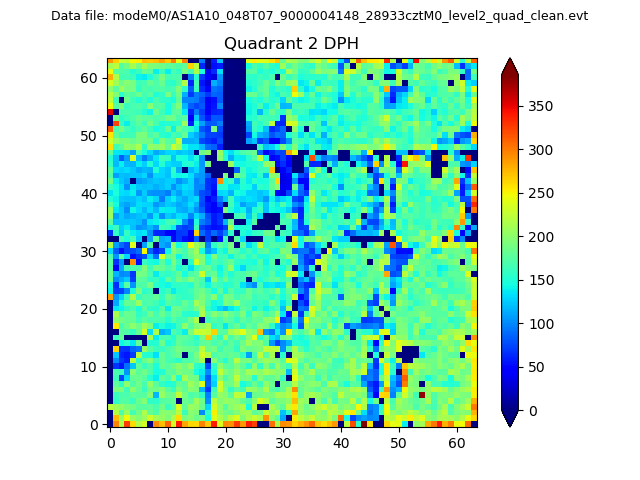
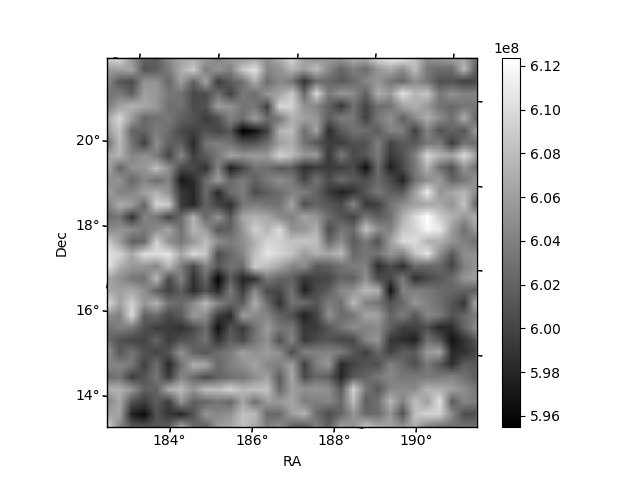
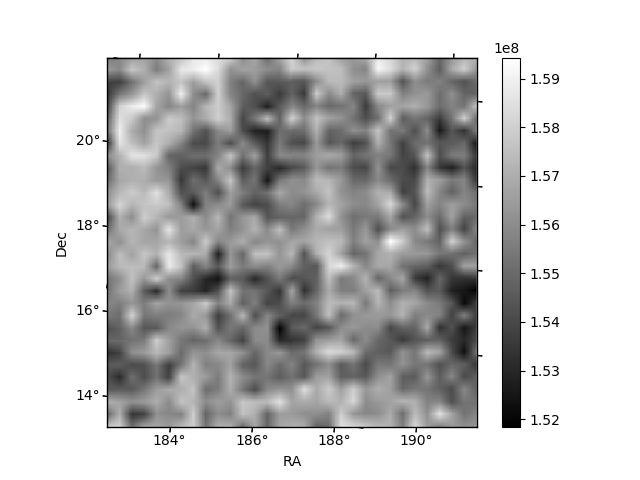
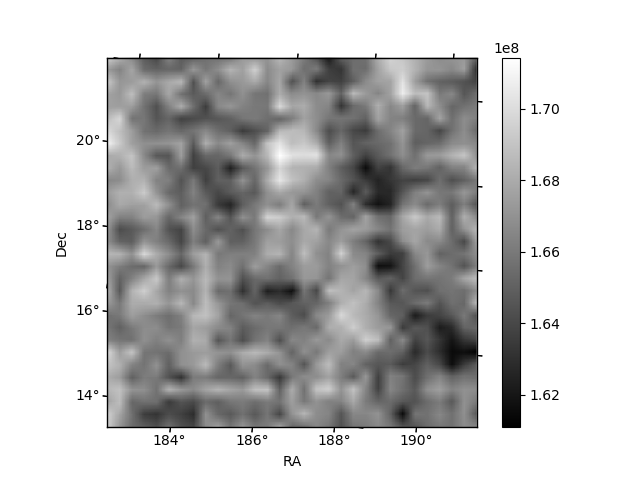
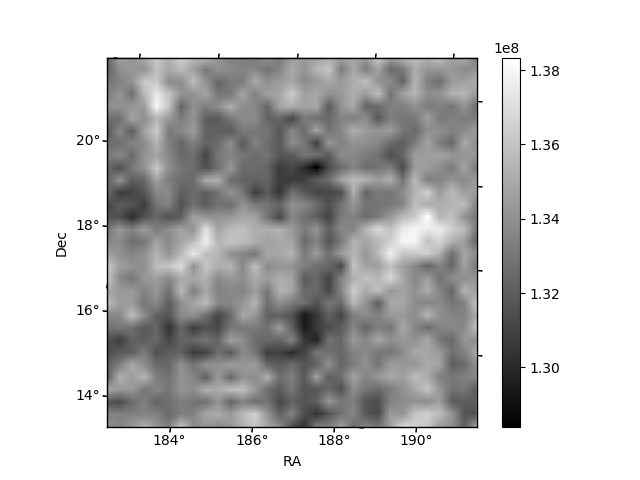
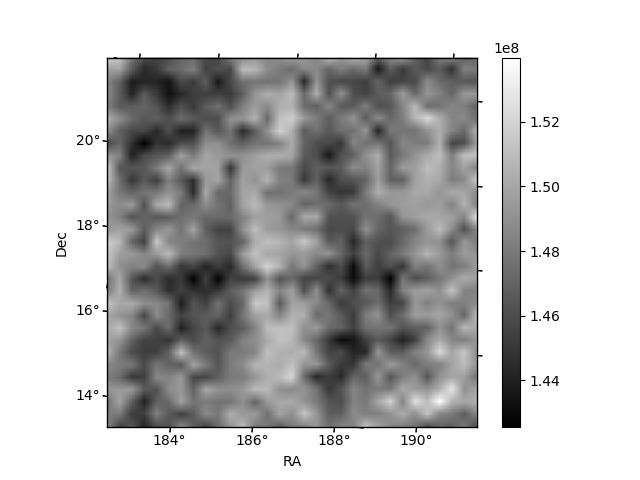
Histogram calculated using DETX and DETY for each event in the final _common_clean file
| Quadrant A | 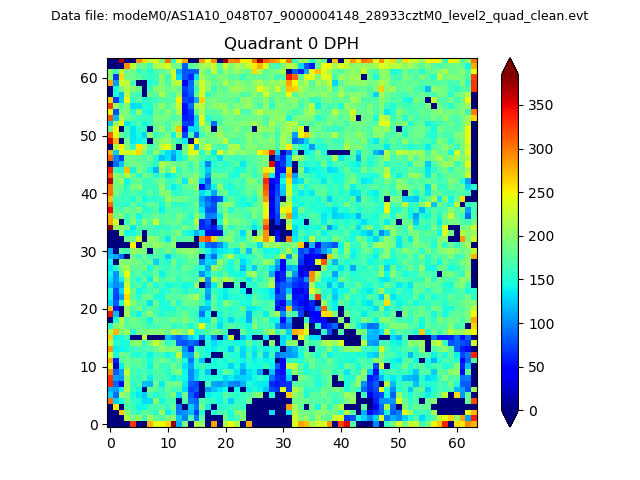 |
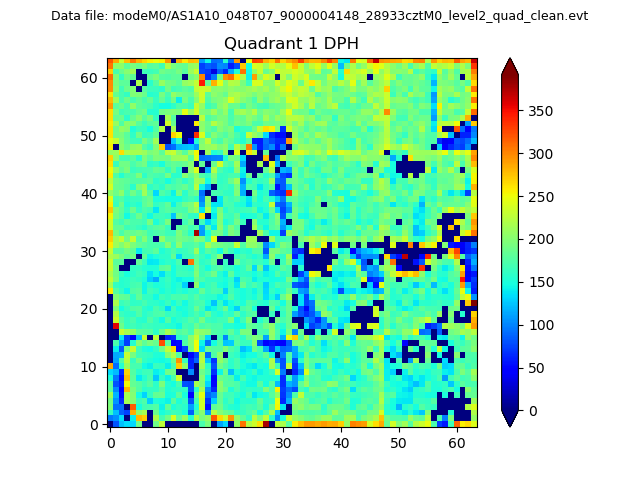 |
Quadrant B |
|---|---|---|---|
| Quadrant D | 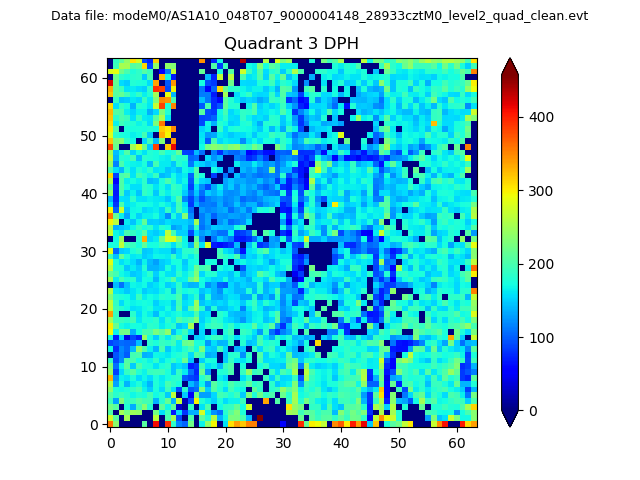 |
 |
Quadrant C |
| Plot type | Count rate plots | Images |
|---|---|---|
| Comparison with Poisson distribution Blue bars denote a histogram of data divided into 1 sec bins. Red curve is a Poisson curve with rate = median count rate of data. |
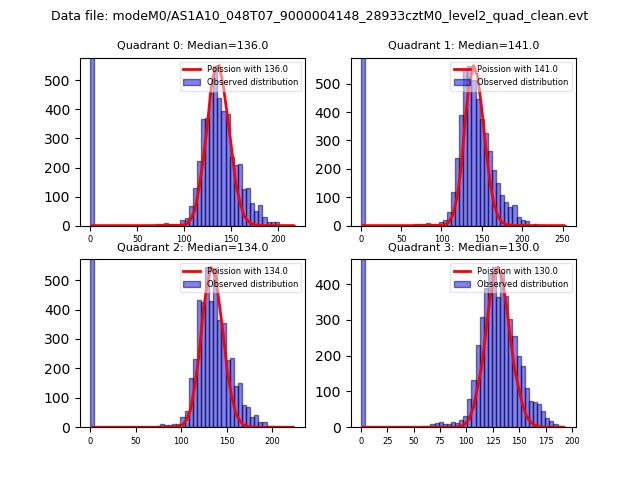 |
 |
| Quadrant-wise count rates Data is divided into 100 sec bins |
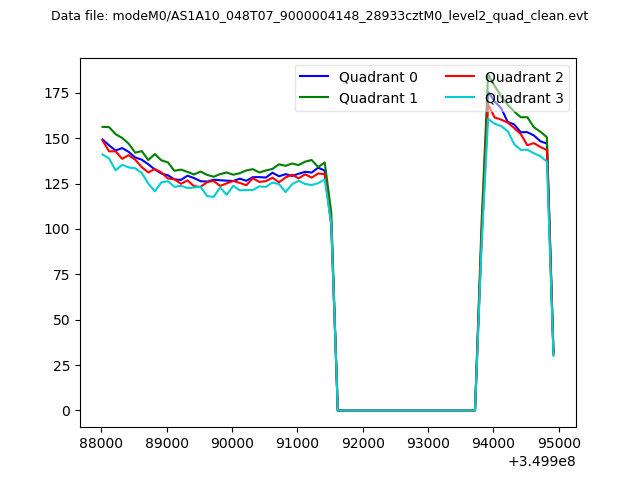 |
|
| Module-wise count rates for Quadrant A Data is divided into 100 sec bins |
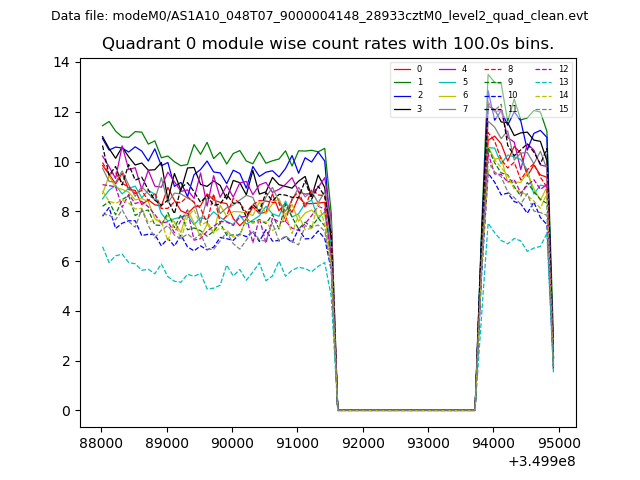 |
 |
| Module-wise count rates for Quadrant B Data is divided into 100 sec bins |
 |
 |
| Module-wise count rates for Quadrant C Data is divided into 100 sec bins |
 |
 |
| Module-wise count rates for Quadrant D Data is divided into 100 sec bins |
 |
 |
| Parameter | Plot |
|---|---|
| CZT HV Monitor | 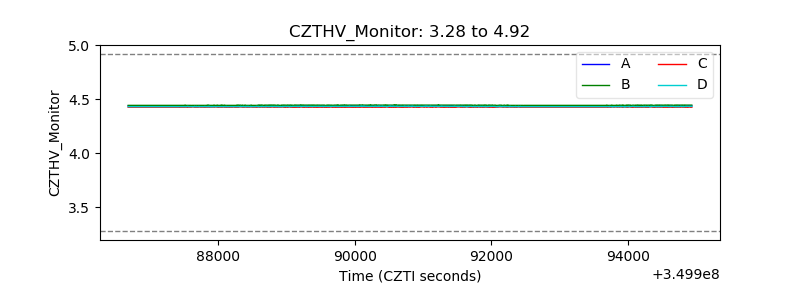 |
| D_VDD | 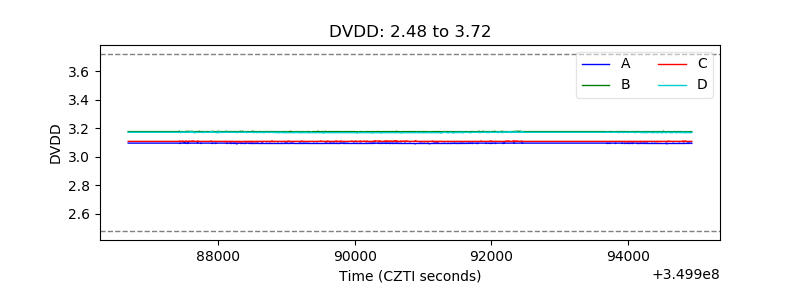 |
| Temperature 1 |  |
| Veto HV Monitor | 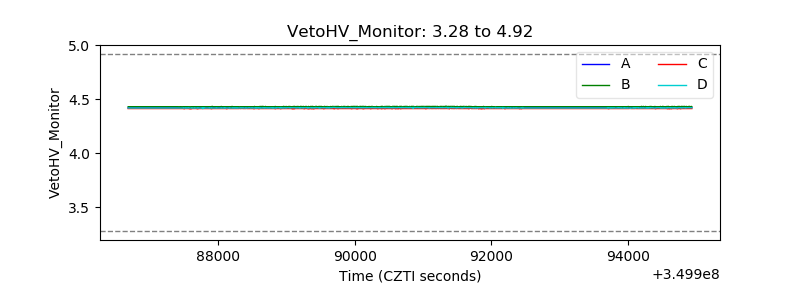 |
| Veto LLD |  |
| Alpha Counter | 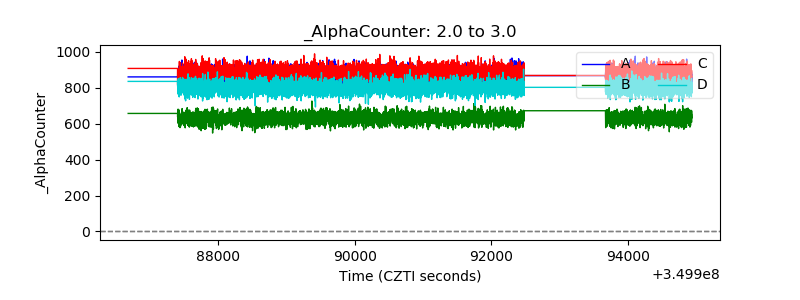 |
| _CPM_Rate | 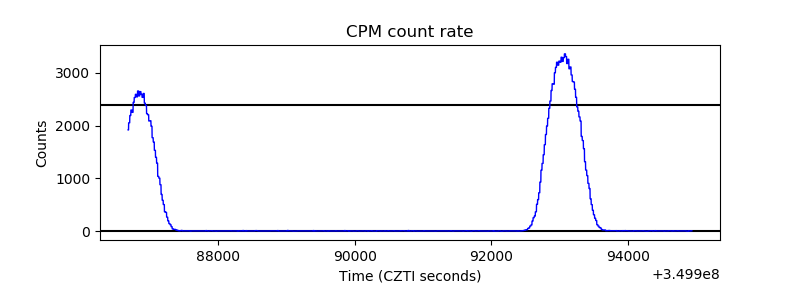 |
| CZT Counter | 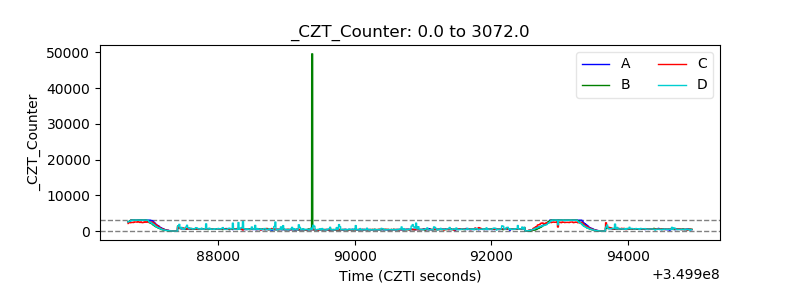 |
| +2.5 Volts monitor |  |
| +5 Volts monitor |  |
| _ROLL_ROT | 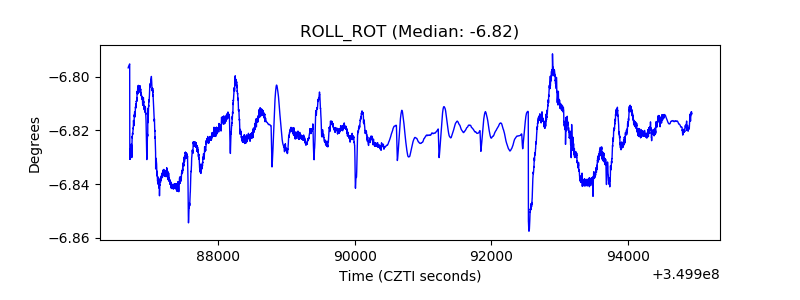 |
| _Roll_DEC | 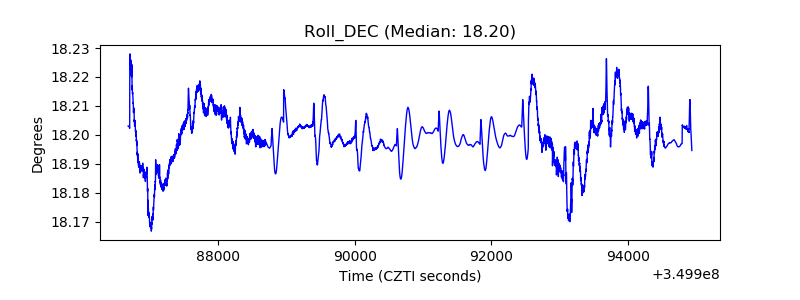 |
| _Roll_RA | 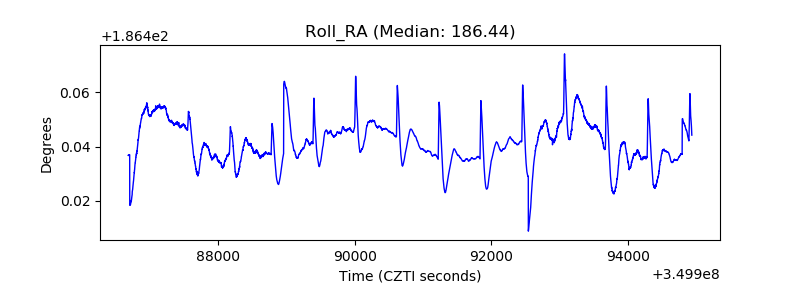 |
| Veto Counter | 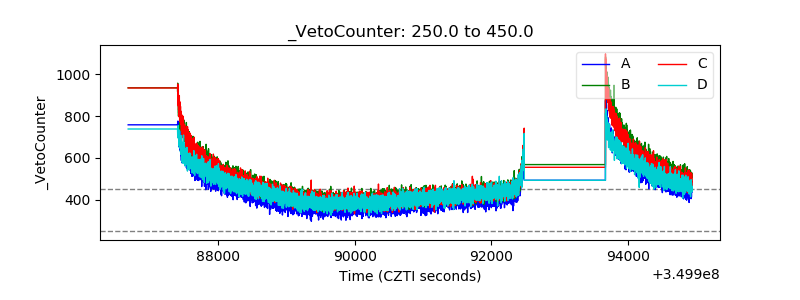 |