| Param | Original file | Final file |
|---|---|---|
| Filename | modeM0/AS1A10_048T07_9000004148_28934cztM0_level2.evt | modeM0/AS1A10_048T07_9000004148_28934cztM0_level2_quad_clean.evt |
| Size (bytes) | 142,479,360 | 37,906,560 |
| Size | 135.9 MB | 36.2 MB |
| Events in quadrant A | 980,150 | 255,533 |
| Events in quadrant B | 1,030,275 | 266,233 |
| Events in quadrant C | 1,084,333 | 248,552 |
| Events in quadrant D | 1,090,391 | 240,650 |
| Mode M0 | |||
|---|---|---|---|
| Quadrant | BADHDUFLAG | Total packets | Discarded packets |
| A | 0 | 4140 | 1 |
| B | 0 | 4289 | 1 |
| C | 0 | 4424 | 1 |
| D | 0 | 4517 | 1 |
| Mode M9 | |||
|---|---|---|---|
| Quadrant | BADHDUFLAG | Total packets | Discarded packets |
| A | 0 | 1 | 0 |
| B | 0 | 2 | 0 |
| C | 0 | 2 | 0 |
| D | 0 | 2 | 0 |
| Mode SS | |||
|---|---|---|---|
| Quadrant | BADHDUFLAG | Total packets | Discarded packets |
| A | 0 | 36 | 0 |
| B | 0 | 36 | 0 |
| C | 0 | 36 | 0 |
| D | 0 | 36 | 0 |
| Quadrant | Total seconds | Saturated seconds | Saturation percentage |
|---|---|---|---|
| A | 1877 | 3 | 0.159830% |
| B | 1877 | 12 | 0.639318% |
| C | 1877 | 58 | 3.090037% |
| D | 1877 | 21 | 1.118807% |
Noise dominated data is calculated using 1-second bins in cleaned event files. If a bin has >2000 counts, and if more than 50% of those come from <1% of pixels, then it is considered to be noise-dominated and hence unusable.
| Quadrant | # 1 sec bins | Bins with >0 counts | Bins with >2000 counts | High rate bins dominated by noise | Noise dominated (total time) | Noise dominated (detector-on time) | Marked lightcurve |
|---|---|---|---|---|---|---|---|
| A | 1876 | 1876 | 0 | 0 | 0.00% | 0.00% | 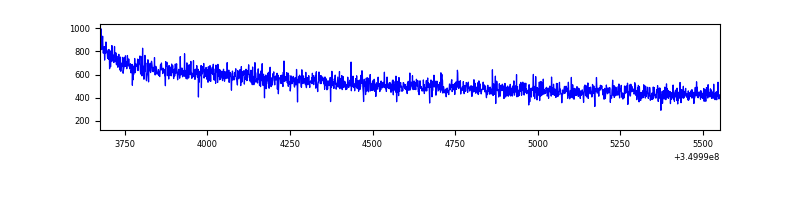 |
| B | 1876 | 1876 | 0 | 0 | 0.00% | 0.00% | 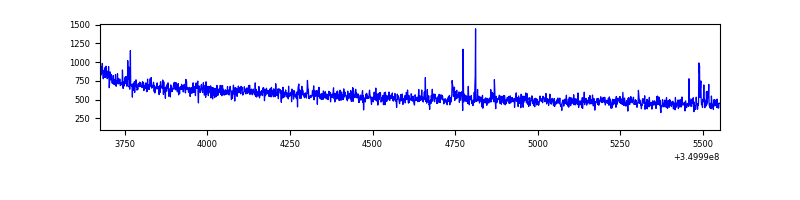 |
| C | 1876 | 1876 | 1 | 1 | 0.05% | 0.05% | 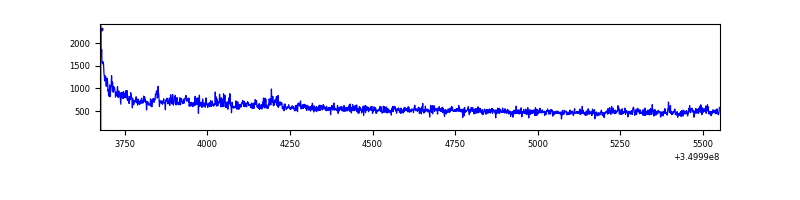 |
| D | 1876 | 1876 | 9 | 9 | 0.48% | 0.48% | 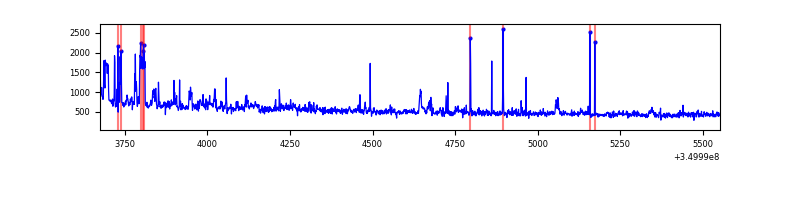 |
Top three noisy pixels from each quadrant. If the there are fewer than three noisy pixels in the level2.evt file, extra rows are filled as -1
| Pixel properties | Quadrant properties | ||||||
|---|---|---|---|---|---|---|---|
| Quadrant | DetID | PixID | Counts | Sigma | Mean | Median | Sigma |
| A | 13 | 254 | 3632 | 64.39 | 253 | 249 | 52.5 |
| A | 3 | 137 | 2344 | 39.88 | 253 | 249 | 52.5 |
| A | 0 | 226 | 2077 | 34.8 | 253 | 249 | 52.5 |
| B | 10 | 245 | 9541 | 183.5 | 259 | 254 | 50.6 |
| B | 12 | 111 | 5845 | 110.47 | 259 | 254 | 50.6 |
| B | 11 | 111 | 5174 | 97.21 | 259 | 254 | 50.6 |
| C | 3 | 233 | 66582 | 1123.75 | 246 | 247 | 59.0 |
| C | 14 | 238 | 45019 | 758.46 | 246 | 247 | 59.0 |
| C | 14 | 254 | 5683 | 92.09 | 246 | 247 | 59.0 |
| D | 8 | 195 | 102871 | 1727.83 | 241 | 235 | 59.4 |
| D | 1 | 52 | 50344 | 843.56 | 241 | 235 | 59.4 |
| D | 2 | 153 | 10763 | 177.23 | 241 | 235 | 59.4 |
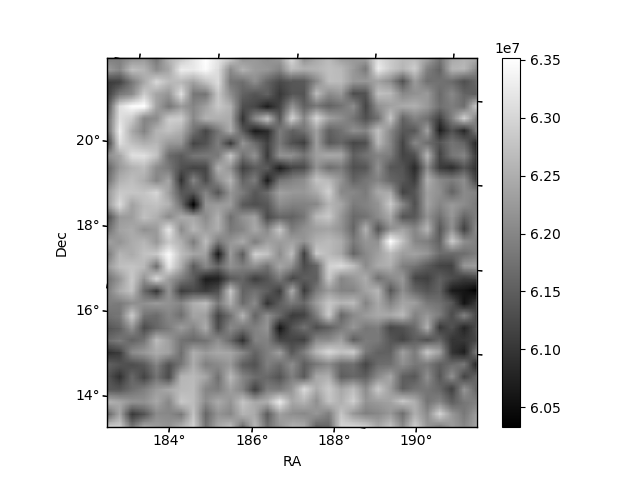
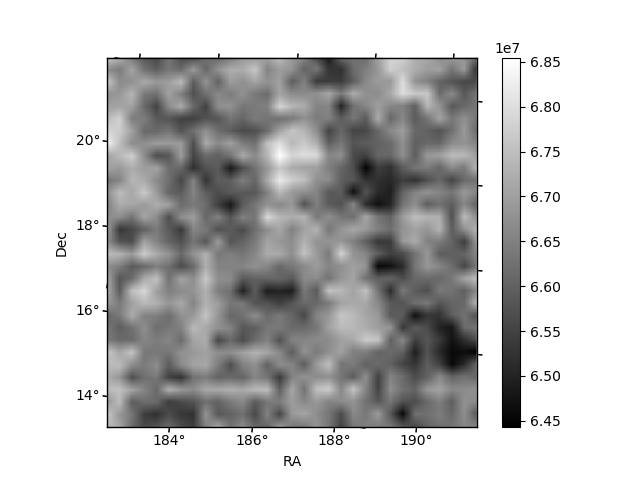
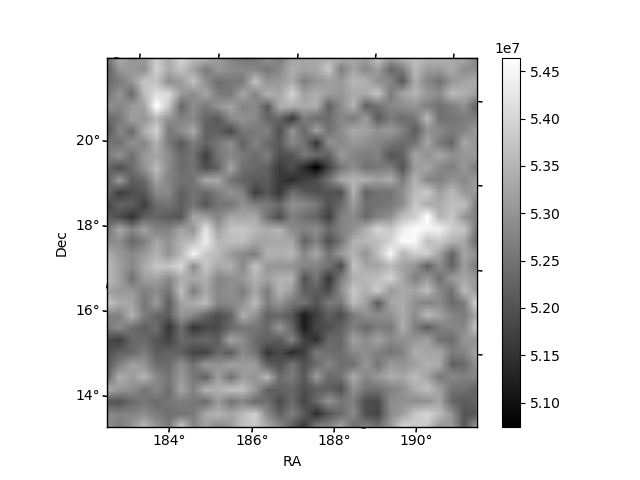
Histogram calculated using DETX and DETY for each event in the final _common_clean file
| Quadrant A |  |
 |
Quadrant B |
|---|---|---|---|
| Quadrant D |  |
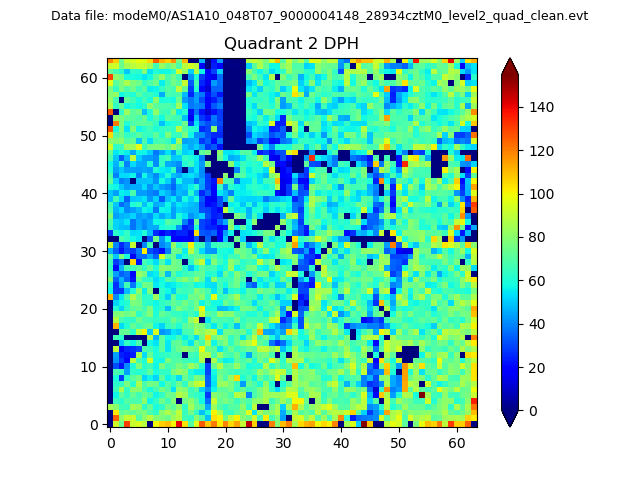 |
Quadrant C |
| Plot type | Count rate plots | Images |
|---|---|---|
| Comparison with Poisson distribution Blue bars denote a histogram of data divided into 1 sec bins. Red curve is a Poisson curve with rate = median count rate of data. |
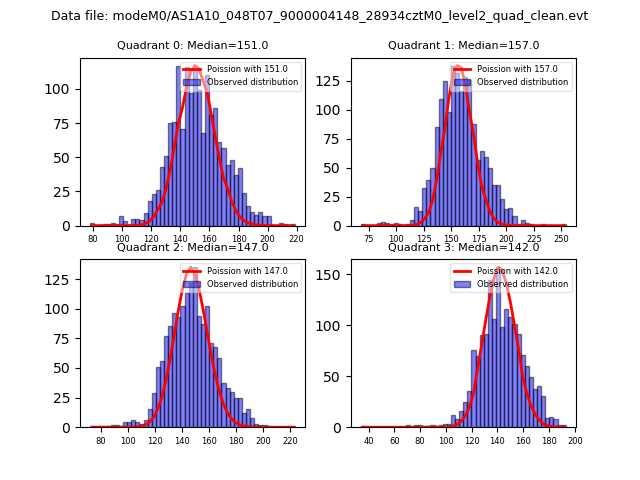 |
 |
| Quadrant-wise count rates Data is divided into 100 sec bins |
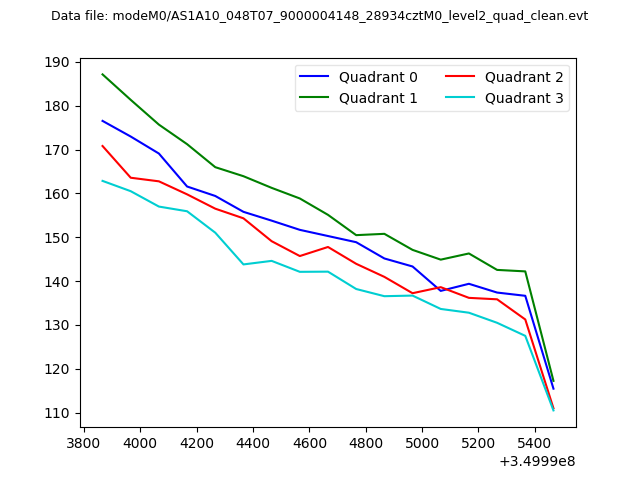 |
|
| Module-wise count rates for Quadrant A Data is divided into 100 sec bins |
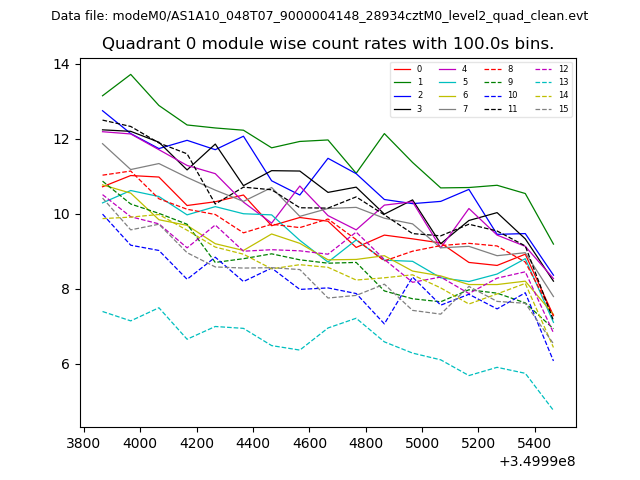 |
 |
| Module-wise count rates for Quadrant B Data is divided into 100 sec bins |
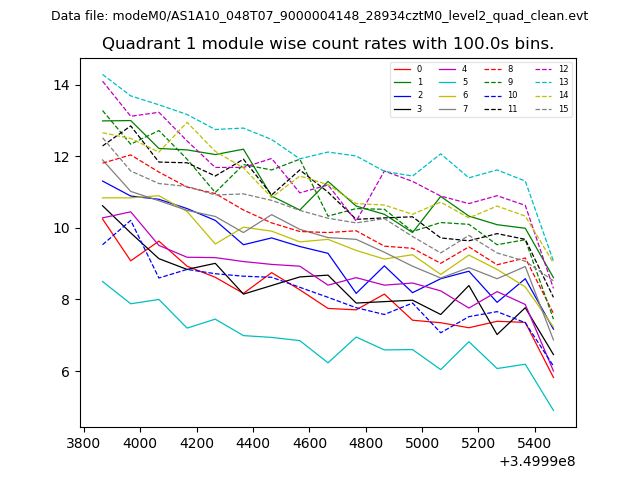 |
 |
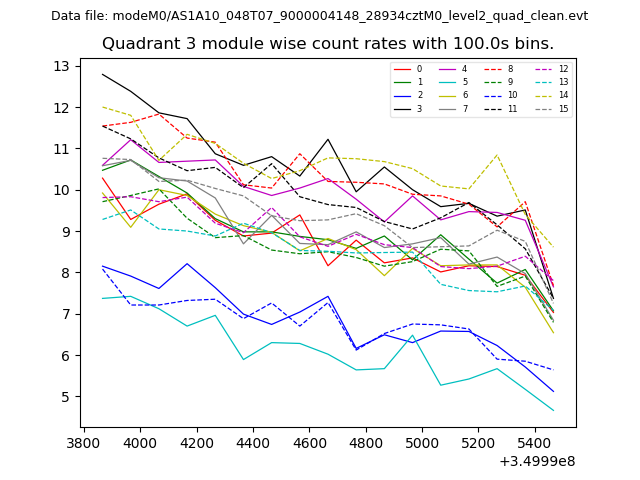
| Module-wise count rates for Quadrant C Data is divided into 100 sec bins |
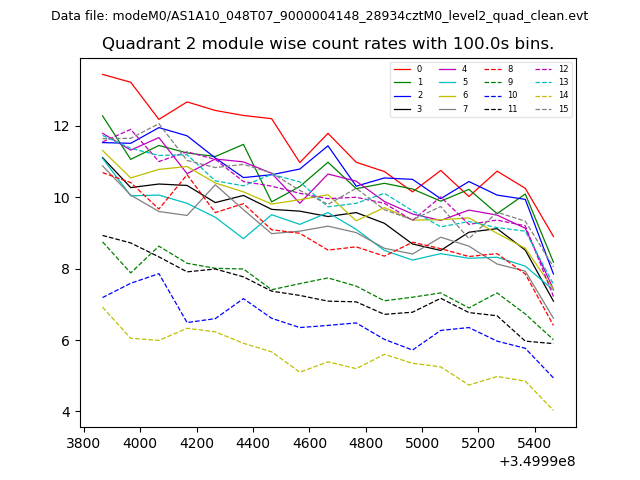 |
 |
| Module-wise count rates for Quadrant D Data is divided into 100 sec bins |
 |
 |
| Parameter | Plot |
|---|---|
| CZT HV Monitor |  |
| D_VDD | 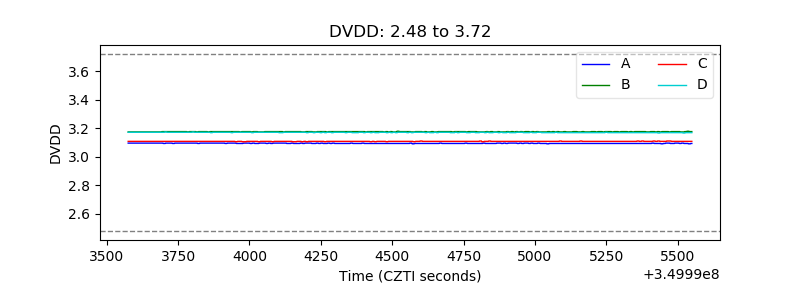 |
| Temperature 1 | 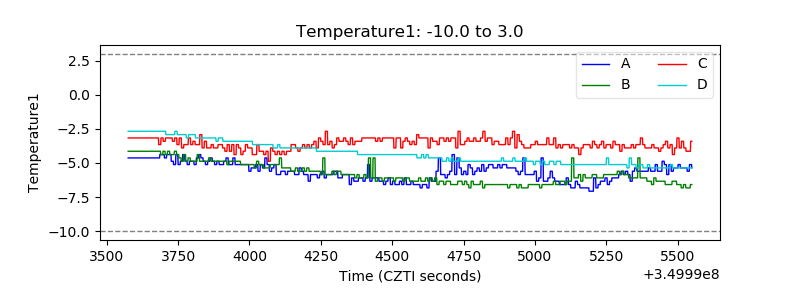 |
| Veto HV Monitor | 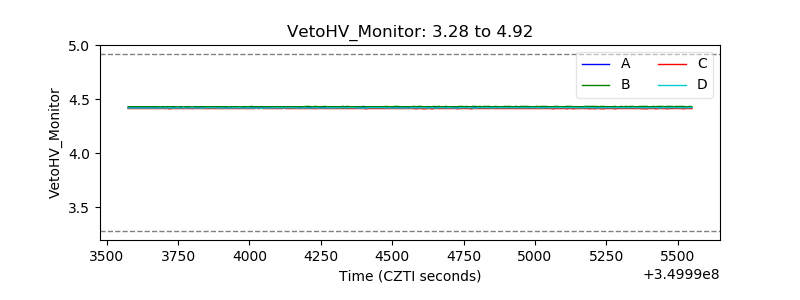 |
| Veto LLD | 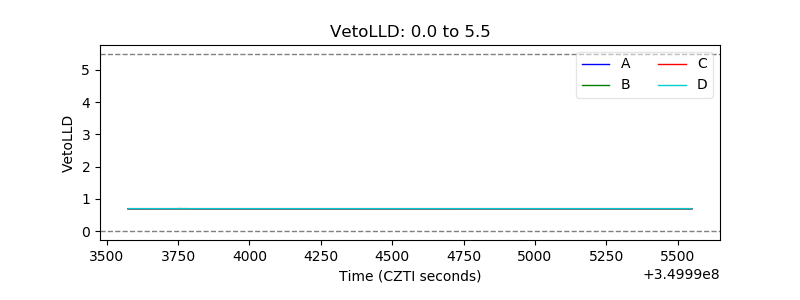 |
| Alpha Counter | 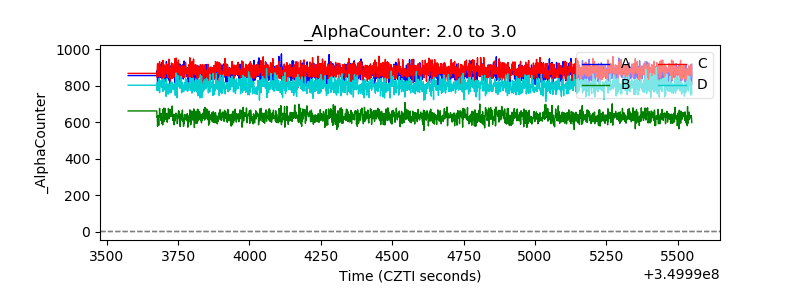 |
| _CPM_Rate | 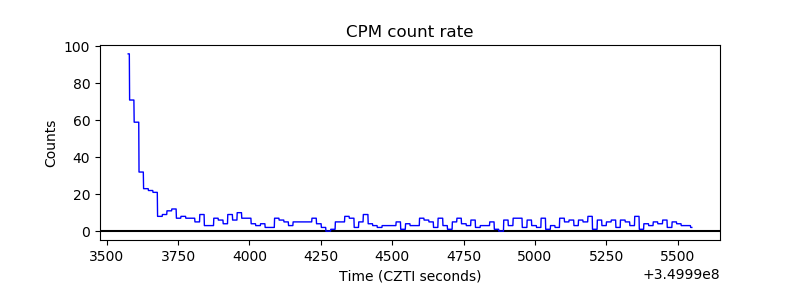 |
| CZT Counter | 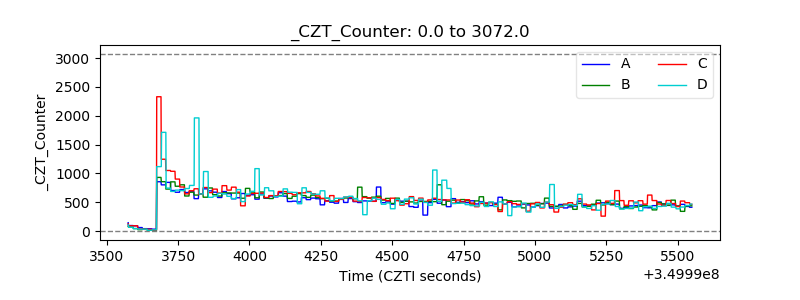 |
| +2.5 Volts monitor |  |
| +5 Volts monitor |  |
| _ROLL_ROT | 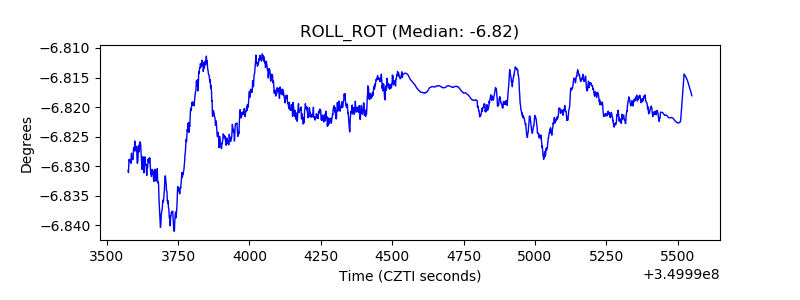 |
| _Roll_DEC | 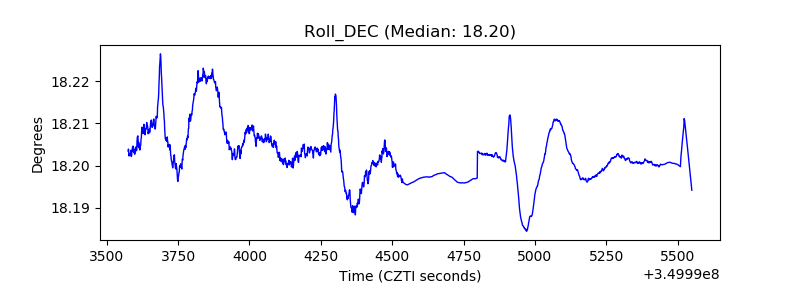 |
| _Roll_RA | 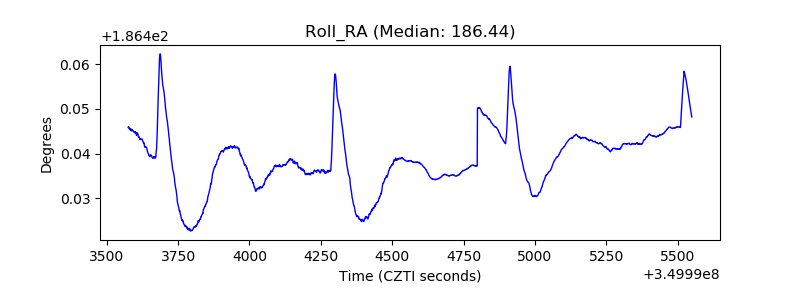 |
| Veto Counter | 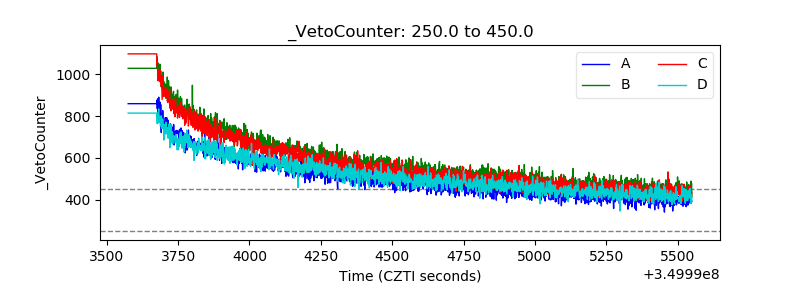 |