| Param | Original file | Final file |
|---|---|---|
| Filename | modeM0/AS1A10_064T02_9000004146cztM0_level2.fits | modeM0/AS1A10_064T02_9000004146cztM0_level2_quad_clean.evt |
| Size (bytes) | 335,664,000 | 329,837,760 |
| Size | 320.1 MB | 314.6 MB |
| Events in quadrant A | 2,102,026 | 2,070,165 |
| Events in quadrant B | 2,041,472 | 2,091,745 |
| Events in quadrant C | 1,973,110 | 1,904,623 |
| Events in quadrant D | 1,537,674 | 1,417,556 |
| Mode M9 | |||
|---|---|---|---|
| Quadrant | BADHDUFLAG | Total packets | Discarded packets |
| A | 0 | 41 | 0 |
| B | 0 | 41 | 0 |
| C | 0 | 41 | 0 |
| D | 0 | 41 | 0 |
| Mode M0 | |||
|---|---|---|---|
| Quadrant | BADHDUFLAG | Total packets | Discarded packets |
| A | 0 | 75826 | 0 |
| B | 0 | 75751 | 0 |
| C | 0 | 127969 | 0 |
| D | 0 | 165154 | 0 |
| Mode SS | |||
|---|---|---|---|
| Quadrant | BADHDUFLAG | Total packets | Discarded packets |
| A | 0 | 744 | 0 |
| B | 0 | 744 | 0 |
| C | 0 | 744 | 0 |
| D | 0 | 744 | 0 |
| Quadrant | Total seconds | Saturated seconds | Saturation percentage |
|---|---|---|---|
| A | 36470 | 511 | 1.401152% |
| B | 36470 | 598 | 1.639704% |
| C | 36469 | 3364 | 9.224273% |
| D | 36469 | 11530 | 31.615893% |
Noise dominated data is calculated using 1-second bins in cleaned event files. If a bin has >2000 counts, and if more than 50% of those come from <1% of pixels, then it is considered to be noise-dominated and hence unusable.
| Quadrant | # 1 sec bins | Bins with >0 counts | Bins with >2000 counts | High rate bins dominated by noise | Noise dominated (total time) | Noise dominated (detector-on time) | Marked lightcurve |
|---|---|---|---|---|---|---|---|
| A | 40550 | 36470 | 0 | 0 | 0.00% | 0.00% |  |
| B | 40550 | 36465 | 0 | 0 | 0.00% | 0.00% |  |
| C | 40549 | 36468 | 0 | 0 | 0.00% | 0.00% |  |
| D | 40550 | 36414 | 0 | 0 | 0.00% | 0.00% |  |
Top three noisy pixels from each quadrant. If the there are fewer than three noisy pixels in the level2.evt file, extra rows are filled as -1
| Pixel properties | Quadrant properties | ||||||
|---|---|---|---|---|---|---|---|
| Quadrant | DetID | PixID | Counts | Sigma | Mean | Median | Sigma |
| A | 0 | 29 | 1945 | 10.39 | 548 | 512 | 138.0 |
| A | 7 | 110 | 1769 | 9.11 | 548 | 512 | 138.0 |
| A | 9 | 19 | 1645 | 8.21 | 548 | 512 | 138.0 |
| B | 2 | 9 | 1622 | 10.23 | 538 | 512 | 108.5 |
| B | 14 | 254 | 1408 | 8.26 | 538 | 512 | 108.5 |
| B | 2 | 8 | 1396 | 8.15 | 538 | 512 | 108.5 |
| C | 12 | 241 | 1413 | 6.9 | 521 | 485 | 134.6 |
| C | 2 | 191 | 1343 | 6.38 | 521 | 485 | 134.6 |
| C | 3 | 158 | 1317 | 6.18 | 521 | 485 | 134.6 |
| D | 10 | 189 | 1111 | 6.05 | 438 | 399 | 117.7 |
| D | 15 | 46 | 1110 | 6.04 | 438 | 399 | 117.7 |
| D | 3 | 14 | 1103 | 5.98 | 438 | 399 | 117.7 |
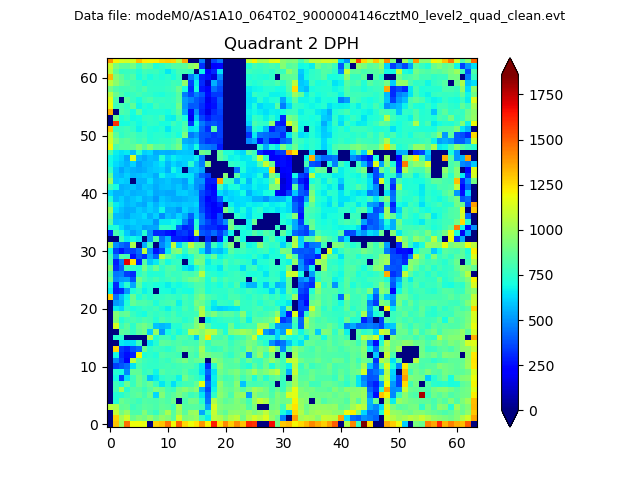
Histogram calculated using DETX and DETY for each event in the final _common_clean file
| Quadrant A | 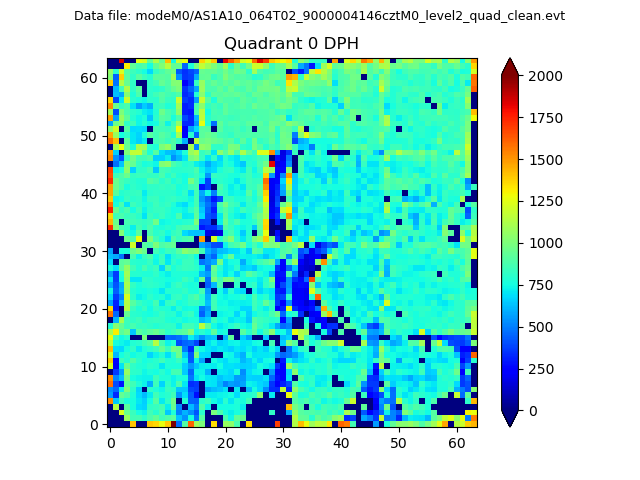 |
 |
Quadrant B |
|---|---|---|---|
| Quadrant D |  |
 |
Quadrant C |
| Plot type | Count rate plots | Images |
|---|---|---|
| Comparison with Poisson distribution Blue bars denote a histogram of data divided into 1 sec bins. Red curve is a Poisson curve with rate = median count rate of data. |
 |
 |
| Quadrant-wise count rates Data is divided into 100 sec bins |
 |
|
| Module-wise count rates for Quadrant A Data is divided into 100 sec bins |
 |
 |
| Module-wise count rates for Quadrant B Data is divided into 100 sec bins |
 |
 |
| Module-wise count rates for Quadrant C Data is divided into 100 sec bins |
 |
 |
| Module-wise count rates for Quadrant D Data is divided into 100 sec bins |
 |
 |
| Parameter | Plot |
|---|---|
| CZT HV Monitor |  |
| D_VDD | 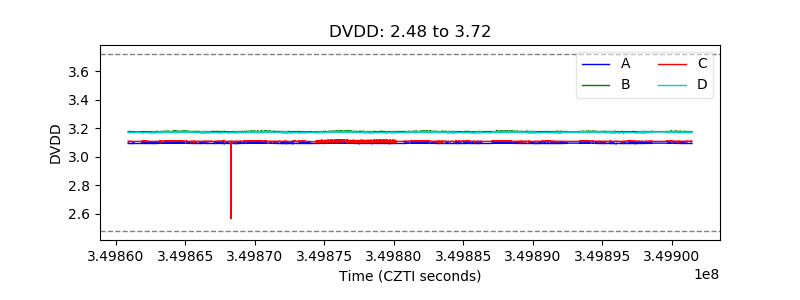 |
| Temperature 1 |  |
| Veto HV Monitor |  |
| Veto LLD |  |
| Alpha Counter |  |
| _CPM_Rate |  |
| CZT Counter |  |
| +2.5 Volts monitor |  |
| +5 Volts monitor |  |
| _ROLL_ROT |  |
| _Roll_DEC |  |
| _Roll_RA |  |
| Veto Counter |  |