| Param | Original file | Final file |
|---|---|---|
| Filename | modeM0/AS1A10_064T02_9000004146_28910cztM0_level2.evt | modeM0/AS1A10_064T02_9000004146_28910cztM0_level2_quad_clean.evt |
| Size (bytes) | 231,955,200 | 29,404,800 |
| Size | 221.2 MB | 28.0 MB |
| Events in quadrant A | 944,989 | 196,875 |
| Events in quadrant B | 950,862 | 204,298 |
| Events in quadrant C | 1,947,086 | 186,737 |
| Events in quadrant D | 3,052,314 | 164,729 |
| Mode M9 | |||
|---|---|---|---|
| Quadrant | BADHDUFLAG | Total packets | Discarded packets |
| A | 0 | 5 | 0 |
| B | 0 | 5 | 0 |
| C | 0 | 5 | 0 |
| D | 0 | 5 | 0 |
| Mode M0 | |||
|---|---|---|---|
| Quadrant | BADHDUFLAG | Total packets | Discarded packets |
| A | 0 | 4004 | 1 |
| B | 0 | 4016 | 1 |
| C | 0 | 7129 | 1 |
| D | 0 | 10344 | 8 |
| Mode SS | |||
|---|---|---|---|
| Quadrant | BADHDUFLAG | Total packets | Discarded packets |
| A | 0 | 38 | 0 |
| B | 0 | 38 | 0 |
| C | 0 | 38 | 0 |
| D | 0 | 38 | 0 |
| Quadrant | Total seconds | Saturated seconds | Saturation percentage |
|---|---|---|---|
| A | 1883 | 86 | 4.567180% |
| B | 1883 | 81 | 4.301646% |
| C | 1883 | 205 | 10.886883% |
| D | 1882 | 973 | 51.700319% |
Noise dominated data is calculated using 1-second bins in cleaned event files. If a bin has >2000 counts, and if more than 50% of those come from <1% of pixels, then it is considered to be noise-dominated and hence unusable.
| Quadrant | # 1 sec bins | Bins with >0 counts | Bins with >2000 counts | High rate bins dominated by noise | Noise dominated (total time) | Noise dominated (detector-on time) | Marked lightcurve |
|---|---|---|---|---|---|---|---|
| A | 2368 | 1884 | 0 | 0 | 0.00% | 0.00% | 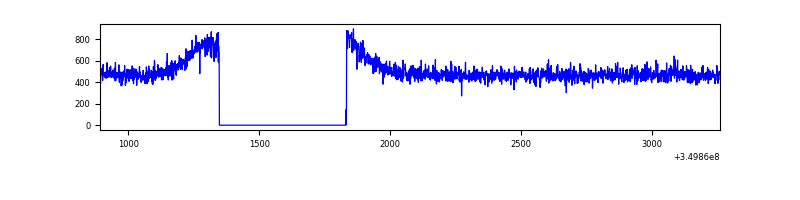 |
| B | 2368 | 1884 | 0 | 0 | 0.00% | 0.00% |  |
| C | 2368 | 1884 | 0 | 0 | 0.00% | 0.00% | 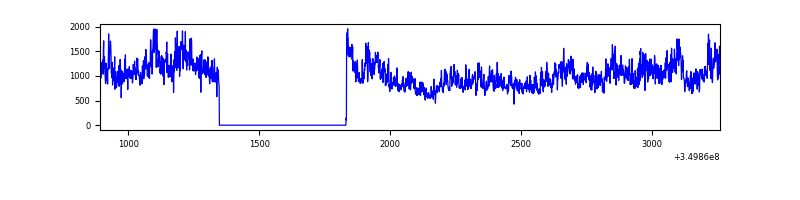 |
| D | 2367 | 1883 | 962 | 962 | 40.64% | 51.09% | 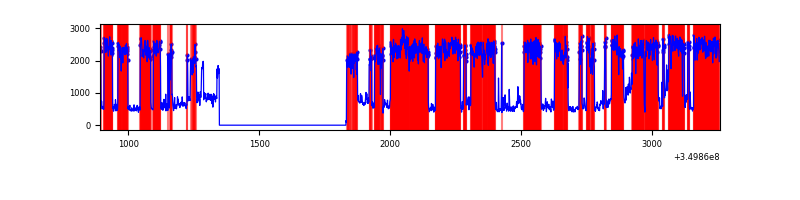 |
Top three noisy pixels from each quadrant. If the there are fewer than three noisy pixels in the level2.evt file, extra rows are filled as -1
| Pixel properties | Quadrant properties | ||||||
|---|---|---|---|---|---|---|---|
| Quadrant | DetID | PixID | Counts | Sigma | Mean | Median | Sigma |
| A | 13 | 6 | 3516 | 63.7 | 243 | 237 | 51.5 |
| A | 13 | 254 | 3117 | 55.95 | 243 | 237 | 51.5 |
| A | 14 | 235 | 2731 | 48.45 | 243 | 237 | 51.5 |
| B | 12 | 111 | 6079 | 119.53 | 239 | 232 | 48.9 |
| B | 11 | 111 | 5496 | 107.61 | 239 | 232 | 48.9 |
| B | 14 | 111 | 5253 | 102.64 | 239 | 232 | 48.9 |
| C | 3 | 233 | 1036441 | 19380.3 | 222 | 222 | 53.5 |
| C | 14 | 238 | 36254 | 673.9 | 222 | 222 | 53.5 |
| C | 2 | 114 | 4299 | 76.25 | 222 | 222 | 53.5 |
| D | 8 | 195 | 2057079 | 40015.62 | 206 | 199 | 51.4 |
| D | 1 | 52 | 181105 | 3519.44 | 206 | 199 | 51.4 |
| D | 12 | 79 | 33428 | 646.45 | 206 | 199 | 51.4 |
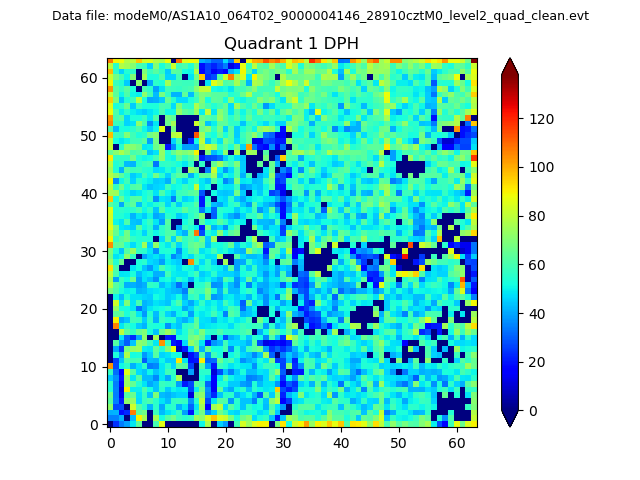
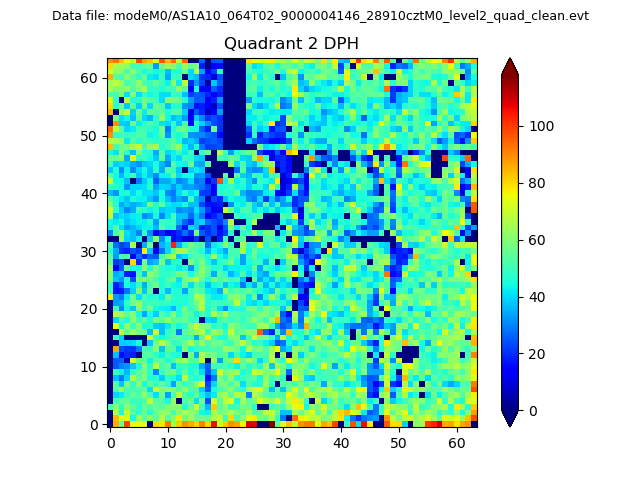
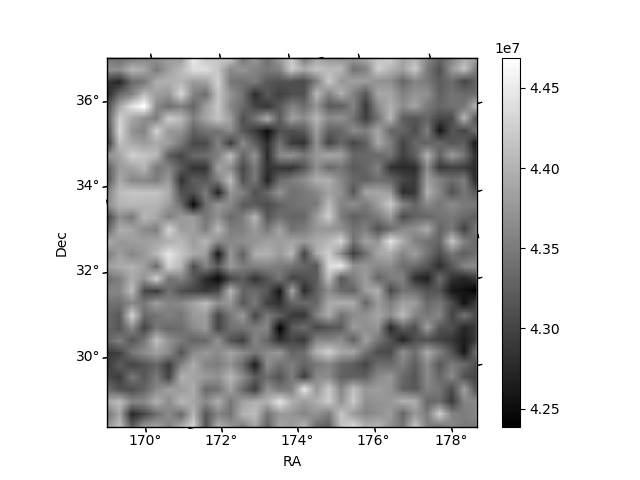
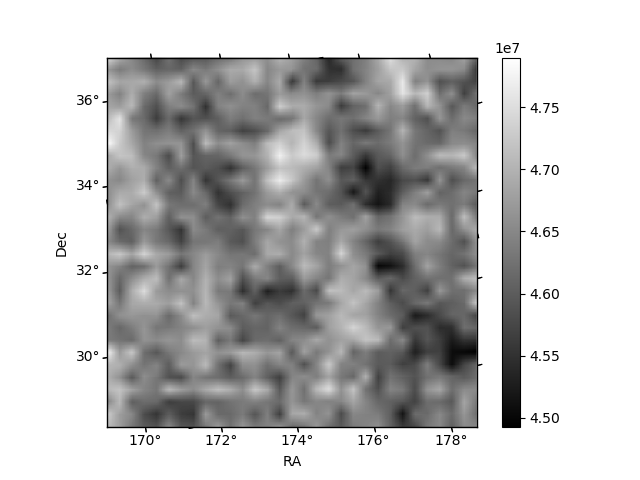
Histogram calculated using DETX and DETY for each event in the final _common_clean file
| Quadrant A | 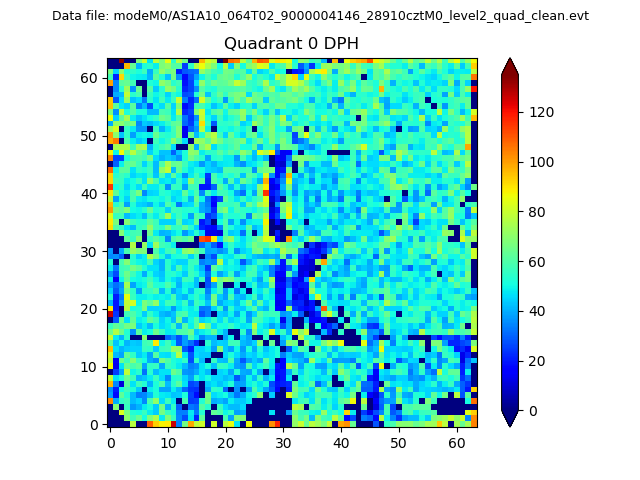 |
 |
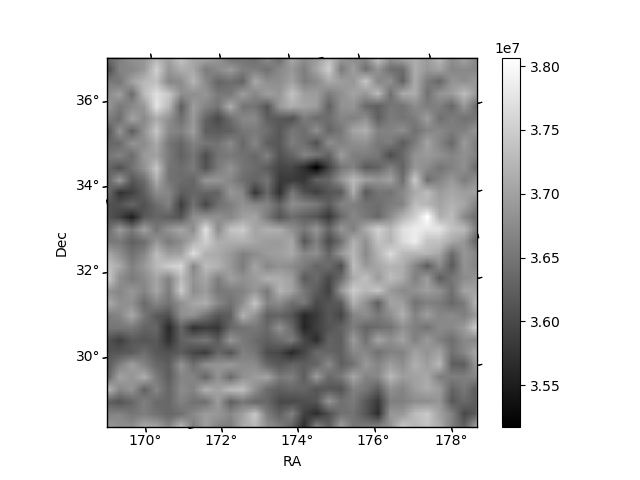
Quadrant B |
|---|---|---|---|
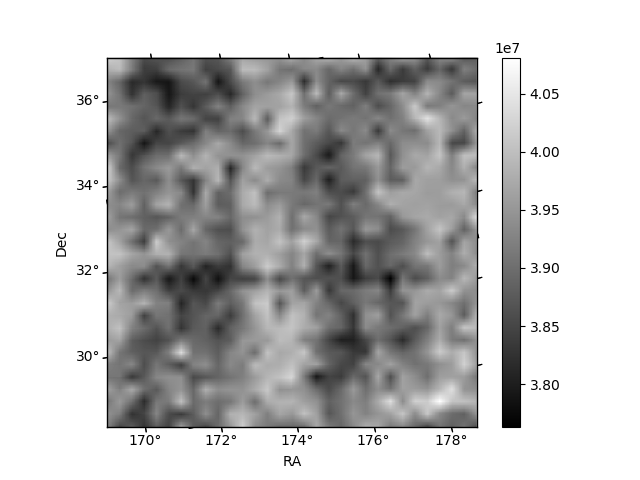
| Quadrant D | 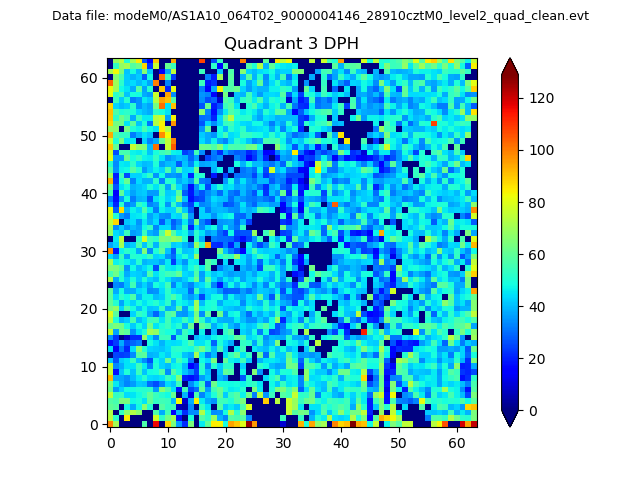 |
 |
Quadrant C |
| Plot type | Count rate plots | Images |
|---|---|---|
| Comparison with Poisson distribution Blue bars denote a histogram of data divided into 1 sec bins. Red curve is a Poisson curve with rate = median count rate of data. |
 |
 |
| Quadrant-wise count rates Data is divided into 100 sec bins |
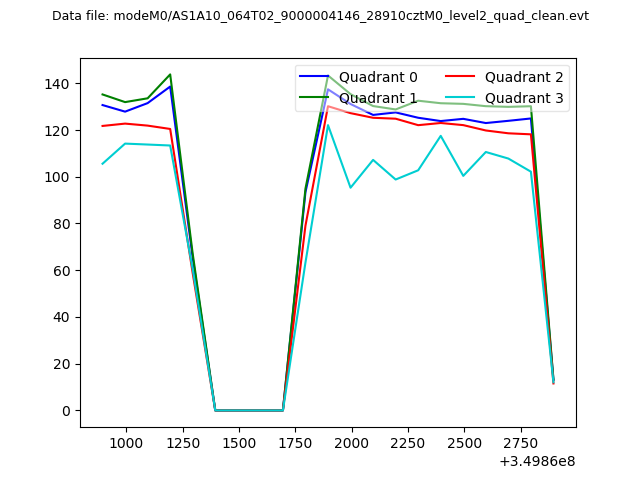 |
|
| Module-wise count rates for Quadrant A Data is divided into 100 sec bins |
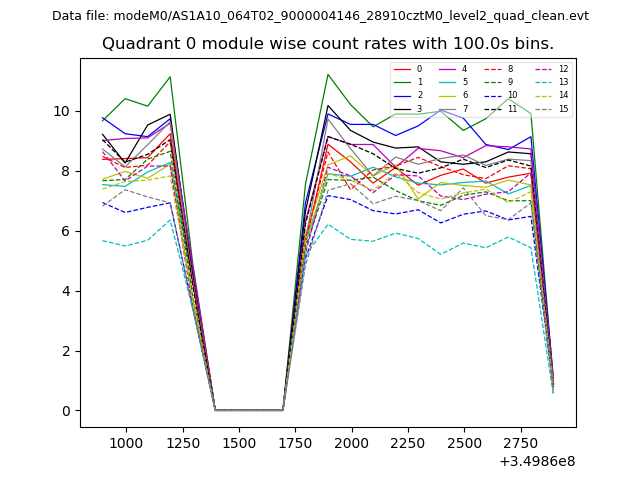 |
 |
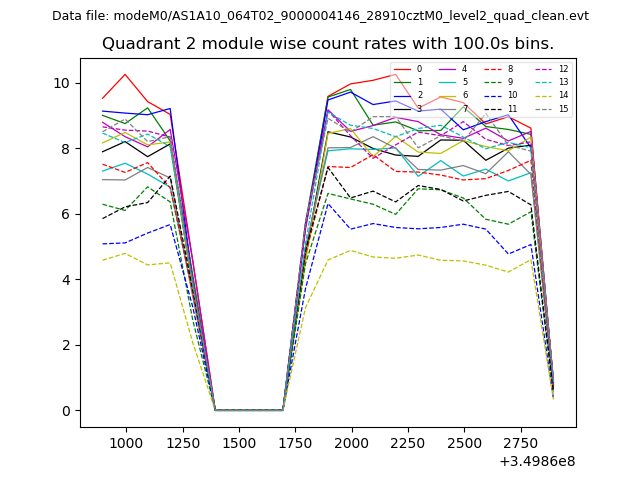
| Module-wise count rates for Quadrant B Data is divided into 100 sec bins |
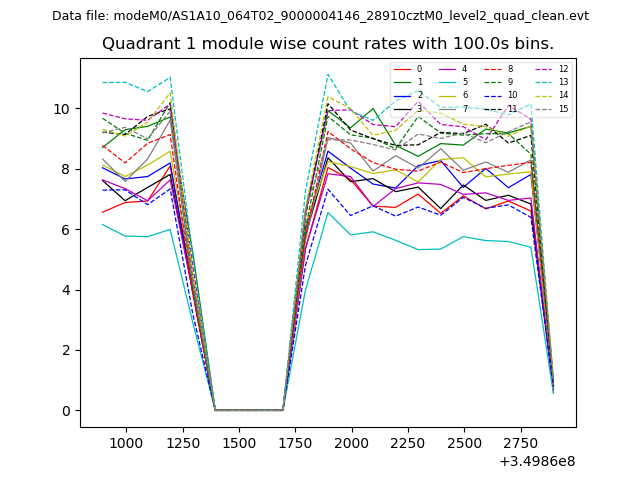 |
 |
| Module-wise count rates for Quadrant C Data is divided into 100 sec bins |
 |
 |
| Module-wise count rates for Quadrant D Data is divided into 100 sec bins |
 |
 |
| Parameter | Plot |
|---|---|
| CZT HV Monitor | 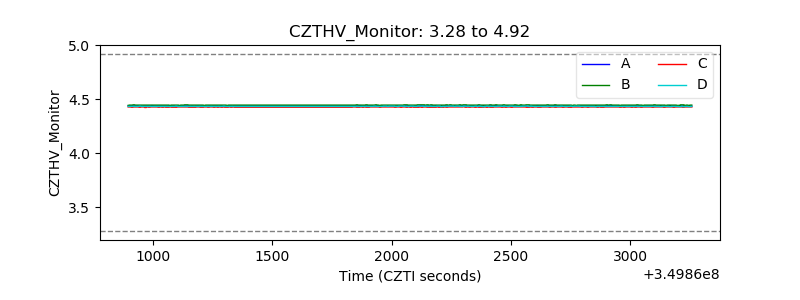 |
| D_VDD | 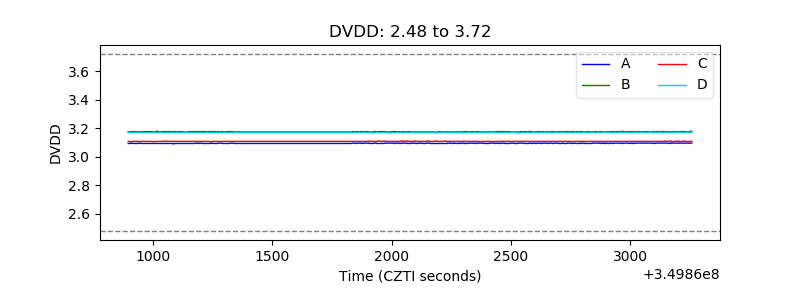 |
| Temperature 1 | 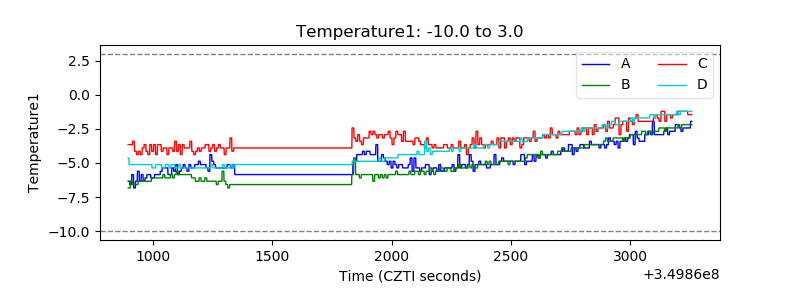 |
| Veto HV Monitor | 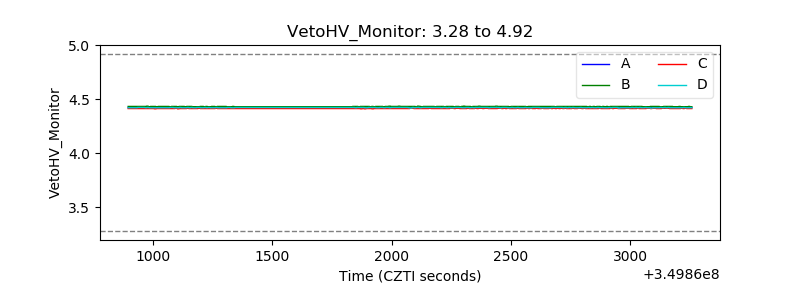 |
| Veto LLD | 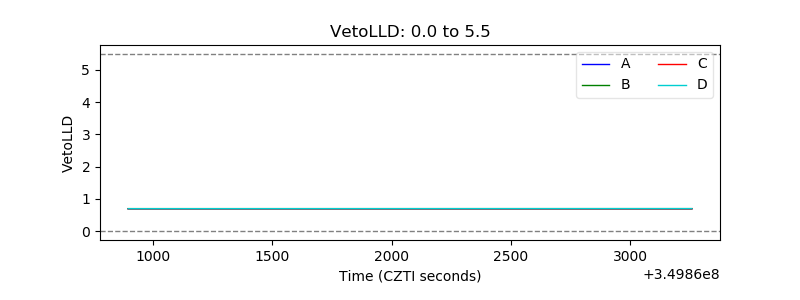 |
| Alpha Counter | 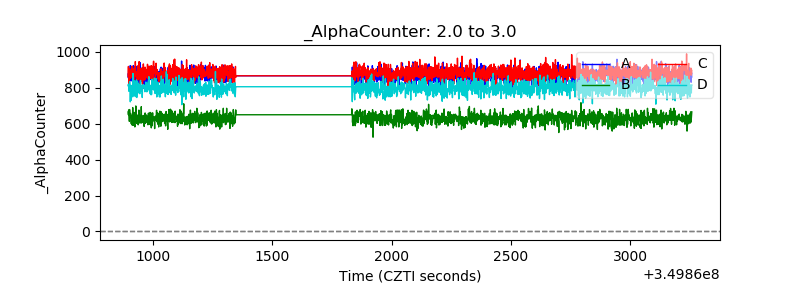 |
| _CPM_Rate | 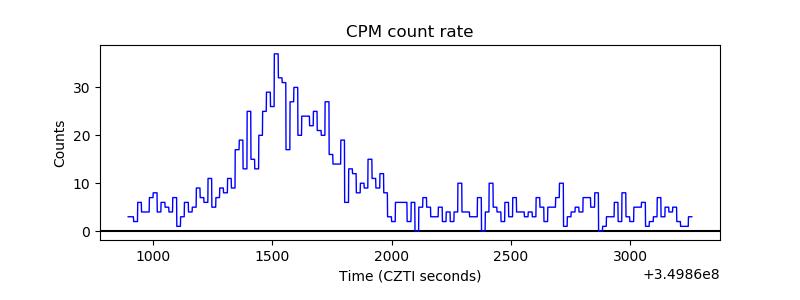 |
| CZT Counter | 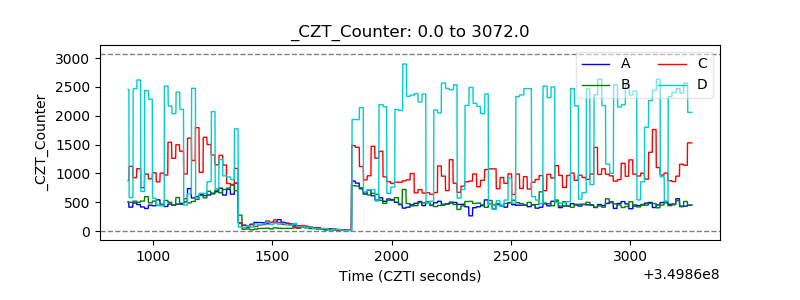 |
| +2.5 Volts monitor | 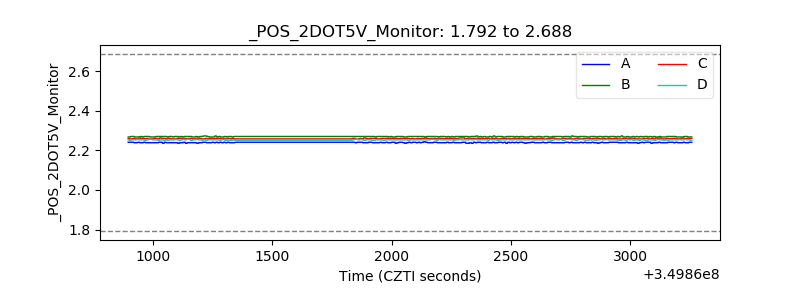 |
| +5 Volts monitor |  |
| _ROLL_ROT |  |
| _Roll_DEC | 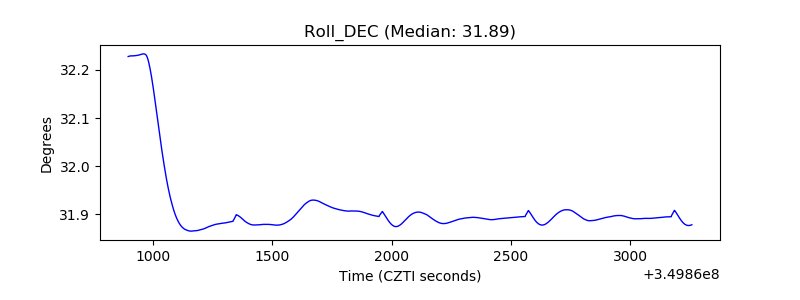 |
| _Roll_RA | 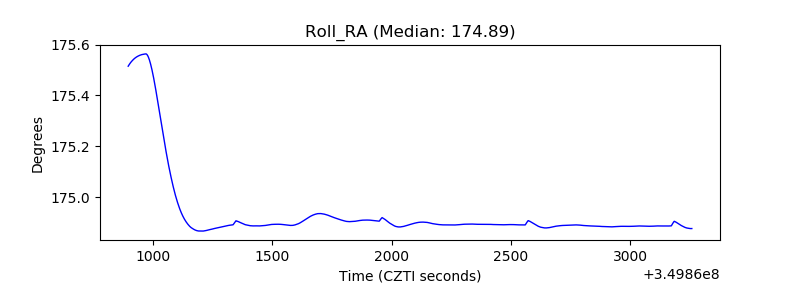 |
| Veto Counter | 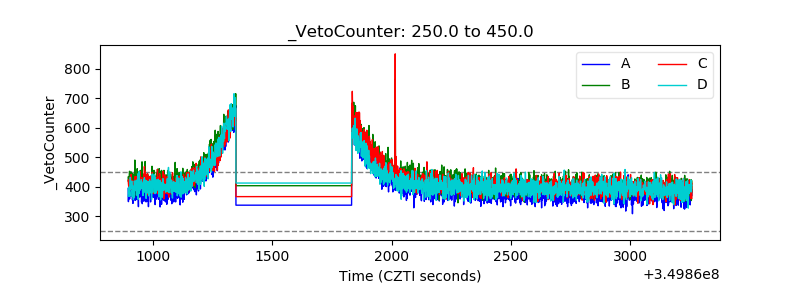 |