| Param | Original file | Final file |
|---|---|---|
| Filename | modeM0/AS1A10_064T02_9000004146_28911cztM0_level2.evt | modeM0/AS1A10_064T02_9000004146_28911cztM0_level2_quad_clean.evt |
| Size (bytes) | 1,023,972,480 | 89,812,800 |
| Size | 976.5 MB | 85.7 MB |
| Events in quadrant A | 3,870,205 | 587,770 |
| Events in quadrant B | 3,840,408 | 606,900 |
| Events in quadrant C | 7,925,507 | 561,692 |
| Events in quadrant D | 14,845,052 | 415,493 |
| Mode M9 | |||
|---|---|---|---|
| Quadrant | BADHDUFLAG | Total packets | Discarded packets |
| A | 0 | 2 | 0 |
| B | 0 | 3 | 0 |
| C | 0 | 3 | 0 |
| D | 0 | 3 | 0 |
| Mode M0 | |||
|---|---|---|---|
| Quadrant | BADHDUFLAG | Total packets | Discarded packets |
| A | 0 | 16461 | 2 |
| B | 0 | 16319 | 2 |
| C | 0 | 29230 | 2 |
| D | 0 | 49411 | 2 |
| Mode SS | |||
|---|---|---|---|
| Quadrant | BADHDUFLAG | Total packets | Discarded packets |
| A | 0 | 160 | 0 |
| B | 0 | 160 | 0 |
| C | 0 | 160 | 0 |
| D | 0 | 160 | 0 |
| Quadrant | Total seconds | Saturated seconds | Saturation percentage |
|---|---|---|---|
| A | 7860 | 194 | 2.468193% |
| B | 7860 | 212 | 2.697201% |
| C | 7860 | 862 | 10.966921% |
| D | 7860 | 5042 | 64.147583% |
Noise dominated data is calculated using 1-second bins in cleaned event files. If a bin has >2000 counts, and if more than 50% of those come from <1% of pixels, then it is considered to be noise-dominated and hence unusable.
| Quadrant | # 1 sec bins | Bins with >0 counts | Bins with >2000 counts | High rate bins dominated by noise | Noise dominated (total time) | Noise dominated (detector-on time) | Marked lightcurve |
|---|---|---|---|---|---|---|---|
| A | 8035 | 7863 | 3 | 3 | 0.04% | 0.04% | 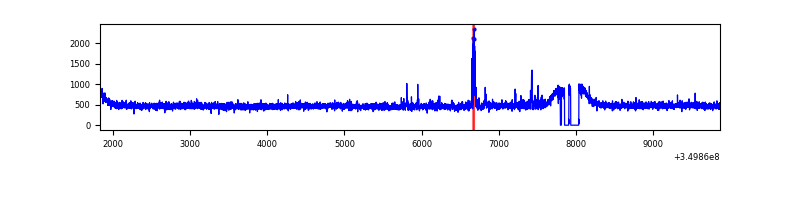 |
| B | 8035 | 7863 | 0 | 0 | 0.00% | 0.00% | 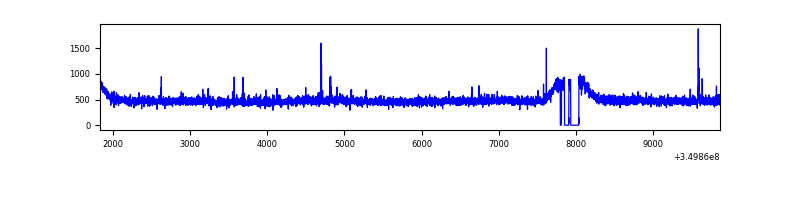 |
| C | 8035 | 7863 | 268 | 268 | 3.34% | 3.41% | 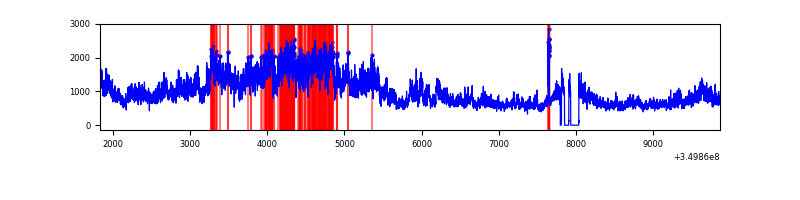 |
| D | 8035 | 7863 | 4928 | 4928 | 61.33% | 62.67% | 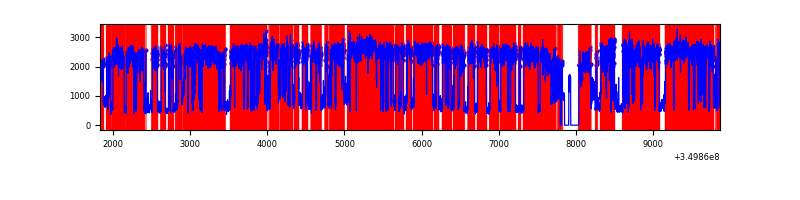 |
Top three noisy pixels from each quadrant. If the there are fewer than three noisy pixels in the level2.evt file, extra rows are filled as -1
| Pixel properties | Quadrant properties | ||||||
|---|---|---|---|---|---|---|---|
| Quadrant | DetID | PixID | Counts | Sigma | Mean | Median | Sigma |
| A | 14 | 235 | 89365 | 444.19 | 976 | 952 | 199.0 |
| A | 13 | 254 | 14267 | 66.89 | 976 | 952 | 199.0 |
| A | 3 | 137 | 9833 | 44.62 | 976 | 952 | 199.0 |
| B | 12 | 111 | 23560 | 119.41 | 967 | 940 | 189.4 |
| B | 11 | 111 | 21565 | 108.88 | 967 | 940 | 189.4 |
| B | 14 | 111 | 19632 | 98.68 | 967 | 940 | 189.4 |
| C | 3 | 233 | 4189100 | 19647.54 | 907 | 910 | 213.2 |
| C | 14 | 238 | 145618 | 678.85 | 907 | 910 | 213.2 |
| C | 15 | 208 | 35058 | 160.19 | 907 | 910 | 213.2 |
| D | 8 | 195 | 9687575 | 55587.64 | 725 | 702 | 174.3 |
| D | 1 | 52 | 2253551 | 12927.86 | 725 | 702 | 174.3 |
| D | 12 | 79 | 88167 | 501.91 | 725 | 702 | 174.3 |
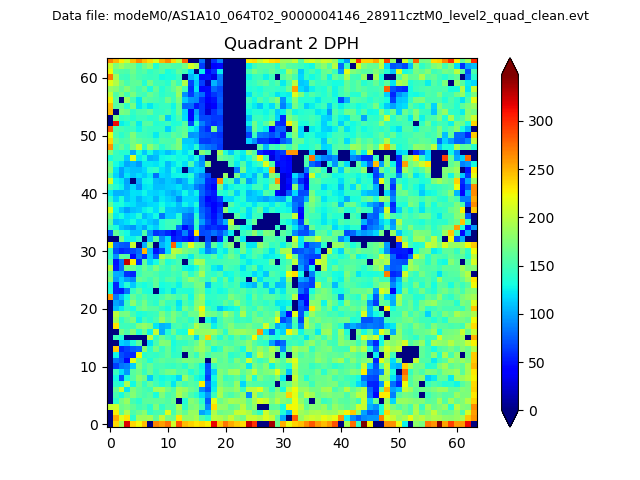
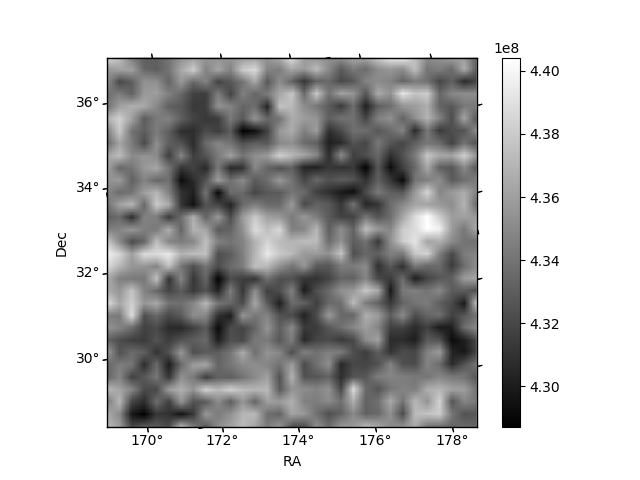
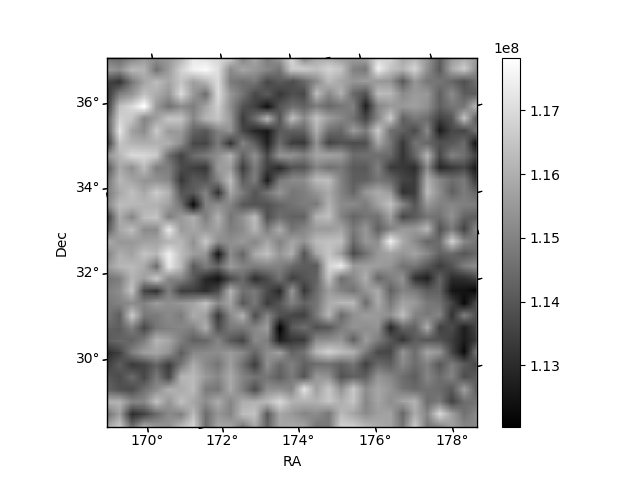
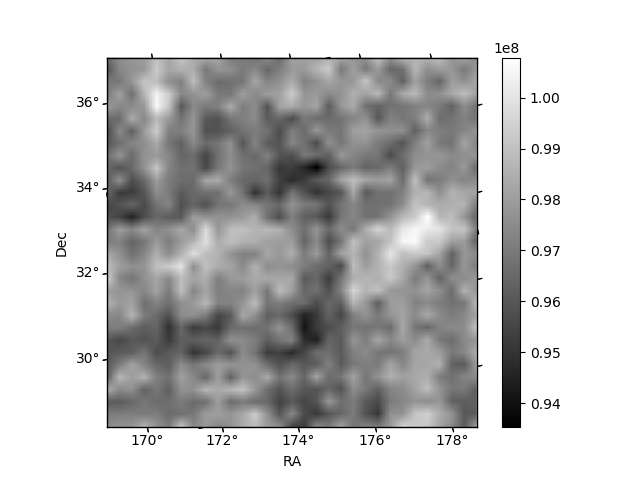
Histogram calculated using DETX and DETY for each event in the final _common_clean file
| Quadrant A | 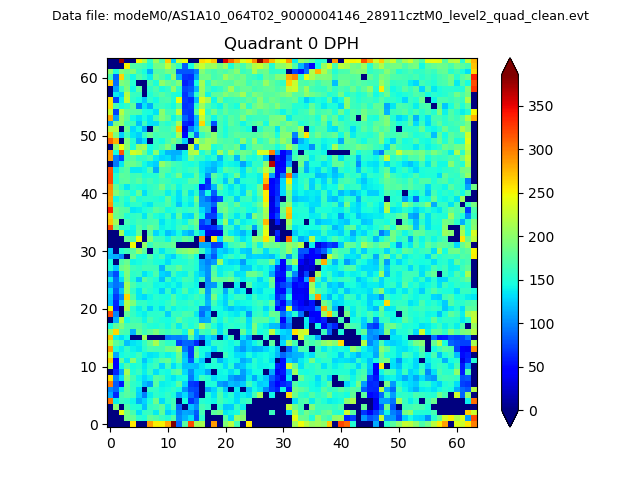 |
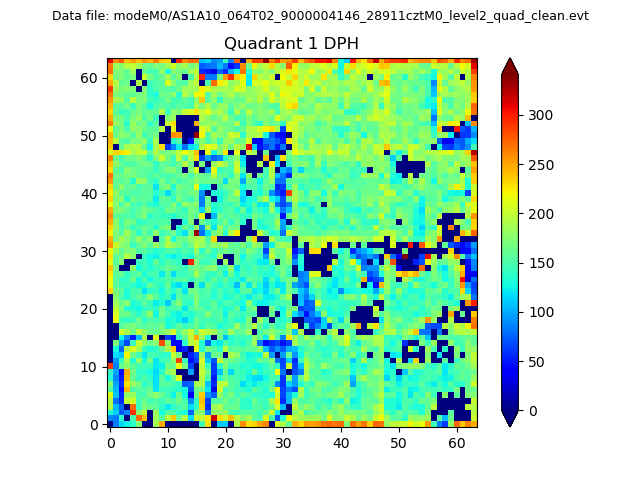 |
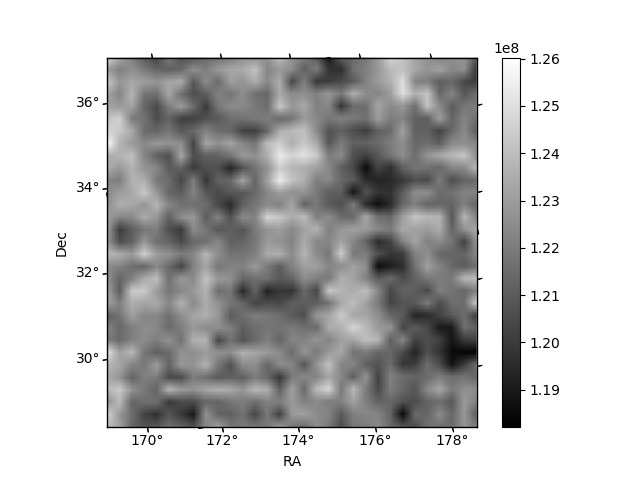
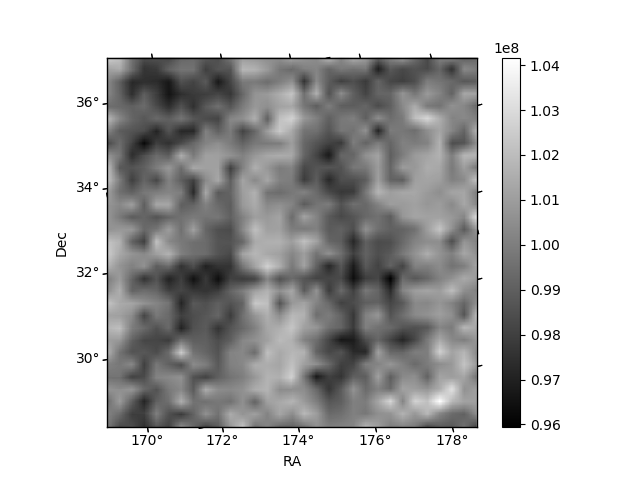
Quadrant B |
|---|---|---|---|
| Quadrant D | 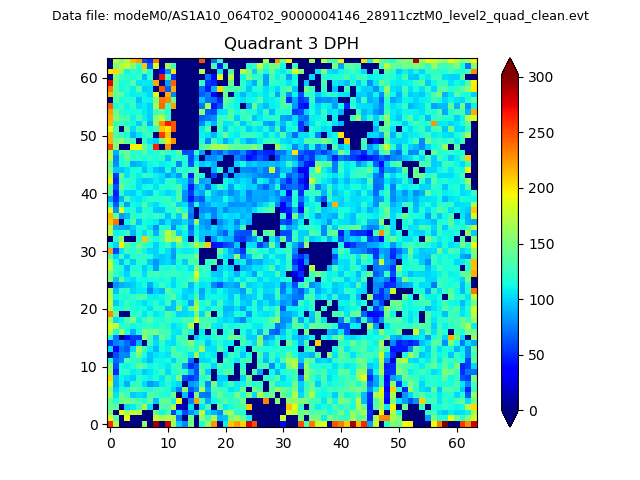 |
 |
Quadrant C |
| Plot type | Count rate plots | Images |
|---|---|---|
| Comparison with Poisson distribution Blue bars denote a histogram of data divided into 1 sec bins. Red curve is a Poisson curve with rate = median count rate of data. |
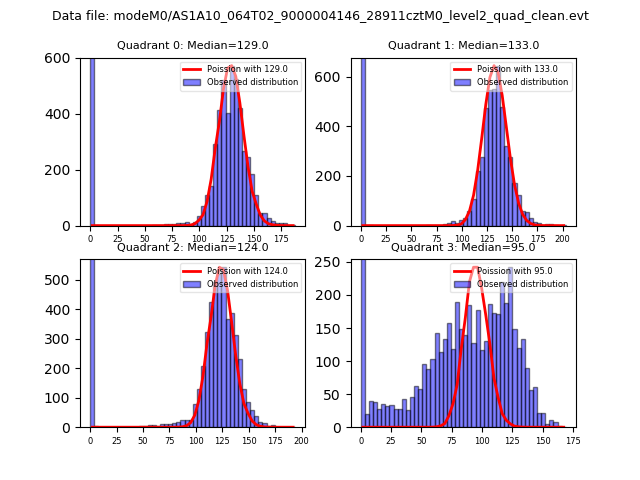 |
 |
| Quadrant-wise count rates Data is divided into 100 sec bins |
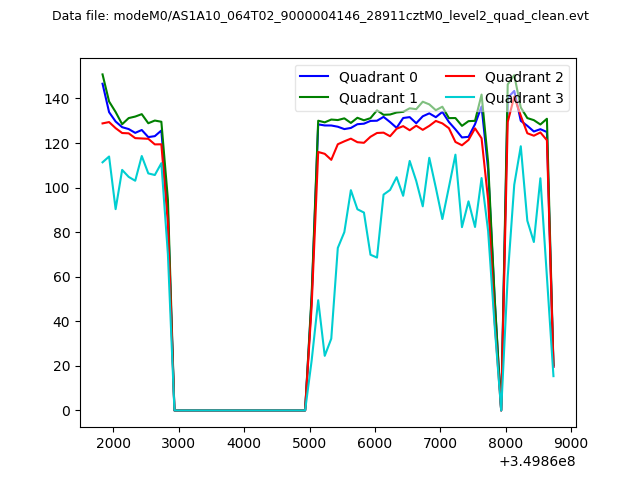 |
|
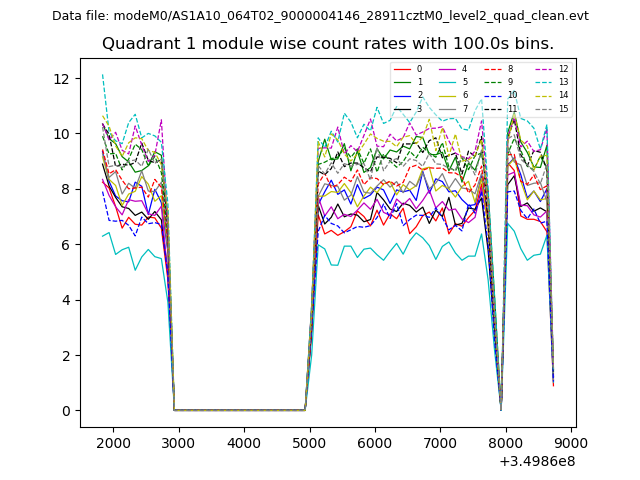
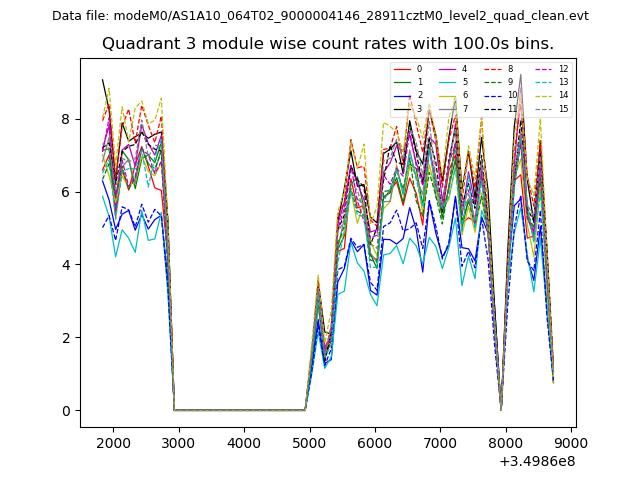
| Module-wise count rates for Quadrant A Data is divided into 100 sec bins |
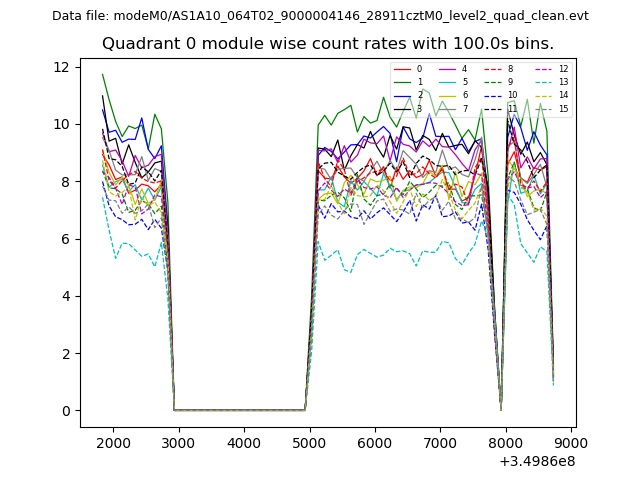 |
 |
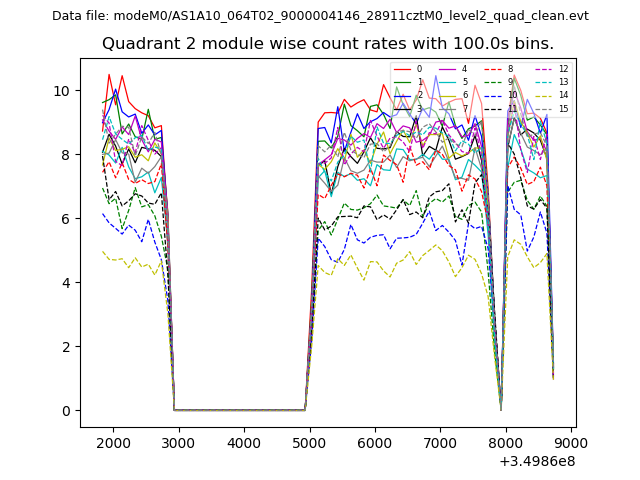
| Module-wise count rates for Quadrant B Data is divided into 100 sec bins |
 |
 |
| Module-wise count rates for Quadrant C Data is divided into 100 sec bins |
 |
 |
| Module-wise count rates for Quadrant D Data is divided into 100 sec bins |
 |
 |
| Parameter | Plot |
|---|---|
| CZT HV Monitor | 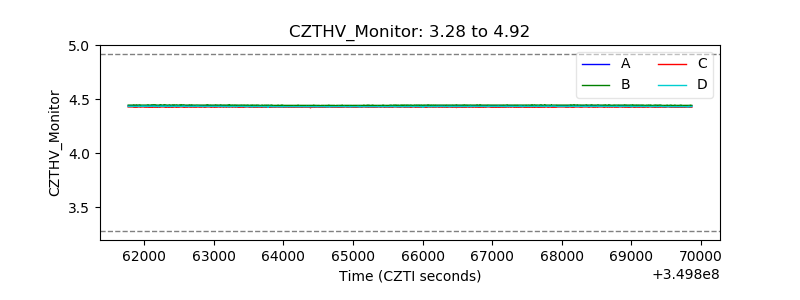 |
| D_VDD | 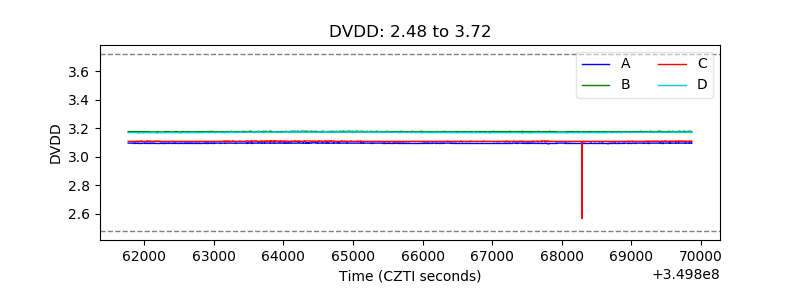 |
| Temperature 1 | 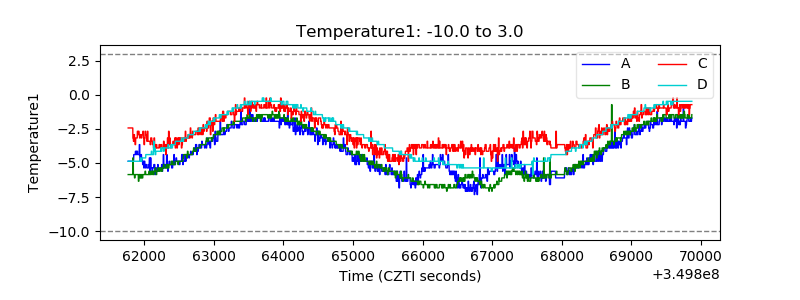 |
| Veto HV Monitor |  |
| Veto LLD | 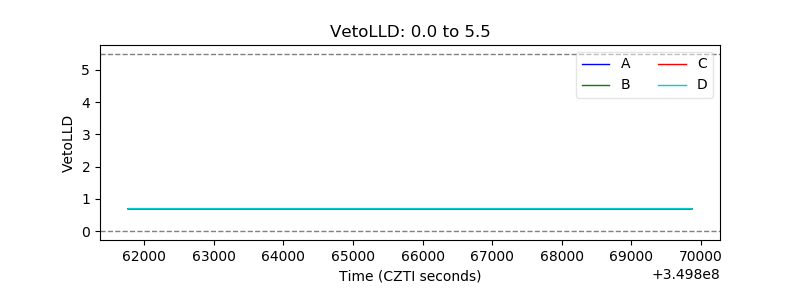 |
| Alpha Counter | 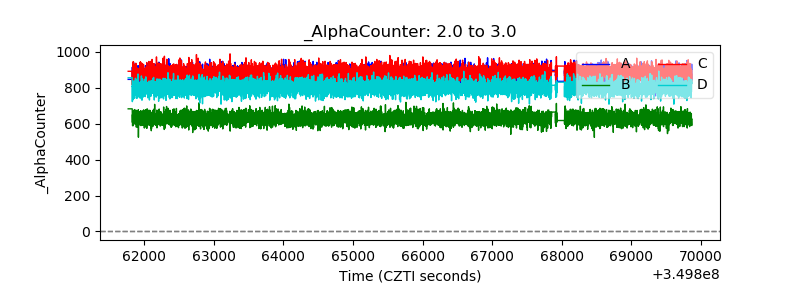 |
| _CPM_Rate | 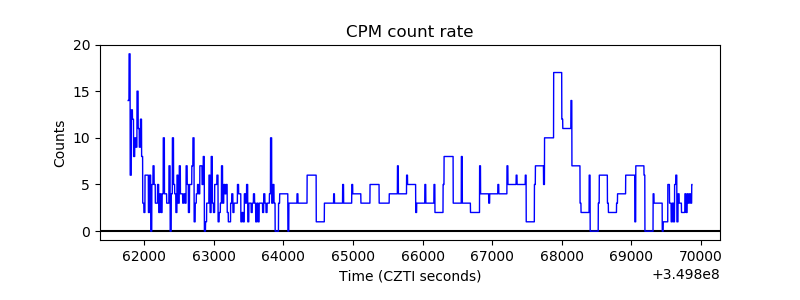 |
| CZT Counter | 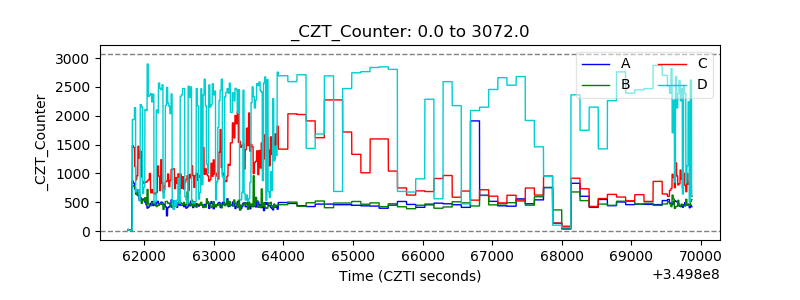 |
| +2.5 Volts monitor |  |
| +5 Volts monitor |  |
| _ROLL_ROT |  |
| _Roll_DEC |  |
| _Roll_RA | 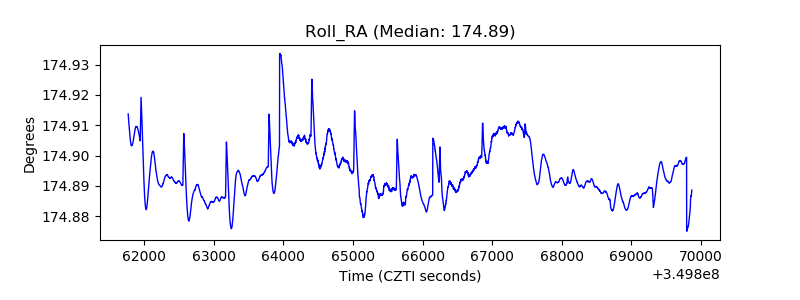 |
| Veto Counter | 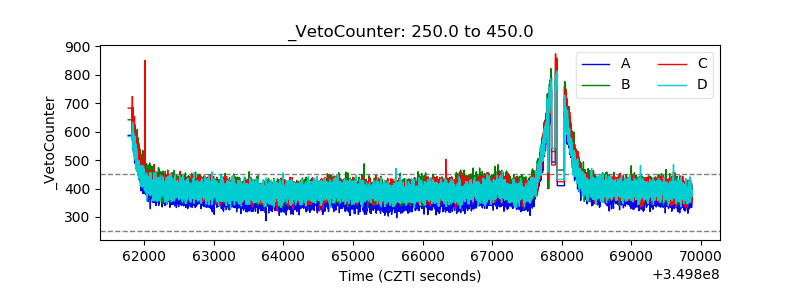 |