| Param | Original file | Final file |
|---|---|---|
| Filename | modeM0/AS1A10_064T02_9000004146_28915cztM0_level2.evt | modeM0/AS1A10_064T02_9000004146_28915cztM0_level2_quad_clean.evt |
| Size (bytes) | 1,791,610,560 | 220,671,360 |
| Size | 1.7 GB | 210.4 MB |
| Events in quadrant A | 8,527,984 | 1,410,592 |
| Events in quadrant B | 8,630,973 | 1,435,458 |
| Events in quadrant C | 17,470,956 | 1,327,413 |
| Events in quadrant D | 18,429,034 | 1,279,819 |
| Mode M9 | |||
|---|---|---|---|
| Quadrant | BADHDUFLAG | Total packets | Discarded packets |
| A | 0 | 20 | 0 |
| B | 0 | 20 | 0 |
| C | 0 | 20 | 0 |
| D | 0 | 20 | 0 |
| Mode M0 | |||
|---|---|---|---|
| Quadrant | BADHDUFLAG | Total packets | Discarded packets |
| A | 0 | 36767 | 3 |
| B | 0 | 36993 | 3 |
| C | 0 | 64658 | 8 |
| D | 0 | 67261 | 3 |
| Mode SS | |||
|---|---|---|---|
| Quadrant | BADHDUFLAG | Total packets | Discarded packets |
| A | 0 | 364 | 0 |
| B | 0 | 364 | 0 |
| C | 0 | 364 | 0 |
| D | 0 | 364 | 0 |
| Quadrant | Total seconds | Saturated seconds | Saturation percentage |
|---|---|---|---|
| A | 17835 | 133 | 0.745725% |
| B | 17836 | 179 | 1.003588% |
| C | 17834 | 1730 | 9.700572% |
| D | 17834 | 3118 | 17.483459% |
Noise dominated data is calculated using 1-second bins in cleaned event files. If a bin has >2000 counts, and if more than 50% of those come from <1% of pixels, then it is considered to be noise-dominated and hence unusable.
| Quadrant | # 1 sec bins | Bins with >0 counts | Bins with >2000 counts | High rate bins dominated by noise | Noise dominated (total time) | Noise dominated (detector-on time) | Marked lightcurve |
|---|---|---|---|---|---|---|---|
| A | 19915 | 17838 | 0 | 0 | 0.00% | 0.00% | 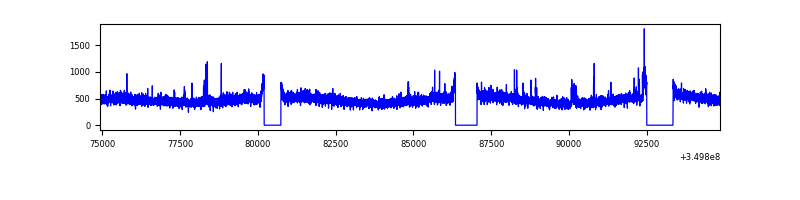 |
| B | 19916 | 17839 | 7 | 7 | 0.04% | 0.04% | 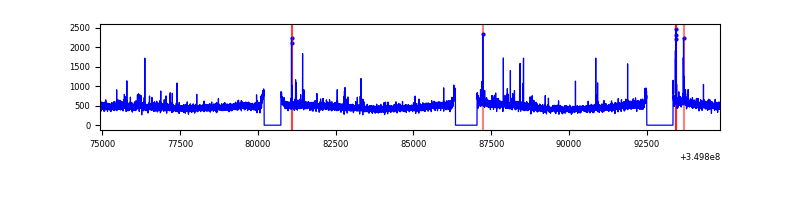 |
| C | 19915 | 17838 | 466 | 466 | 2.34% | 2.61% | 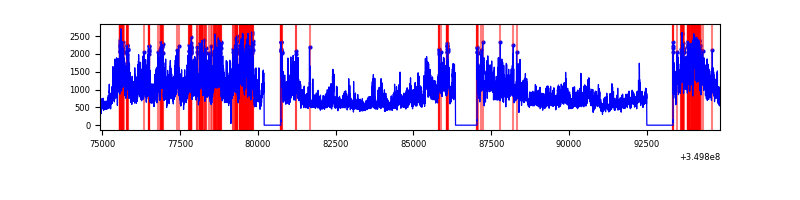 |
| D | 19915 | 17838 | 2923 | 2923 | 14.68% | 16.39% | 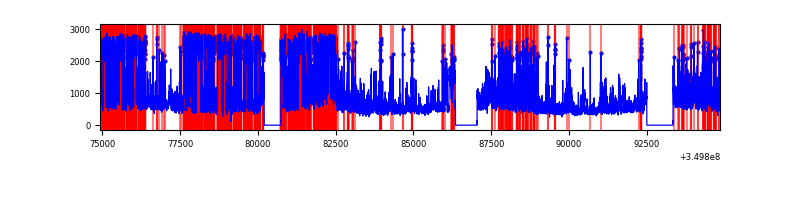 |
Top three noisy pixels from each quadrant. If the there are fewer than three noisy pixels in the level2.evt file, extra rows are filled as -1
| Pixel properties | Quadrant properties | ||||||
|---|---|---|---|---|---|---|---|
| Quadrant | DetID | PixID | Counts | Sigma | Mean | Median | Sigma |
| A | 14 | 235 | 57925 | 129.27 | 2160 | 2113 | 431.7 |
| A | 15 | 169 | 41052 | 90.19 | 2160 | 2113 | 431.7 |
| A | 9 | 130 | 36709 | 80.13 | 2160 | 2113 | 431.7 |
| B | 10 | 245 | 57950 | 136.43 | 2149 | 2093 | 409.4 |
| B | 12 | 111 | 51236 | 120.03 | 2149 | 2093 | 409.4 |
| B | 5 | 255 | 47518 | 110.95 | 2149 | 2093 | 409.4 |
| C | 3 | 233 | 9053164 | 19041.44 | 2026 | 2037 | 475.3 |
| C | 14 | 238 | 341690 | 714.55 | 2026 | 2037 | 475.3 |
| C | 15 | 208 | 59134 | 120.12 | 2026 | 2037 | 475.3 |
| D | 8 | 195 | 9285711 | 19995.31 | 1949 | 1897 | 464.3 |
| D | 1 | 52 | 1579680 | 3398.2 | 1949 | 1897 | 464.3 |
| D | 2 | 234 | 79478 | 167.09 | 1949 | 1897 | 464.3 |
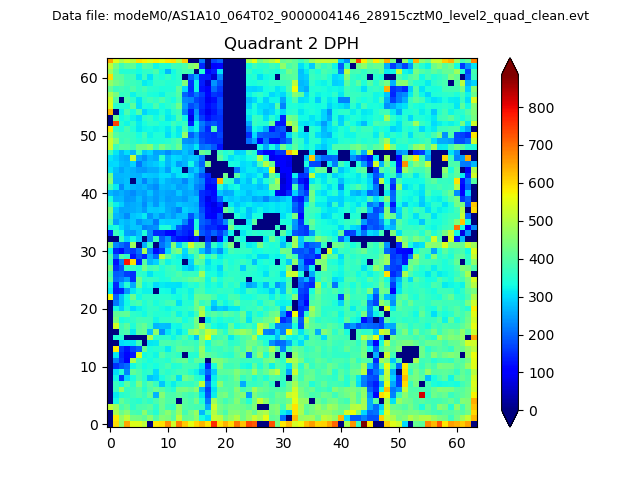
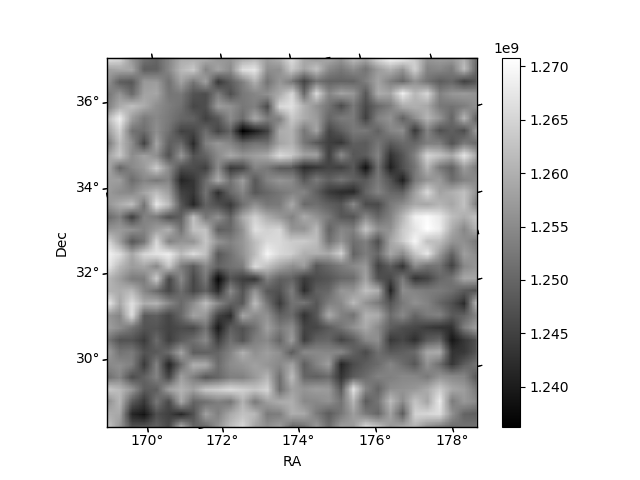
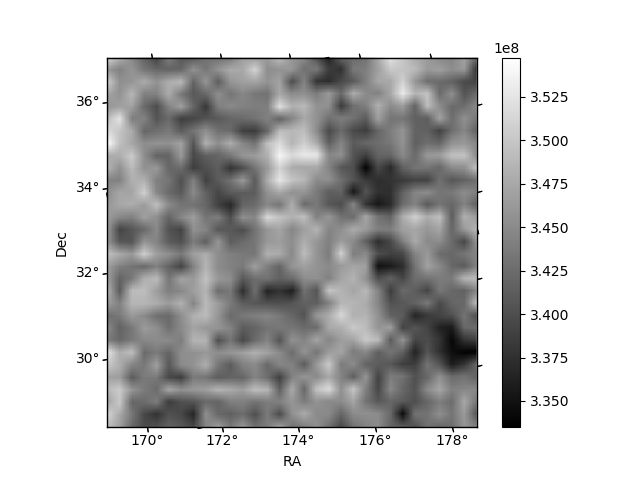
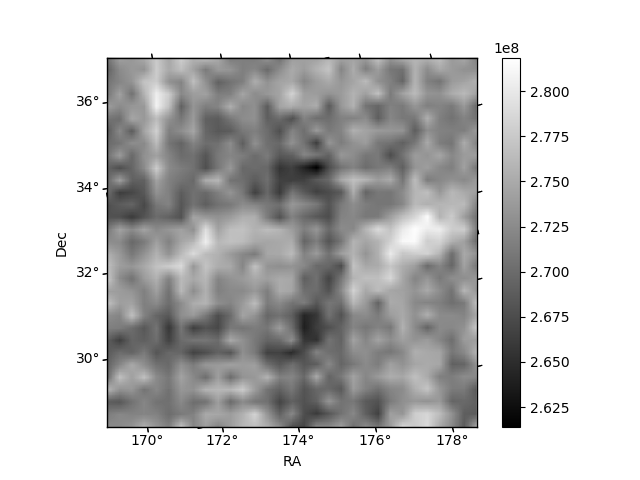
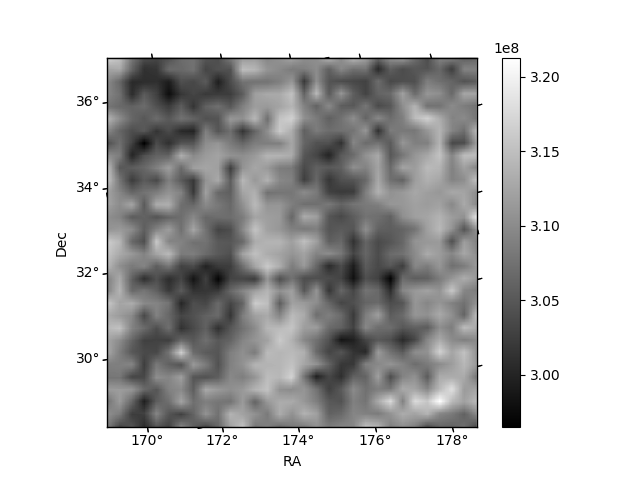
Histogram calculated using DETX and DETY for each event in the final _common_clean file
| Quadrant A | 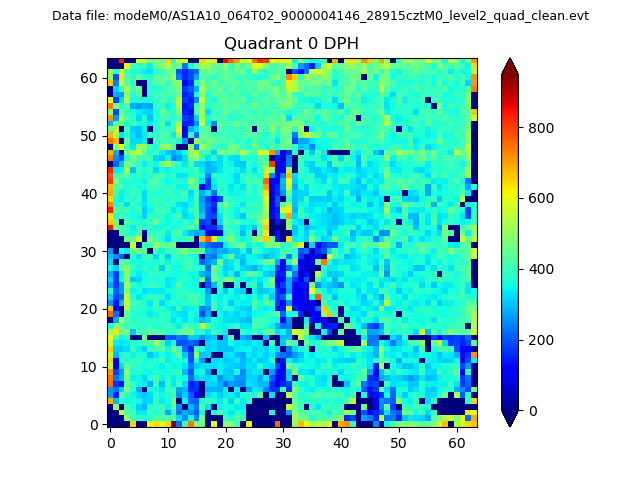 |
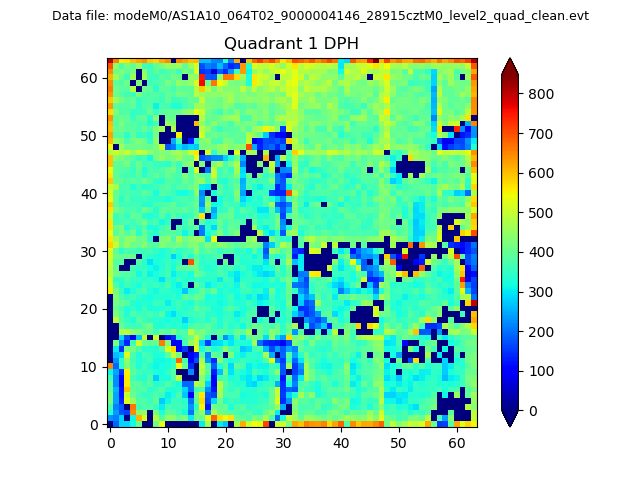 |
Quadrant B |
|---|---|---|---|
| Quadrant D | 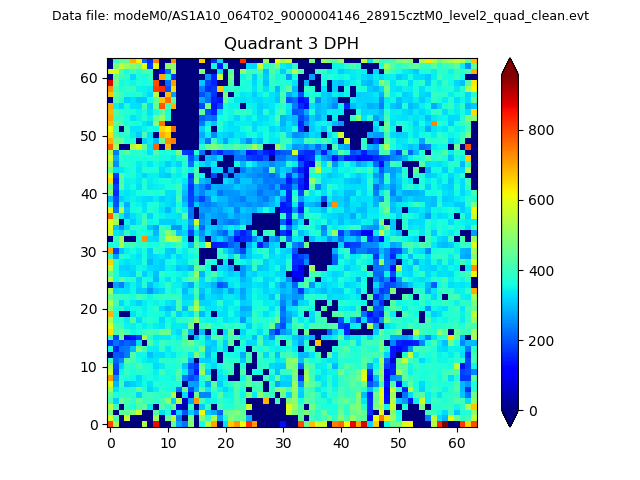 |
 |
Quadrant C |
| Plot type | Count rate plots | Images |
|---|---|---|
| Comparison with Poisson distribution Blue bars denote a histogram of data divided into 1 sec bins. Red curve is a Poisson curve with rate = median count rate of data. |
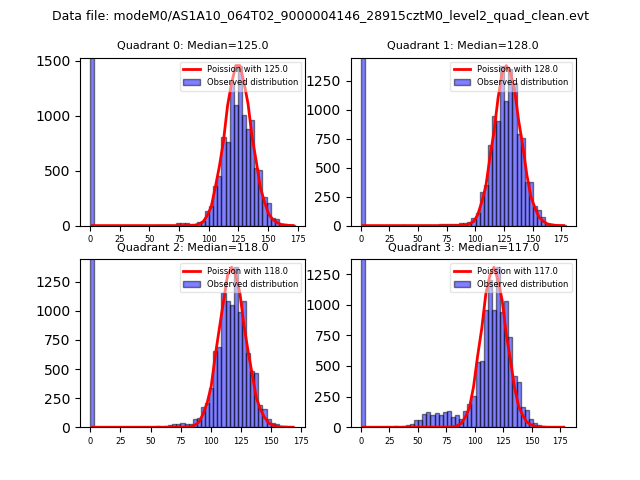 |
 |
| Quadrant-wise count rates Data is divided into 100 sec bins |
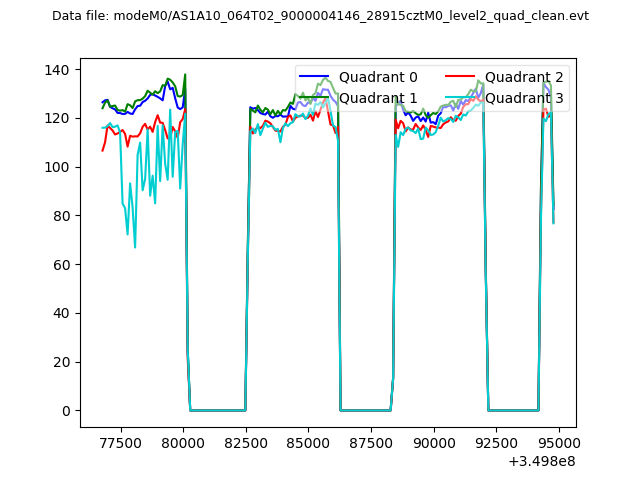 |
|
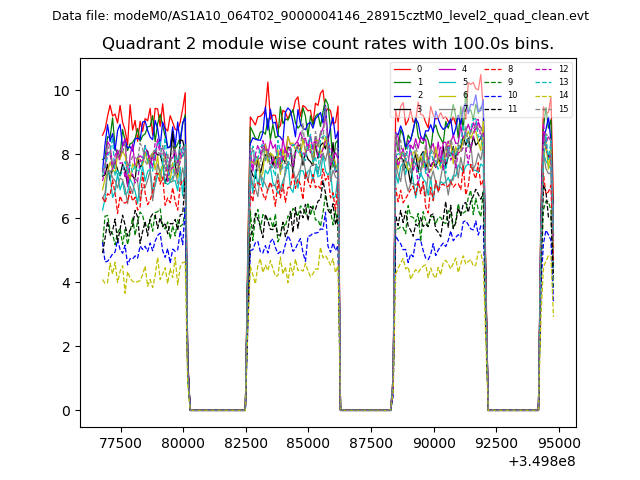
| Module-wise count rates for Quadrant A Data is divided into 100 sec bins |
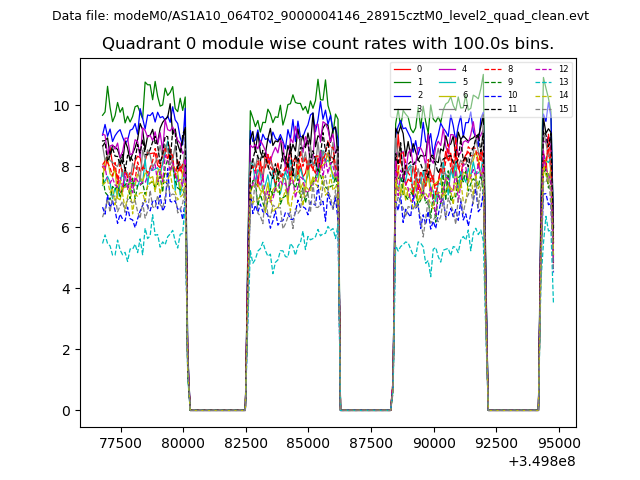 |
 |
| Module-wise count rates for Quadrant B Data is divided into 100 sec bins |
 |
 |
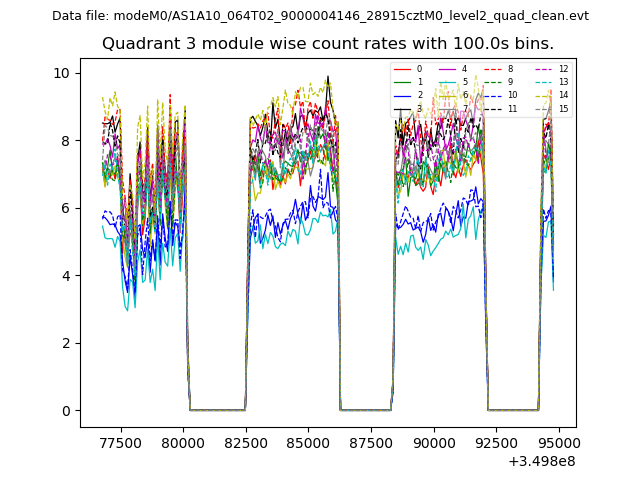
| Module-wise count rates for Quadrant C Data is divided into 100 sec bins |
 |
 |
| Module-wise count rates for Quadrant D Data is divided into 100 sec bins |
 |
 |
| Parameter | Plot |
|---|---|
| CZT HV Monitor | 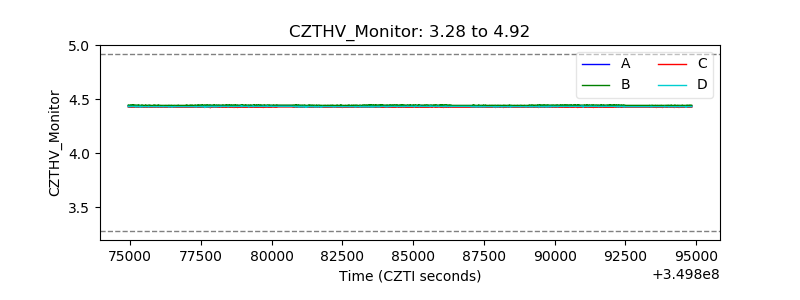 |
| D_VDD | 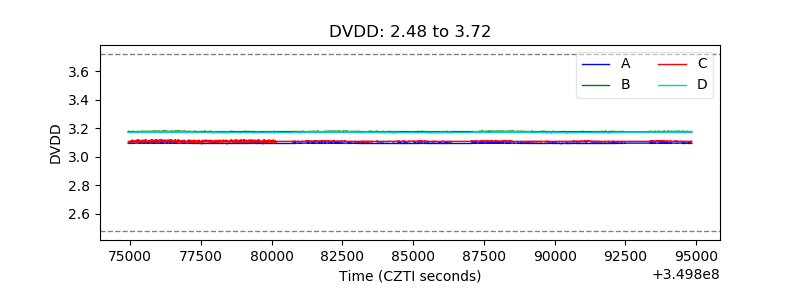 |
| Temperature 1 | 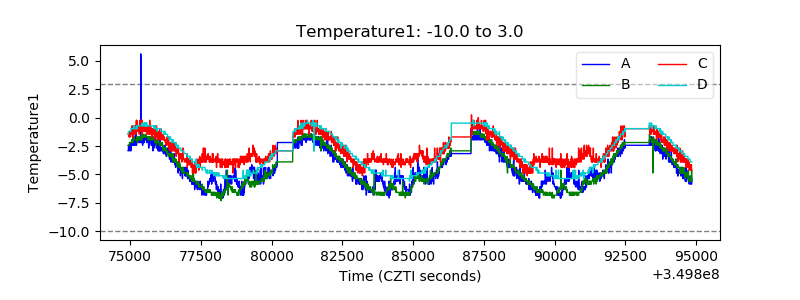 |
| Veto HV Monitor | 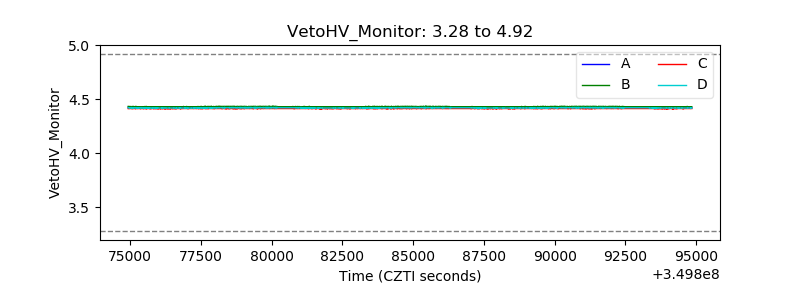 |
| Veto LLD | 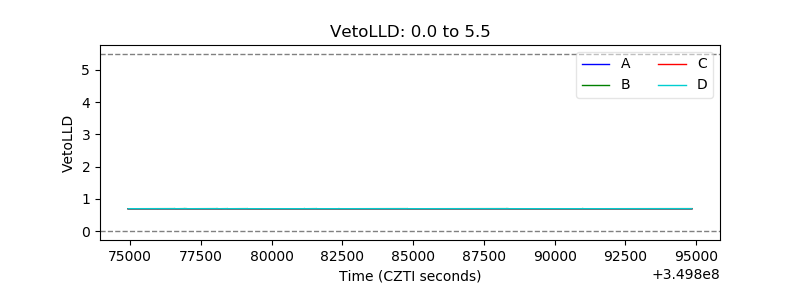 |
| Alpha Counter | 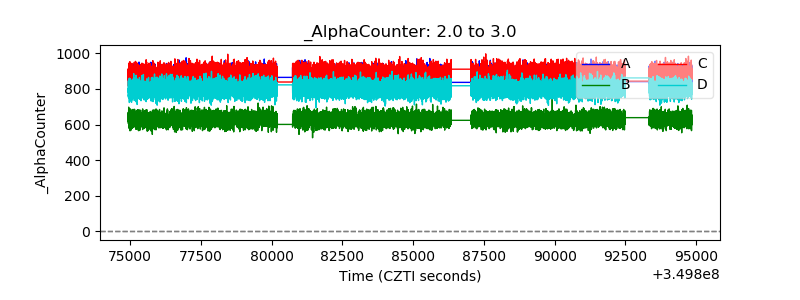 |
| _CPM_Rate | 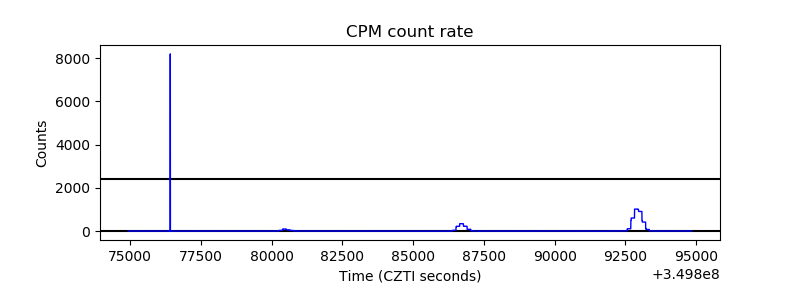 |
| CZT Counter | 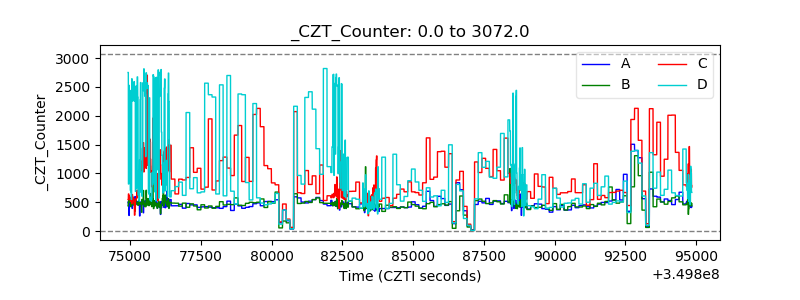 |
| +2.5 Volts monitor | 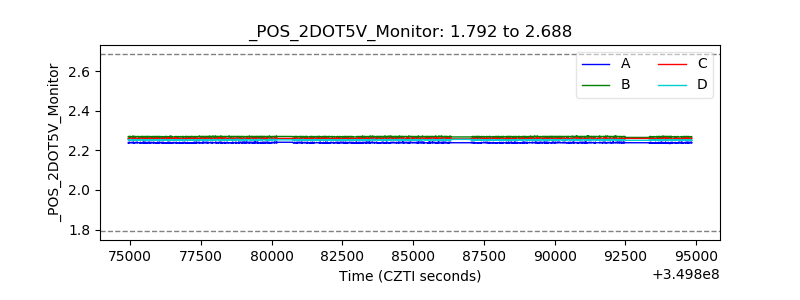 |
| +5 Volts monitor |  |
| _ROLL_ROT | 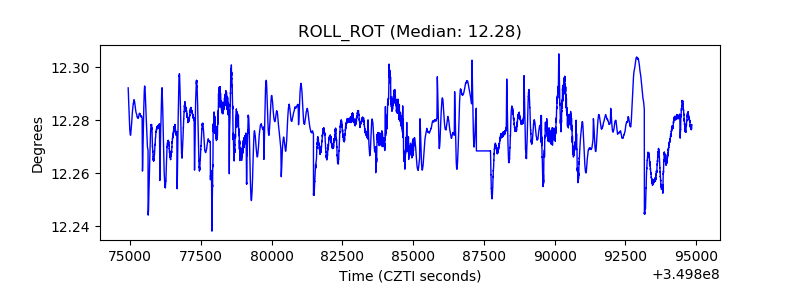 |
| _Roll_DEC | 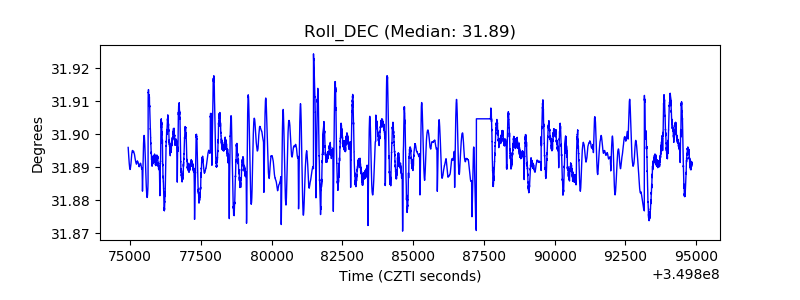 |
| _Roll_RA | 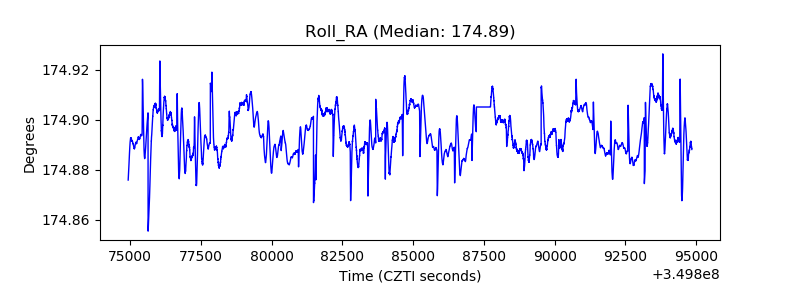 |
| Veto Counter | 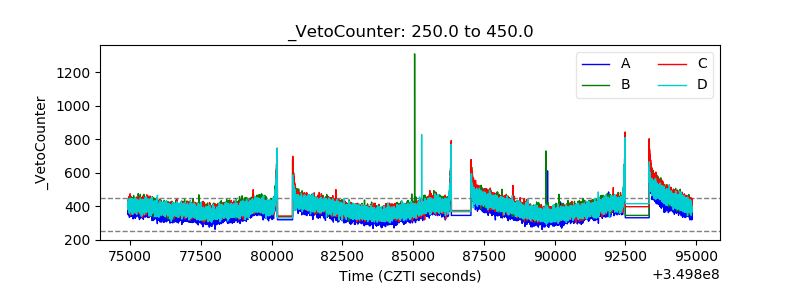 |