| Param | Original file | Final file |
|---|---|---|
| Filename | modeM0/AS1A10_064T02_9000004146_28916cztM0_level2.evt | modeM0/AS1A10_064T02_9000004146_28916cztM0_level2_quad_clean.evt |
| Size (bytes) | 620,377,920 | 91,535,040 |
| Size | 591.6 MB | 87.3 MB |
| Events in quadrant A | 3,461,605 | 578,494 |
| Events in quadrant B | 3,526,768 | 592,223 |
| Events in quadrant C | 5,774,739 | 561,560 |
| Events in quadrant D | 5,548,038 | 548,819 |
| Mode M9 | |||
|---|---|---|---|
| Quadrant | BADHDUFLAG | Total packets | Discarded packets |
| A | 0 | 18 | 0 |
| B | 0 | 18 | 0 |
| C | 0 | 18 | 0 |
| D | 0 | 18 | 0 |
| Mode M0 | |||
|---|---|---|---|
| Quadrant | BADHDUFLAG | Total packets | Discarded packets |
| A | 0 | 14859 | 2 |
| B | 0 | 15053 | 2 |
| C | 0 | 21962 | 2 |
| D | 0 | 21470 | 3 |
| Mode SS | |||
|---|---|---|---|
| Quadrant | BADHDUFLAG | Total packets | Discarded packets |
| A | 0 | 146 | 0 |
| B | 0 | 146 | 0 |
| C | 0 | 146 | 0 |
| D | 0 | 146 | 0 |
| Quadrant | Total seconds | Saturated seconds | Saturation percentage |
|---|---|---|---|
| A | 7046 | 65 | 0.922509% |
| B | 7046 | 92 | 1.305705% |
| C | 7046 | 711 | 10.090832% |
| D | 7046 | 275 | 3.902924% |
Noise dominated data is calculated using 1-second bins in cleaned event files. If a bin has >2000 counts, and if more than 50% of those come from <1% of pixels, then it is considered to be noise-dominated and hence unusable.
| Quadrant | # 1 sec bins | Bins with >0 counts | Bins with >2000 counts | High rate bins dominated by noise | Noise dominated (total time) | Noise dominated (detector-on time) | Marked lightcurve |
|---|---|---|---|---|---|---|---|
| A | 8886 | 7048 | 0 | 0 | 0.00% | 0.00% | 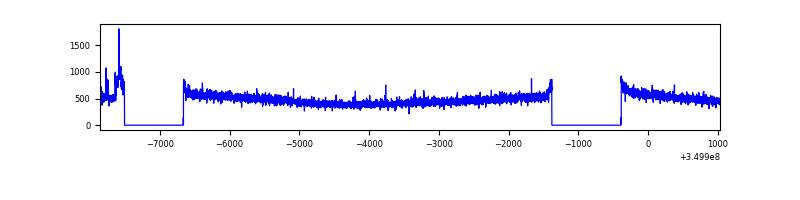 |
| B | 8886 | 7048 | 5 | 5 | 0.06% | 0.07% | 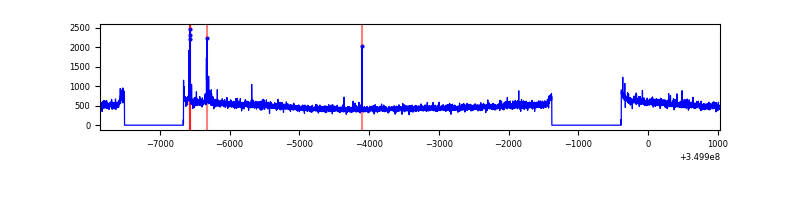 |
| C | 8886 | 7048 | 181 | 181 | 2.04% | 2.57% | 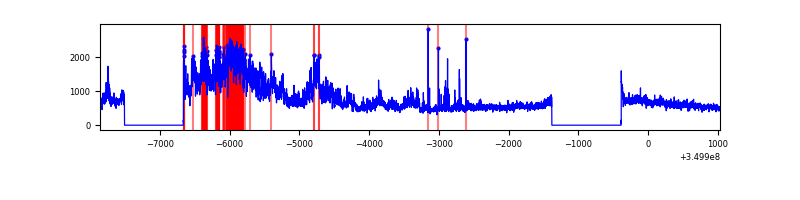 |
| D | 8886 | 7048 | 191 | 191 | 2.15% | 2.71% | 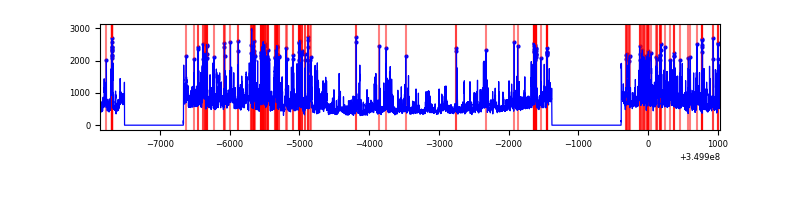 |
Top three noisy pixels from each quadrant. If the there are fewer than three noisy pixels in the level2.evt file, extra rows are filled as -1
| Pixel properties | Quadrant properties | ||||||
|---|---|---|---|---|---|---|---|
| Quadrant | DetID | PixID | Counts | Sigma | Mean | Median | Sigma |
| A | 15 | 169 | 37389 | 205.63 | 885 | 866 | 177.6 |
| A | 13 | 254 | 13883 | 73.29 | 885 | 866 | 177.6 |
| A | 3 | 137 | 8773 | 44.52 | 885 | 866 | 177.6 |
| B | 10 | 245 | 44572 | 257.02 | 884 | 861 | 170.1 |
| B | 12 | 111 | 20884 | 117.73 | 884 | 861 | 170.1 |
| B | 11 | 111 | 18847 | 105.76 | 884 | 861 | 170.1 |
| C | 3 | 233 | 2272373 | 11497.17 | 841 | 846 | 197.6 |
| C | 14 | 238 | 137842 | 693.4 | 841 | 846 | 197.6 |
| C | 15 | 208 | 53148 | 264.72 | 841 | 846 | 197.6 |
| D | 8 | 195 | 1785543 | 8692.6 | 857 | 833 | 205.3 |
| D | 1 | 52 | 407289 | 1979.68 | 857 | 833 | 205.3 |
| D | 12 | 233 | 58746 | 282.07 | 857 | 833 | 205.3 |
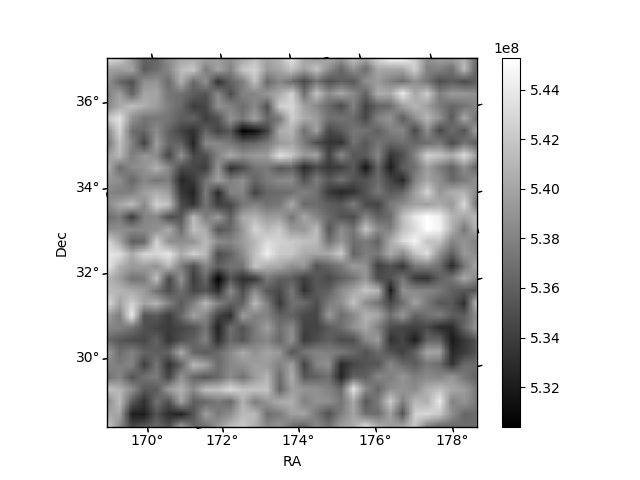
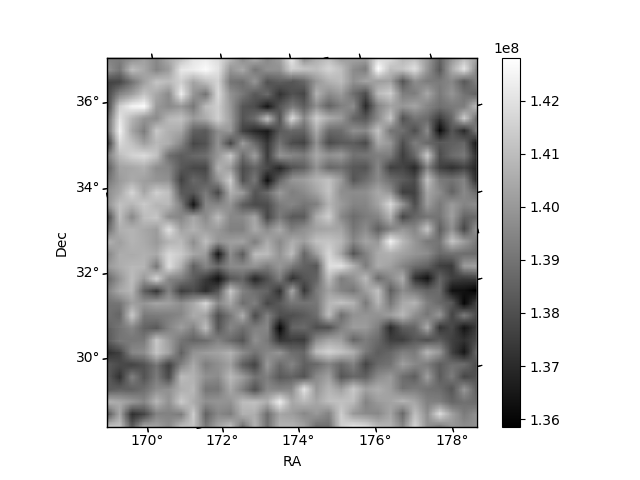
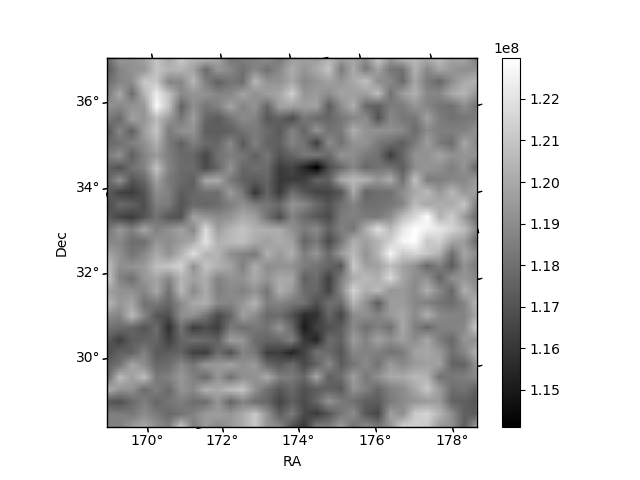
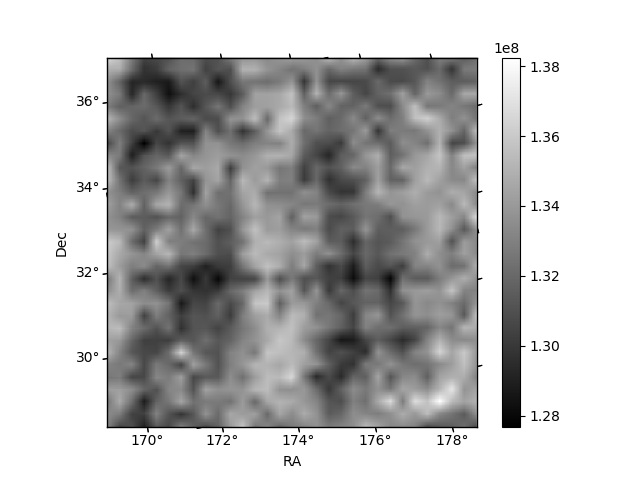
Histogram calculated using DETX and DETY for each event in the final _common_clean file
| Quadrant A | 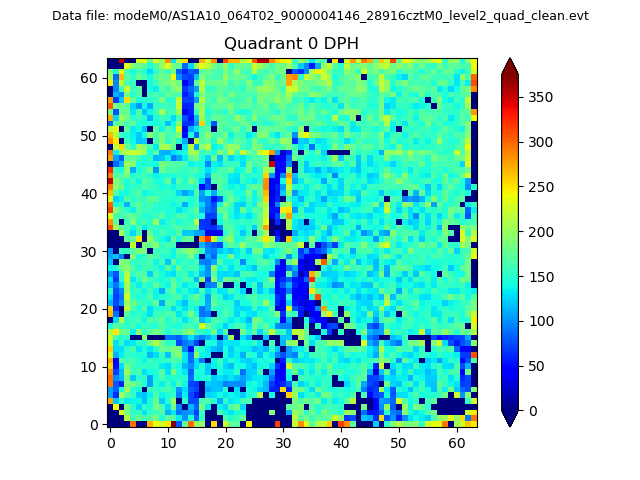 |
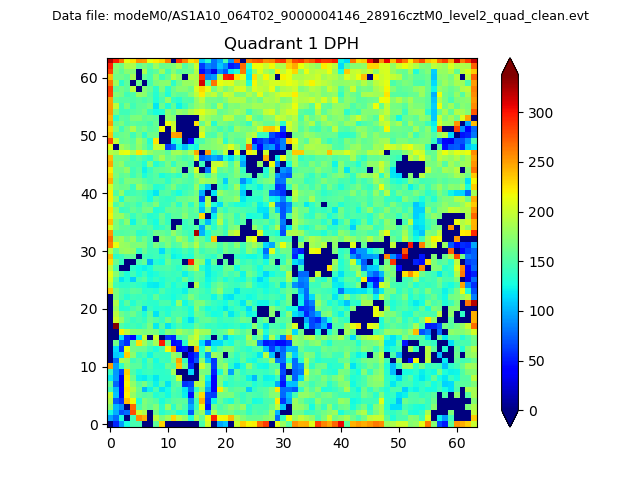 |
Quadrant B |
|---|---|---|---|
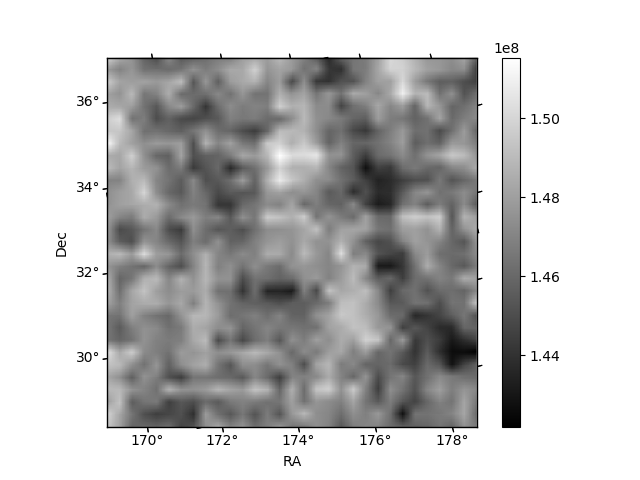
| Quadrant D | 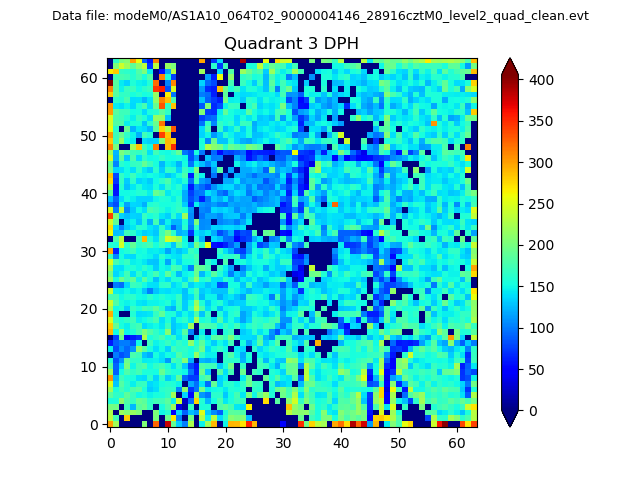 |
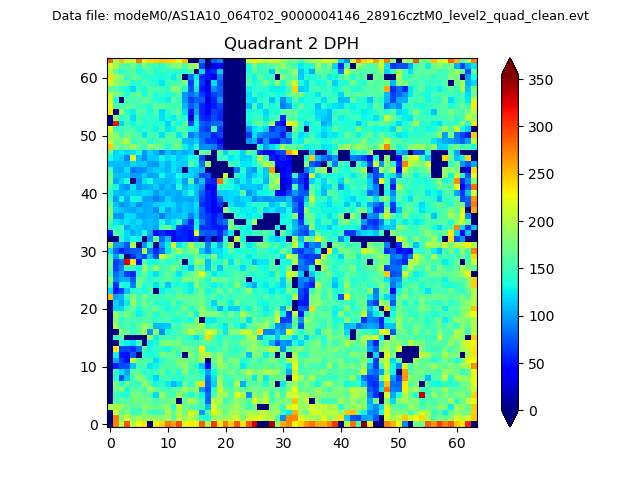 |
Quadrant C |
| Plot type | Count rate plots | Images |
|---|---|---|
| Comparison with Poisson distribution Blue bars denote a histogram of data divided into 1 sec bins. Red curve is a Poisson curve with rate = median count rate of data. |
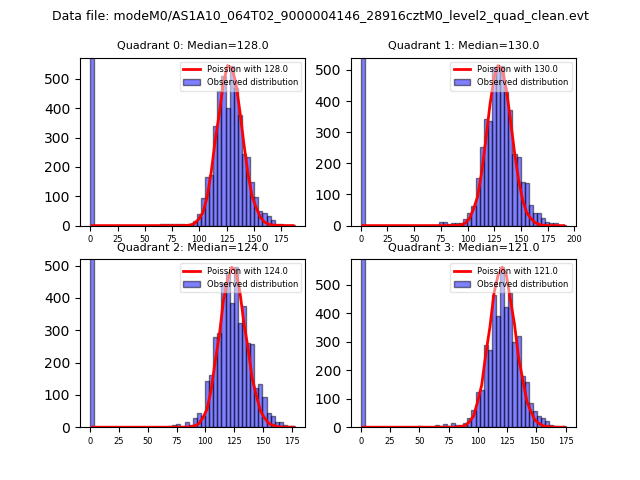 |
 |
| Quadrant-wise count rates Data is divided into 100 sec bins |
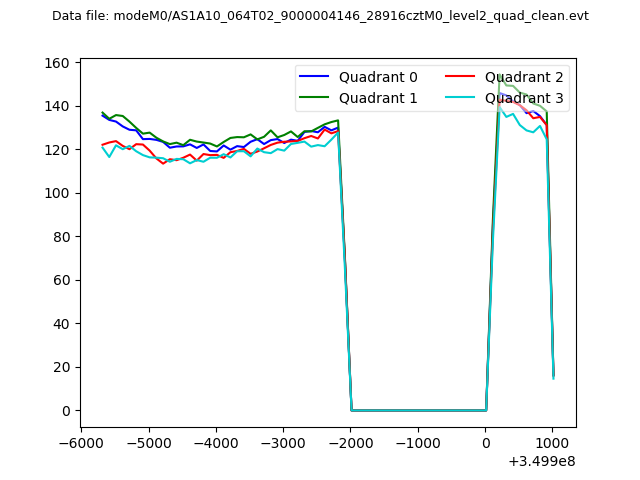 |
|
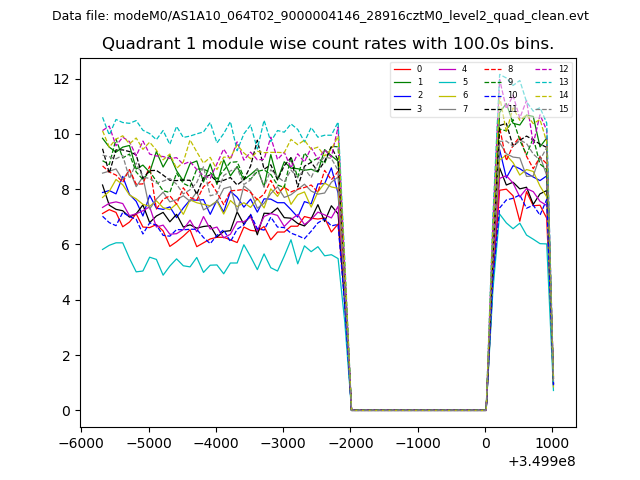
| Module-wise count rates for Quadrant A Data is divided into 100 sec bins |
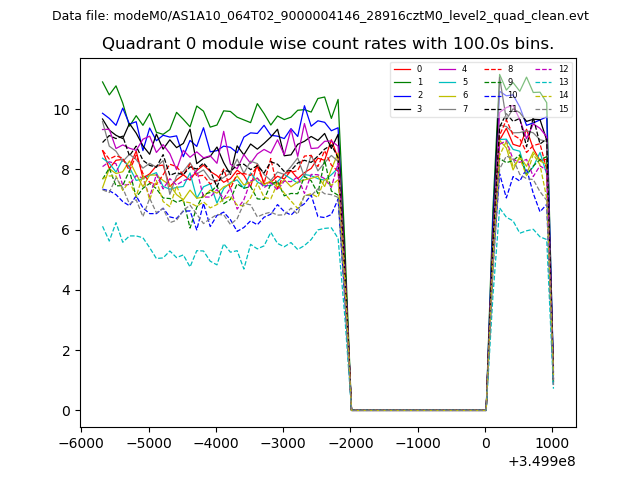 |
 |
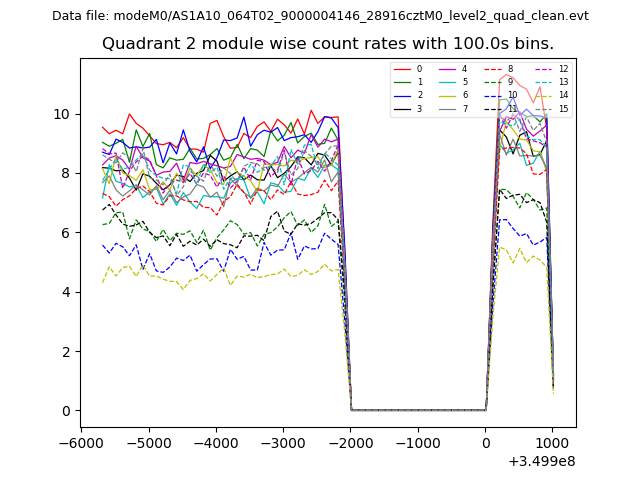
| Module-wise count rates for Quadrant B Data is divided into 100 sec bins |
 |
 |
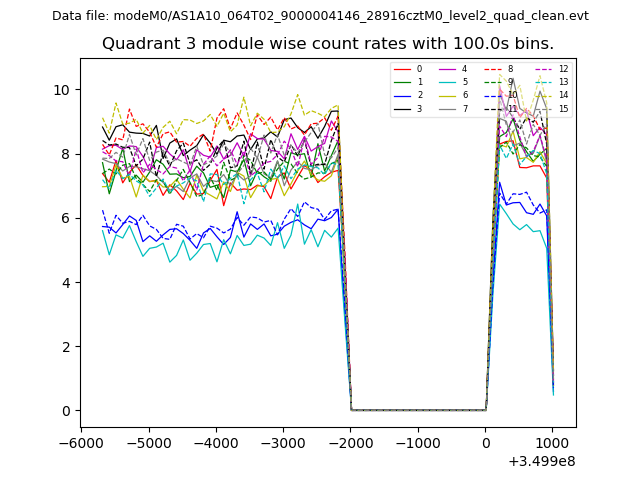
| Module-wise count rates for Quadrant C Data is divided into 100 sec bins |
 |
 |
| Module-wise count rates for Quadrant D Data is divided into 100 sec bins |
 |
 |
| Parameter | Plot |
|---|---|
| CZT HV Monitor | 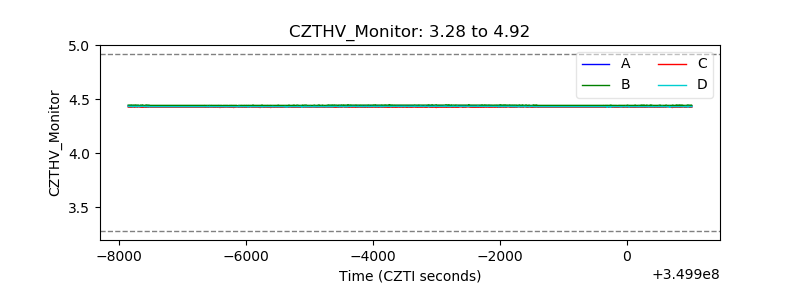 |
| D_VDD | 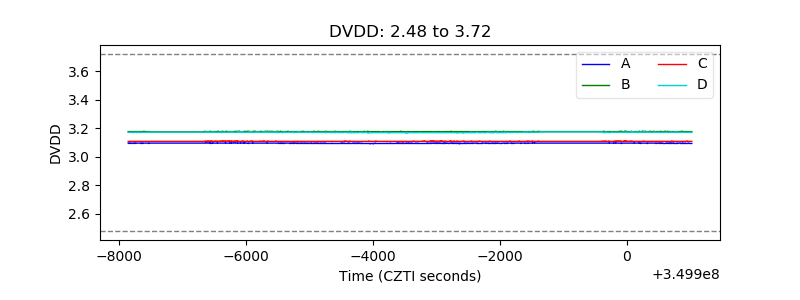 |
| Temperature 1 | 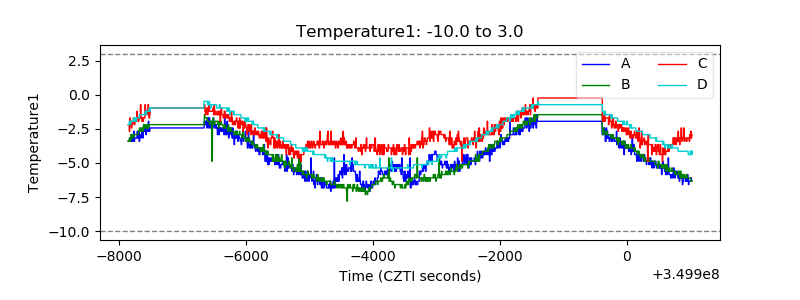 |
| Veto HV Monitor | 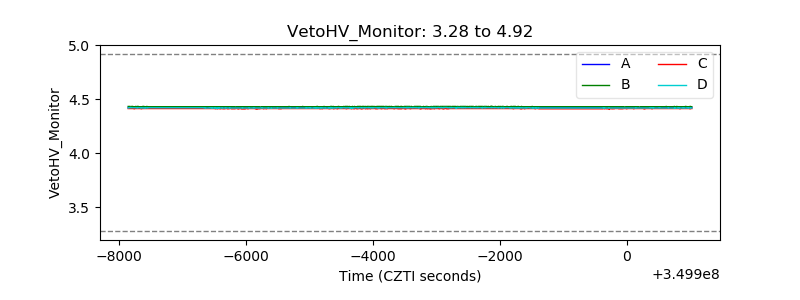 |
| Veto LLD | 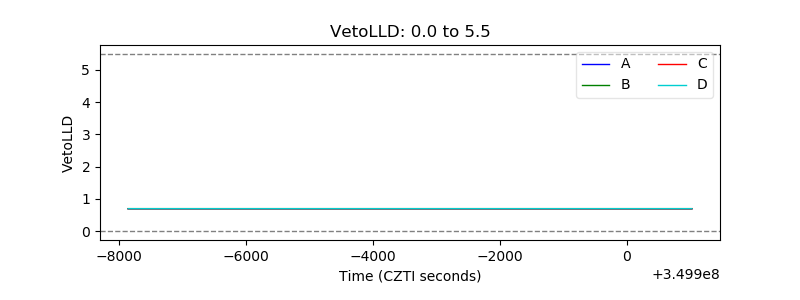 |
| Alpha Counter | 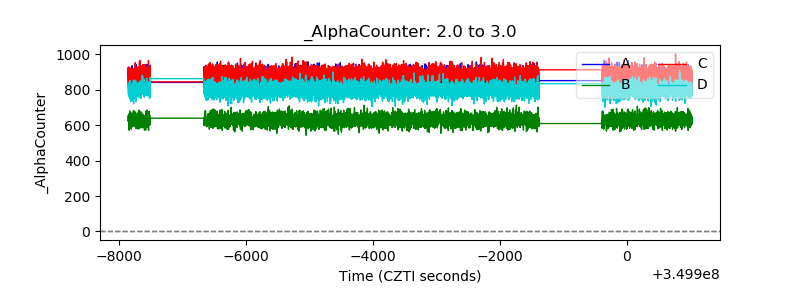 |
| _CPM_Rate | 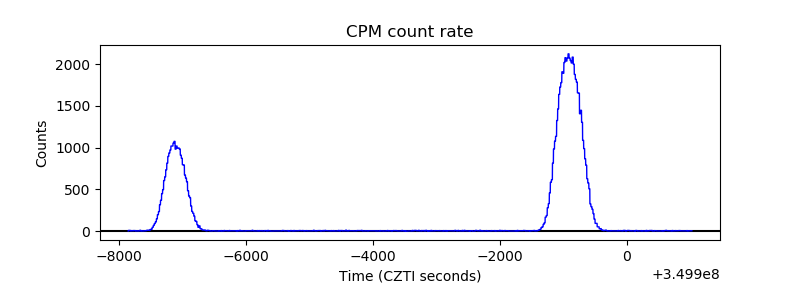 |
| CZT Counter | 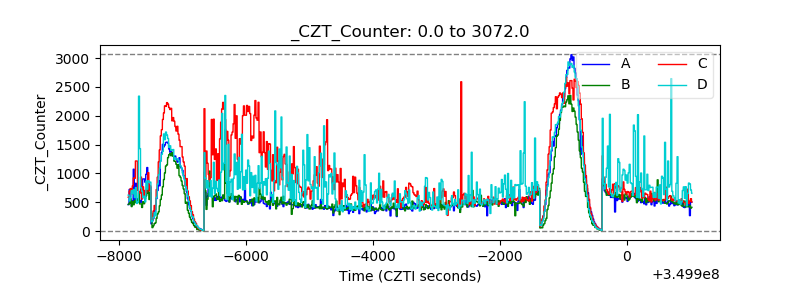 |
| +2.5 Volts monitor |  |
| +5 Volts monitor |  |
| _ROLL_ROT | 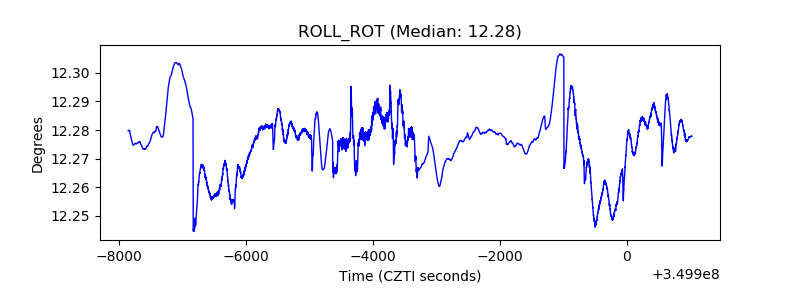 |
| _Roll_DEC | 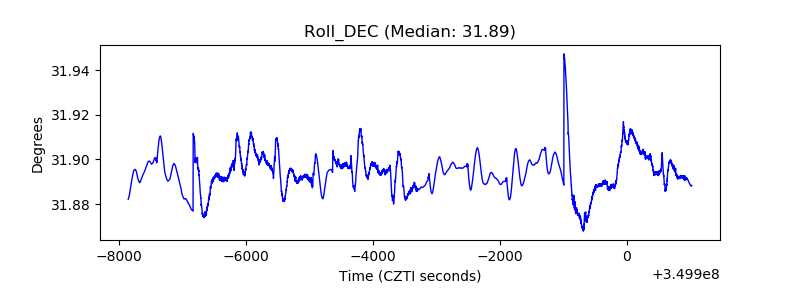 |
| _Roll_RA | 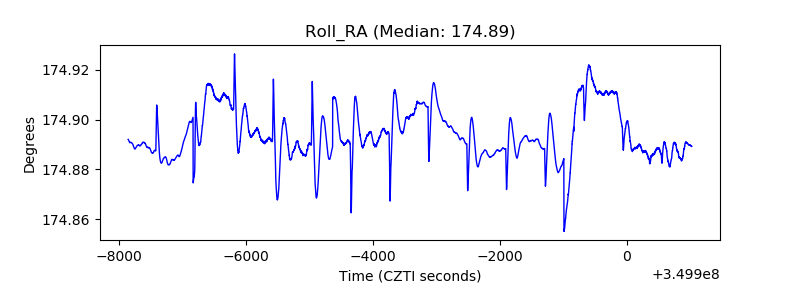 |
| Veto Counter | 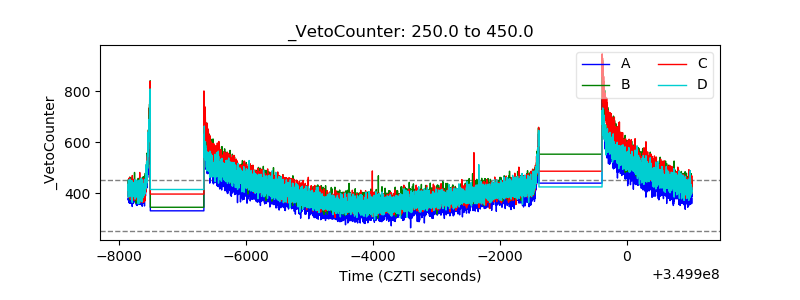 |