| Param | Original file | Final file |
|---|---|---|
| Filename | modeM0/AS1A10_064T02_9000004146_28918cztM0_level2.evt | modeM0/AS1A10_064T02_9000004146_28918cztM0_level2_quad_clean.evt |
| Size (bytes) | 186,024,960 | 27,878,400 |
| Size | 177.4 MB | 26.6 MB |
| Events in quadrant A | 1,081,000 | 174,572 |
| Events in quadrant B | 1,112,261 | 181,043 |
| Events in quadrant C | 1,251,593 | 172,725 |
| Events in quadrant D | 2,045,399 | 164,179 |
| Mode M9 | |||
|---|---|---|---|
| Quadrant | BADHDUFLAG | Total packets | Discarded packets |
| A | 0 | 10 | 0 |
| B | 0 | 10 | 0 |
| C | 0 | 10 | 0 |
| D | 0 | 10 | 0 |
| Mode M0 | |||
|---|---|---|---|
| Quadrant | BADHDUFLAG | Total packets | Discarded packets |
| A | 0 | 4521 | 1 |
| B | 0 | 4619 | 1 |
| C | 0 | 5174 | 1 |
| D | 0 | 7553 | 1 |
| Mode SS | |||
|---|---|---|---|
| Quadrant | BADHDUFLAG | Total packets | Discarded packets |
| A | 0 | 44 | 0 |
| B | 0 | 44 | 0 |
| C | 0 | 44 | 0 |
| D | 0 | 44 | 0 |
| Quadrant | Total seconds | Saturated seconds | Saturation percentage |
|---|---|---|---|
| A | 2081 | 21 | 1.009130% |
| B | 2081 | 31 | 1.489668% |
| C | 2081 | 71 | 3.411821% |
| D | 2082 | 135 | 6.484150% |
Noise dominated data is calculated using 1-second bins in cleaned event files. If a bin has >2000 counts, and if more than 50% of those come from <1% of pixels, then it is considered to be noise-dominated and hence unusable.
| Quadrant | # 1 sec bins | Bins with >0 counts | Bins with >2000 counts | High rate bins dominated by noise | Noise dominated (total time) | Noise dominated (detector-on time) | Marked lightcurve |
|---|---|---|---|---|---|---|---|
| A | 3076 | 2082 | 0 | 0 | 0.00% | 0.00% | 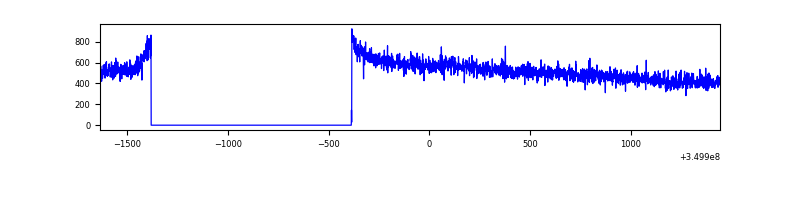 |
| B | 3076 | 2082 | 0 | 0 | 0.00% | 0.00% | 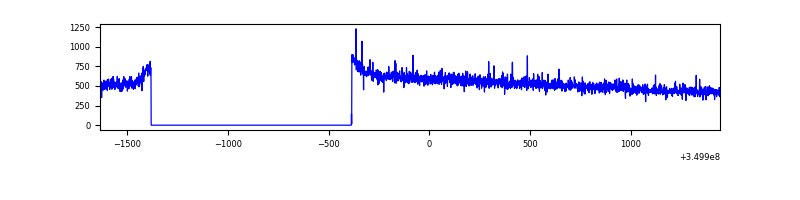 |
| C | 3076 | 2082 | 0 | 0 | 0.00% | 0.00% | 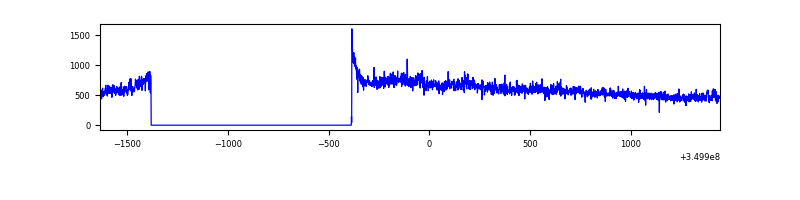 |
| D | 3077 | 2083 | 115 | 115 | 3.74% | 5.52% | 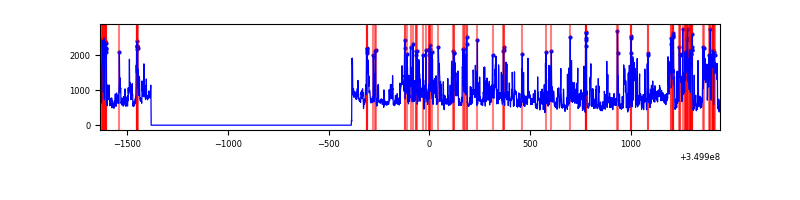 |
Top three noisy pixels from each quadrant. If the there are fewer than three noisy pixels in the level2.evt file, extra rows are filled as -1
| Pixel properties | Quadrant properties | ||||||
|---|---|---|---|---|---|---|---|
| Quadrant | DetID | PixID | Counts | Sigma | Mean | Median | Sigma |
| A | 13 | 254 | 4255 | 69.02 | 279 | 272 | 57.7 |
| A | 3 | 137 | 2748 | 42.9 | 279 | 272 | 57.7 |
| A | 13 | 6 | 2694 | 41.97 | 279 | 272 | 57.7 |
| B | 12 | 111 | 6592 | 113.89 | 282 | 275 | 55.5 |
| B | 11 | 111 | 5811 | 99.81 | 282 | 275 | 55.5 |
| B | 14 | 111 | 5162 | 88.11 | 282 | 275 | 55.5 |
| C | 3 | 233 | 123675 | 1861.83 | 275 | 276 | 66.3 |
| C | 14 | 238 | 45266 | 678.8 | 275 | 276 | 66.3 |
| C | 2 | 114 | 5066 | 72.27 | 275 | 276 | 66.3 |
| D | 8 | 195 | 777102 | 11694.36 | 271 | 263 | 66.4 |
| D | 1 | 52 | 195892 | 2944.96 | 271 | 263 | 66.4 |
| D | 12 | 233 | 15928 | 235.82 | 271 | 263 | 66.4 |
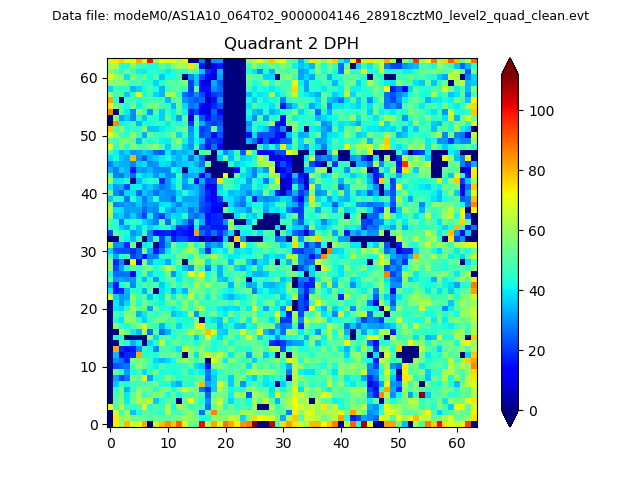
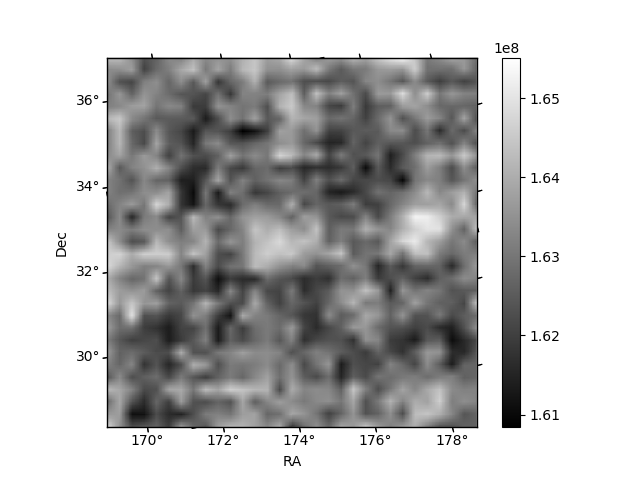
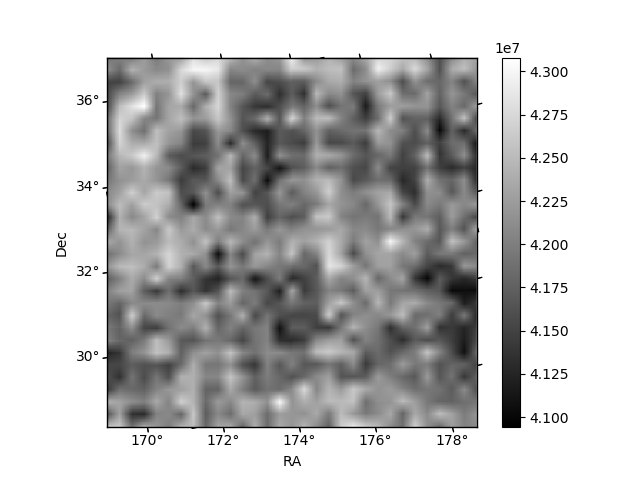
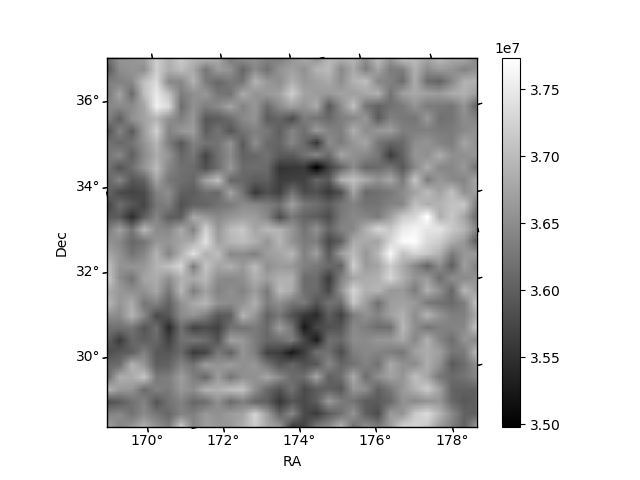
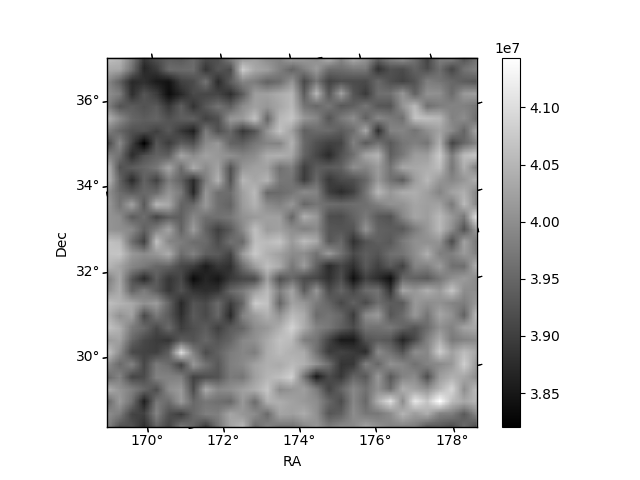
Histogram calculated using DETX and DETY for each event in the final _common_clean file
| Quadrant A | 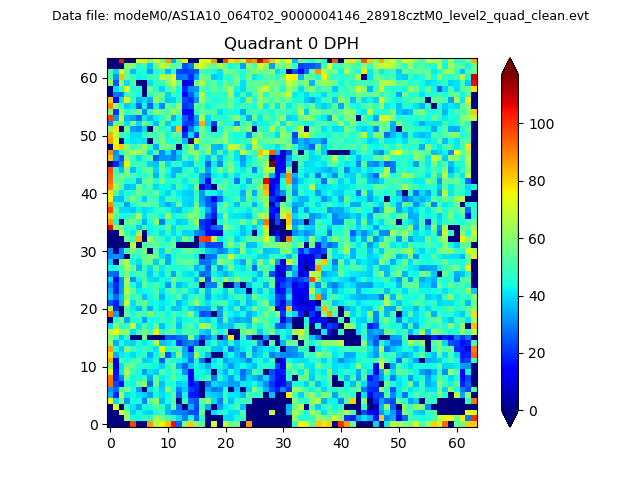 |
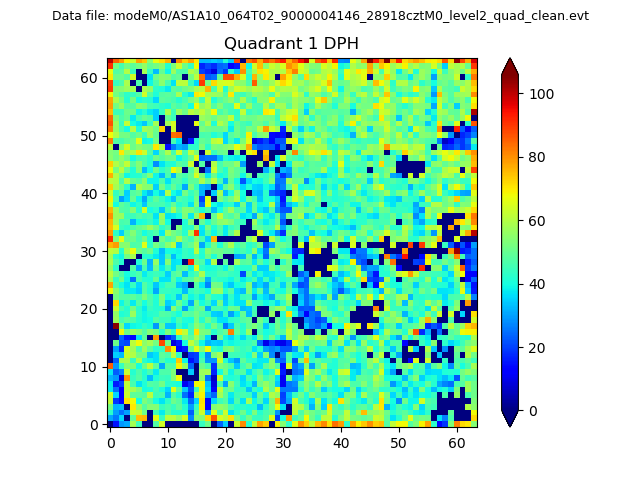 |
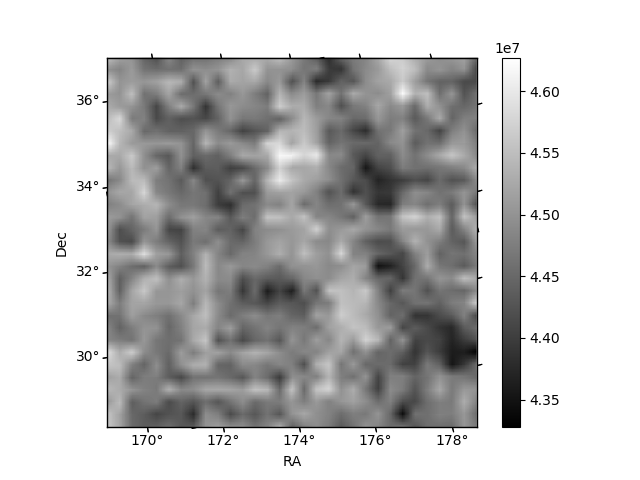
Quadrant B |
|---|---|---|---|
| Quadrant D | 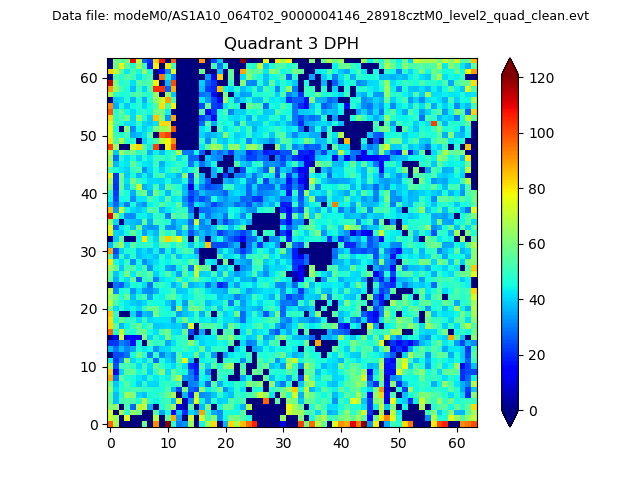 |
 |
Quadrant C |
| Plot type | Count rate plots | Images |
|---|---|---|
| Comparison with Poisson distribution Blue bars denote a histogram of data divided into 1 sec bins. Red curve is a Poisson curve with rate = median count rate of data. |
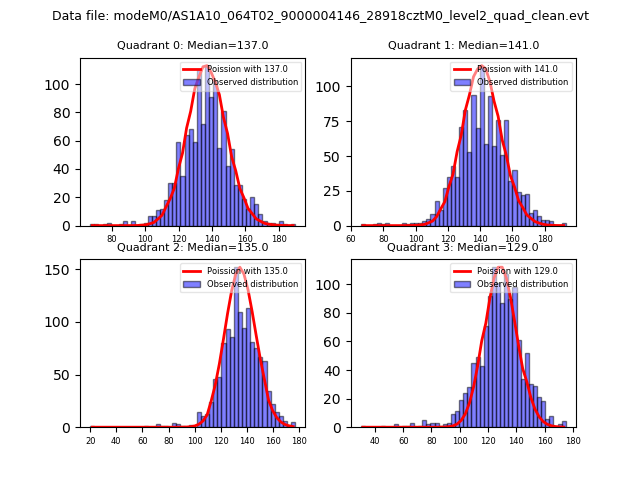 |
 |
| Quadrant-wise count rates Data is divided into 100 sec bins |
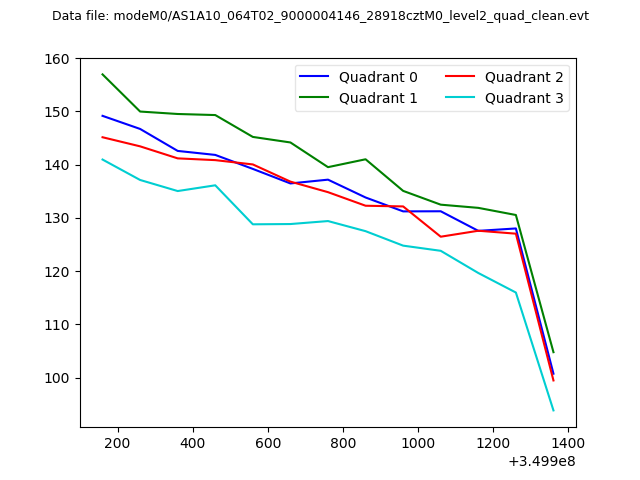 |
|
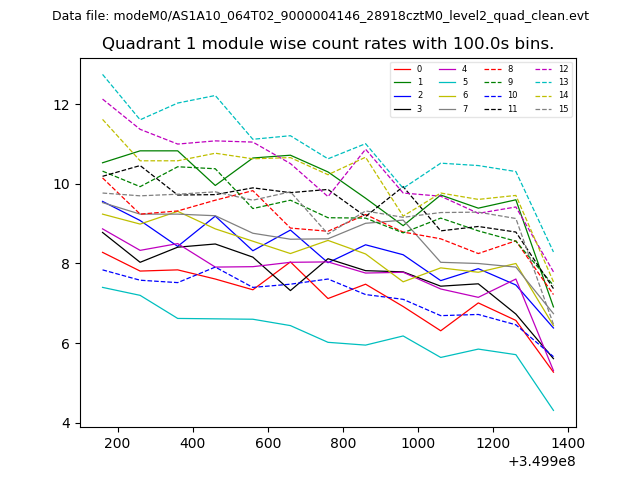
| Module-wise count rates for Quadrant A Data is divided into 100 sec bins |
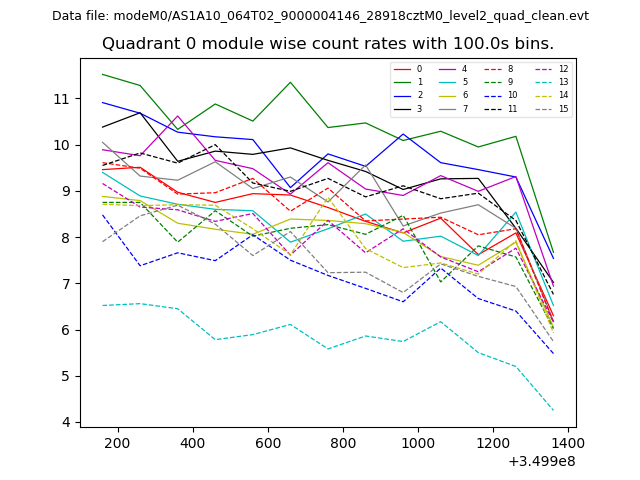 |
 |
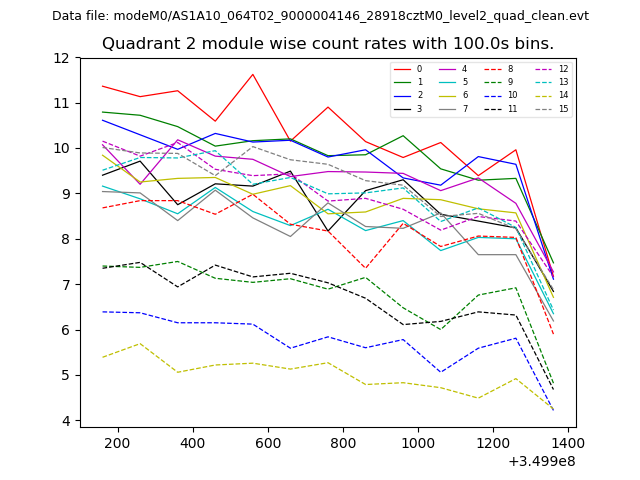
| Module-wise count rates for Quadrant B Data is divided into 100 sec bins |
 |
 |
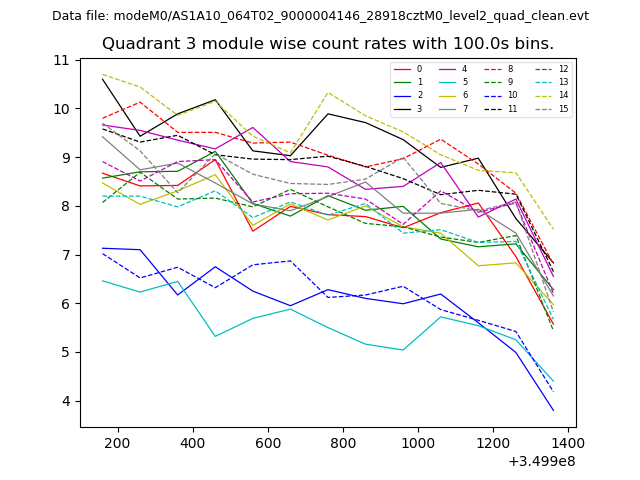
| Module-wise count rates for Quadrant C Data is divided into 100 sec bins |
 |
 |
| Module-wise count rates for Quadrant D Data is divided into 100 sec bins |
 |
 |
| Parameter | Plot |
|---|---|
| CZT HV Monitor | 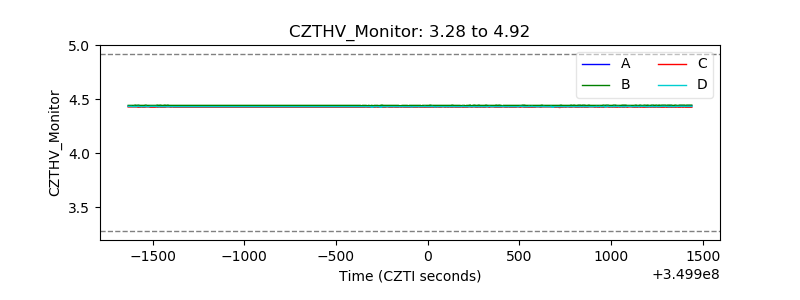 |
| D_VDD | 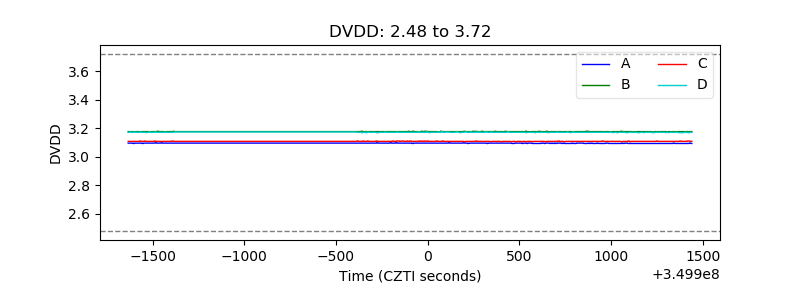 |
| Temperature 1 | 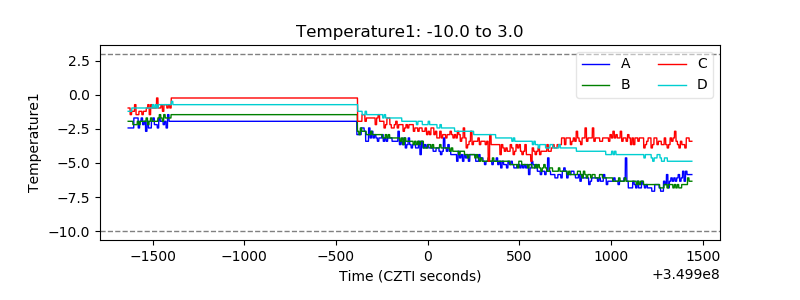 |
| Veto HV Monitor | 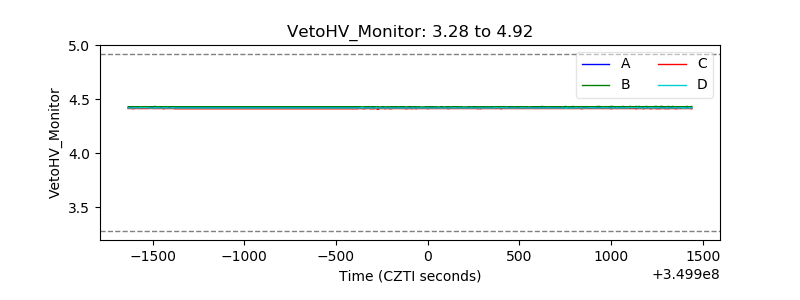 |
| Veto LLD | 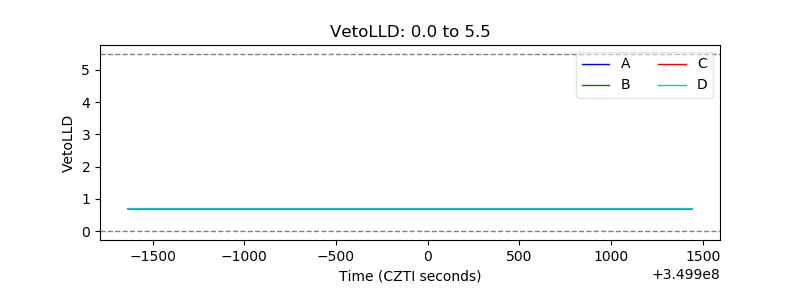 |
| Alpha Counter | 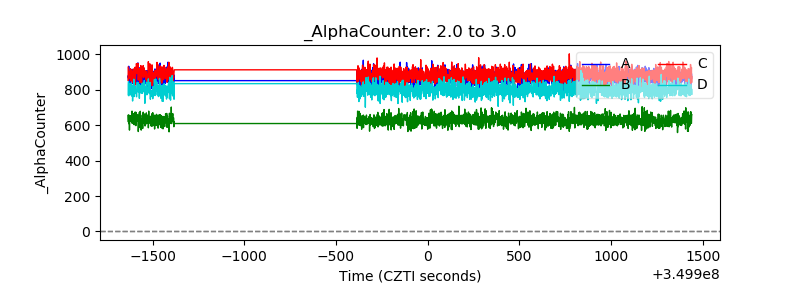 |
| _CPM_Rate | 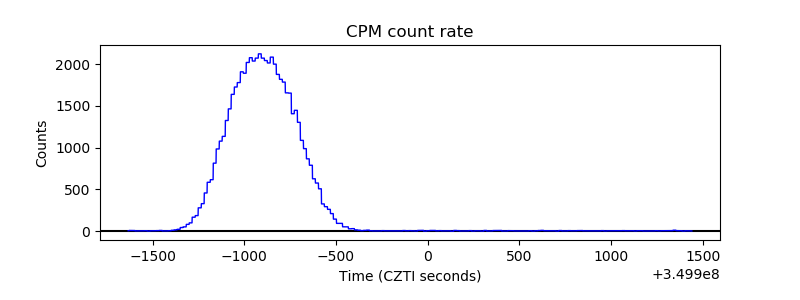 |
| CZT Counter | 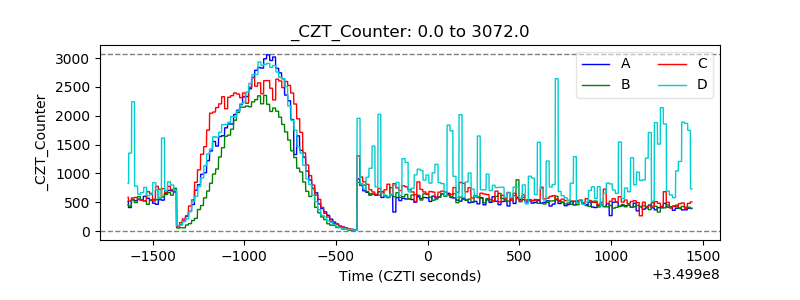 |
| +2.5 Volts monitor |  |
| +5 Volts monitor |  |
| _ROLL_ROT |  |
| _Roll_DEC | 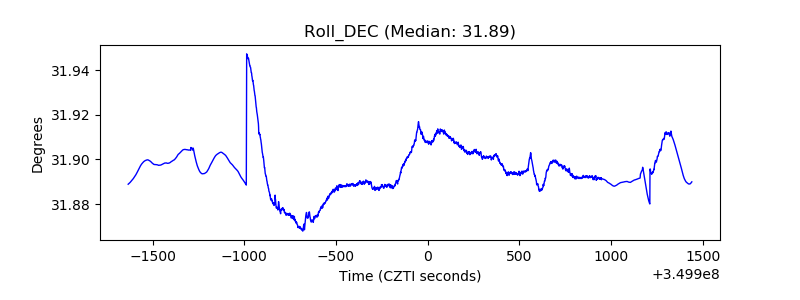 |
| _Roll_RA | 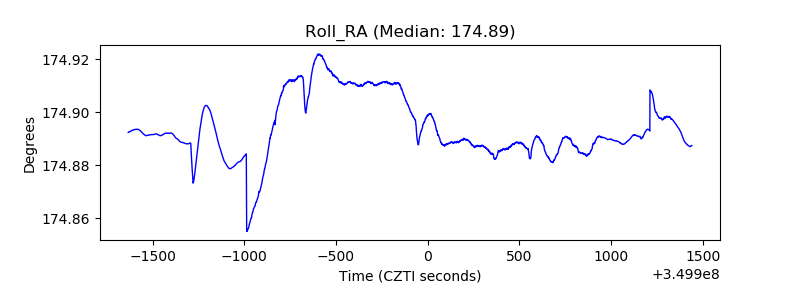 |
| Veto Counter | 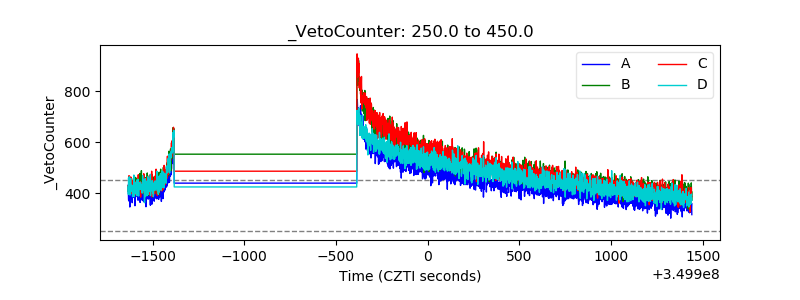 |