| Param | Original file | Final file |
|---|---|---|
| Filename | modeM0/AS1A10_082T04_9000004150cztM0_level2.fits | modeM0/AS1A10_082T04_9000004150cztM0_level2_quad_clean.evt |
| Size (bytes) | 582,914,880 | 534,479,040 |
| Size | 555.9 MB | 509.7 MB |
| Events in quadrant A | 3,640,032 | 3,263,963 |
| Events in quadrant B | 3,508,560 | 3,311,067 |
| Events in quadrant C | 3,557,596 | 3,134,534 |
| Events in quadrant D | 2,772,660 | 2,308,671 |
| Mode SS | |||
|---|---|---|---|
| Quadrant | BADHDUFLAG | Total packets | Discarded packets |
| A | 0 | 1242 | 0 |
| B | 0 | 1242 | 0 |
| C | 0 | 1242 | 0 |
| D | 0 | 1242 | 0 |
| Mode M0 | |||
|---|---|---|---|
| Quadrant | BADHDUFLAG | Total packets | Discarded packets |
| A | 0 | 126225 | 0 |
| B | 0 | 128380 | 0 |
| C | 0 | 129995 | 0 |
| D | 0 | 253803 | 0 |
| Mode M9 | |||
|---|---|---|---|
| Quadrant | BADHDUFLAG | Total packets | Discarded packets |
| A | 0 | 87 | 0 |
| B | 0 | 87 | 0 |
| C | 0 | 87 | 0 |
| D | 0 | 87 | 0 |
| Quadrant | Total seconds | Saturated seconds | Saturation percentage |
|---|---|---|---|
| A | 60750 | 642 | 1.056790% |
| B | 60750 | 936 | 1.540741% |
| C | 60750 | 1765 | 2.905350% |
| D | 60750 | 14784 | 24.335802% |
Noise dominated data is calculated using 1-second bins in cleaned event files. If a bin has >2000 counts, and if more than 50% of those come from <1% of pixels, then it is considered to be noise-dominated and hence unusable.
| Quadrant | # 1 sec bins | Bins with >0 counts | Bins with >2000 counts | High rate bins dominated by noise | Noise dominated (total time) | Noise dominated (detector-on time) | Marked lightcurve |
|---|---|---|---|---|---|---|---|
| A | 69538 | 60745 | 0 | 0 | 0.00% | 0.00% |  |
| B | 69538 | 60743 | 0 | 0 | 0.00% | 0.00% |  |
| C | 69538 | 60691 | 0 | 0 | 0.00% | 0.00% |  |
| D | 69538 | 60668 | 0 | 0 | 0.00% | 0.00% |  |
Top three noisy pixels from each quadrant. If the there are fewer than three noisy pixels in the level2.evt file, extra rows are filled as -1
| Pixel properties | Quadrant properties | ||||||
|---|---|---|---|---|---|---|---|
| Quadrant | DetID | PixID | Counts | Sigma | Mean | Median | Sigma |
| A | 0 | 29 | 3570 | 11.54 | 947 | 890 | 232.2 |
| A | 7 | 110 | 2891 | 8.62 | 947 | 890 | 232.2 |
| A | 0 | 30 | 2774 | 8.11 | 947 | 890 | 232.2 |
| B | 2 | 9 | 2831 | 10.73 | 927 | 884 | 181.5 |
| B | 2 | 8 | 2325 | 7.94 | 927 | 884 | 181.5 |
| B | 14 | 254 | 2325 | 7.94 | 927 | 884 | 181.5 |
| C | 1 | 81 | 2750 | 7.83 | 939 | 878 | 239.2 |
| C | 1 | 80 | 2657 | 7.44 | 939 | 878 | 239.2 |
| C | 12 | 241 | 2540 | 6.95 | 939 | 878 | 239.2 |
| D | 4 | 246 | 2152 | 6.86 | 788 | 718 | 209.0 |
| D | 15 | 46 | 2114 | 6.68 | 788 | 718 | 209.0 |
| D | 6 | 231 | 2030 | 6.28 | 788 | 718 | 209.0 |
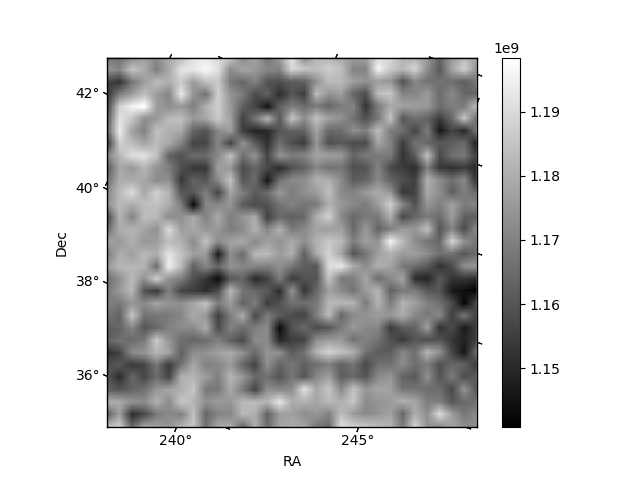
Histogram calculated using DETX and DETY for each event in the final _common_clean file
| Quadrant A | 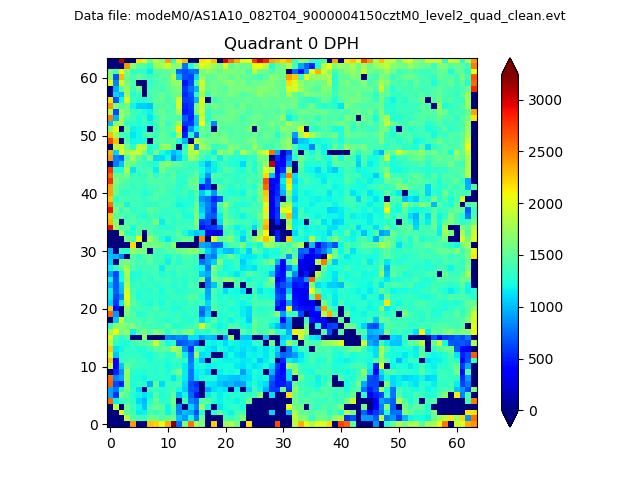 |
 |
Quadrant B |
|---|---|---|---|
| Quadrant D | 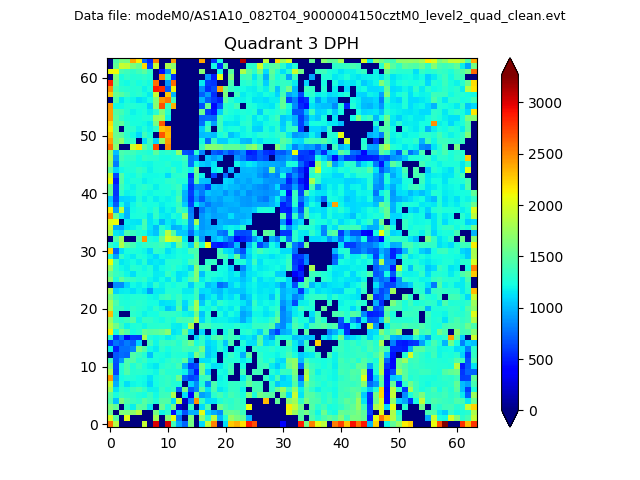 |
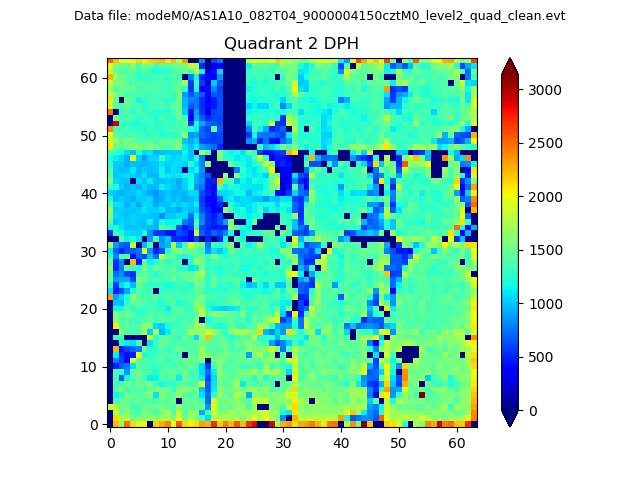 |
Quadrant C |
| Plot type | Count rate plots | Images |
|---|---|---|
| Comparison with Poisson distribution Blue bars denote a histogram of data divided into 1 sec bins. Red curve is a Poisson curve with rate = median count rate of data. |
 |
 |
| Quadrant-wise count rates Data is divided into 100 sec bins |
 |
|
| Module-wise count rates for Quadrant A Data is divided into 100 sec bins |
 |
 |
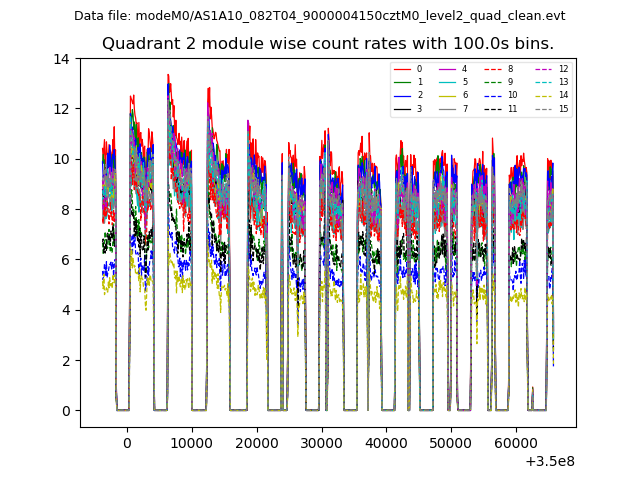
| Module-wise count rates for Quadrant B Data is divided into 100 sec bins |
 |
 |
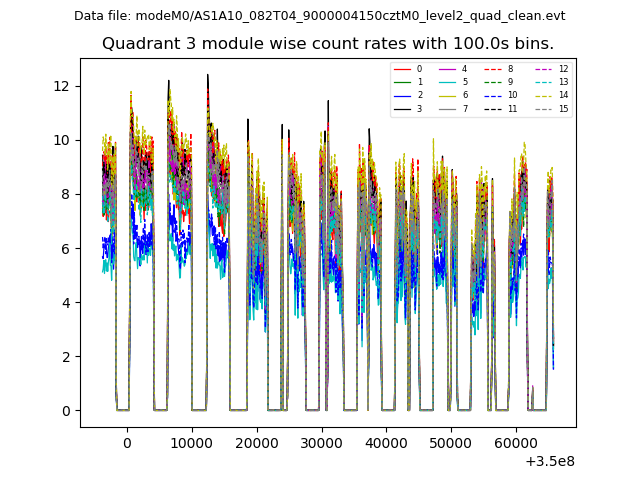
| Module-wise count rates for Quadrant C Data is divided into 100 sec bins |
 |
 |
| Module-wise count rates for Quadrant D Data is divided into 100 sec bins |
 |
 |
| Parameter | Plot |
|---|---|
| CZT HV Monitor |  |
| D_VDD | 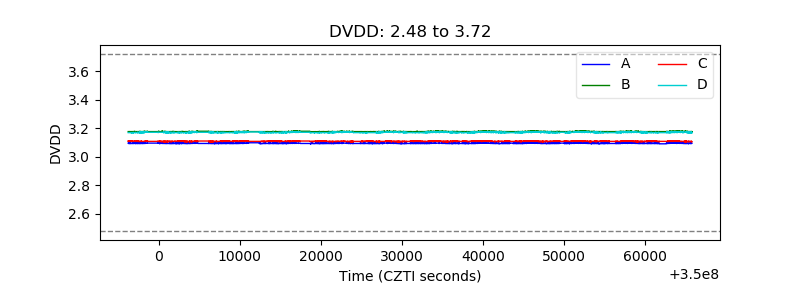 |
| Temperature 1 |  |
| Veto HV Monitor |  |
| Veto LLD |  |
| Alpha Counter |  |
| _CPM_Rate | 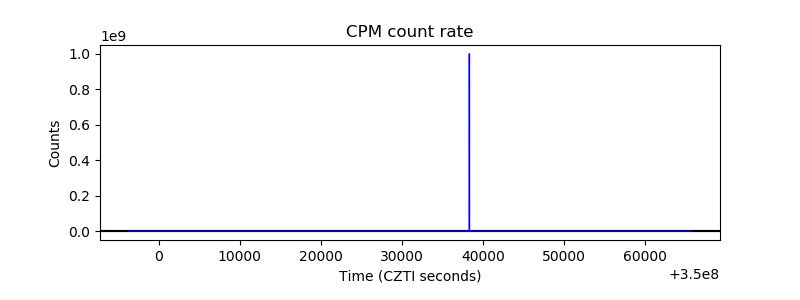 |
| CZT Counter | 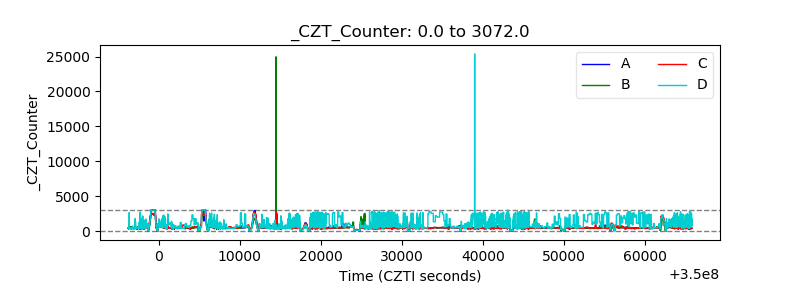 |
| +2.5 Volts monitor |  |
| +5 Volts monitor | 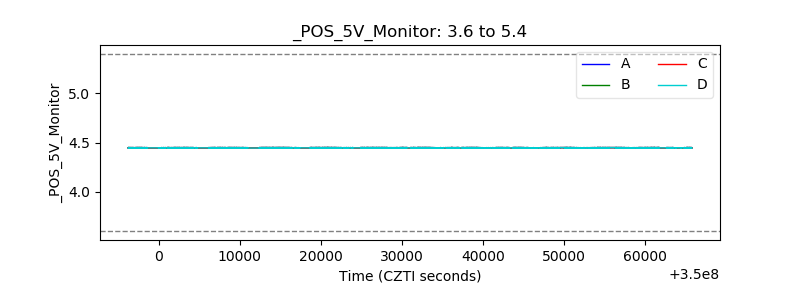 |
| _ROLL_ROT | 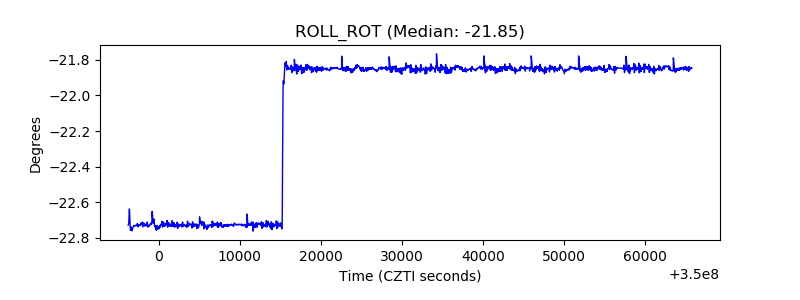 |
| _Roll_DEC | 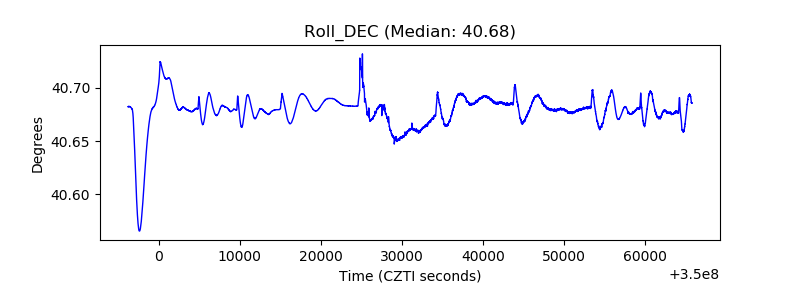 |
| _Roll_RA |  |
| Veto Counter |  |