| Param | Original file | Final file |
|---|---|---|
| Filename | modeM0/AS1A10_082T04_9000004150_28935cztM0_level2.evt | modeM0/AS1A10_082T04_9000004150_28935cztM0_level2_quad_clean.evt |
| Size (bytes) | 535,069,440 | 105,750,720 |
| Size | 510.3 MB | 100.9 MB |
| Events in quadrant A | 3,288,523 | 699,836 |
| Events in quadrant B | 3,398,918 | 726,728 |
| Events in quadrant C | 3,496,170 | 687,363 |
| Events in quadrant D | 5,591,475 | 646,433 |
| Mode SS | |||
|---|---|---|---|
| Quadrant | BADHDUFLAG | Total packets | Discarded packets |
| A | 0 | 130 | 0 |
| B | 0 | 130 | 0 |
| C | 0 | 130 | 0 |
| D | 0 | 130 | 0 |
| Mode M0 | |||
|---|---|---|---|
| Quadrant | BADHDUFLAG | Total packets | Discarded packets |
| A | 0 | 13810 | 2 |
| B | 0 | 14102 | 3 |
| C | 0 | 14453 | 2 |
| D | 0 | 20997 | 2 |
| Mode M9 | |||
|---|---|---|---|
| Quadrant | BADHDUFLAG | Total packets | Discarded packets |
| A | 0 | 26 | 0 |
| B | 0 | 26 | 0 |
| C | 0 | 26 | 0 |
| D | 0 | 26 | 0 |
| Quadrant | Total seconds | Saturated seconds | Saturation percentage |
|---|---|---|---|
| A | 6341 | 70 | 1.103927% |
| B | 6341 | 95 | 1.498186% |
| C | 6341 | 271 | 4.273774% |
| D | 6341 | 435 | 6.860117% |
Noise dominated data is calculated using 1-second bins in cleaned event files. If a bin has >2000 counts, and if more than 50% of those come from <1% of pixels, then it is considered to be noise-dominated and hence unusable.
| Quadrant | # 1 sec bins | Bins with >0 counts | Bins with >2000 counts | High rate bins dominated by noise | Noise dominated (total time) | Noise dominated (detector-on time) | Marked lightcurve |
|---|---|---|---|---|---|---|---|
| A | 8916 | 6343 | 0 | 0 | 0.00% | 0.00% | 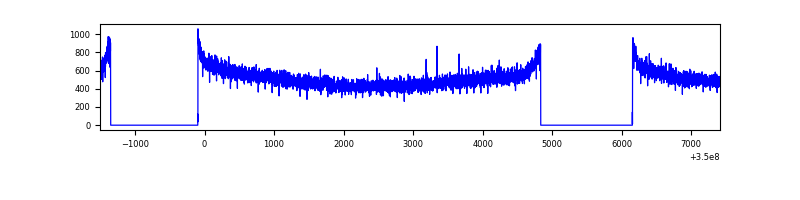 |
| B | 8916 | 6343 | 2 | 2 | 0.02% | 0.03% | 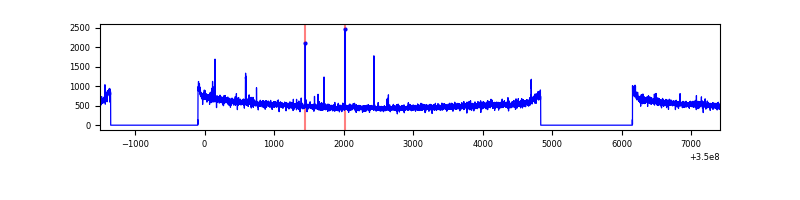 |
| C | 8916 | 6343 | 0 | 0 | 0.00% | 0.00% | 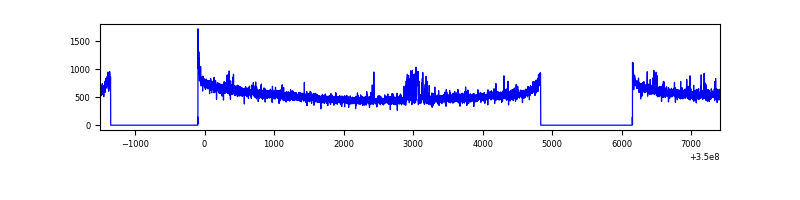 |
| D | 8916 | 6343 | 334 | 334 | 3.75% | 5.27% | 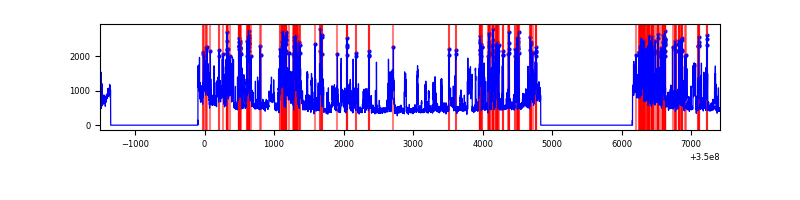 |
Top three noisy pixels from each quadrant. If the there are fewer than three noisy pixels in the level2.evt file, extra rows are filled as -1
| Pixel properties | Quadrant properties | ||||||
|---|---|---|---|---|---|---|---|
| Quadrant | DetID | PixID | Counts | Sigma | Mean | Median | Sigma |
| A | 13 | 254 | 10996 | 59.54 | 851 | 835 | 170.7 |
| A | 3 | 137 | 7951 | 41.7 | 851 | 835 | 170.7 |
| A | 0 | 226 | 7220 | 37.41 | 851 | 835 | 170.7 |
| B | 5 | 255 | 20085 | 120.86 | 857 | 837 | 159.3 |
| B | 12 | 111 | 19161 | 115.06 | 857 | 837 | 159.3 |
| B | 11 | 111 | 17509 | 104.69 | 857 | 837 | 159.3 |
| C | 14 | 238 | 177399 | 929.98 | 823 | 831 | 189.9 |
| C | 14 | 254 | 57698 | 299.52 | 823 | 831 | 189.9 |
| C | 3 | 233 | 24911 | 126.83 | 823 | 831 | 189.9 |
| D | 8 | 195 | 2405122 | 12633.28 | 812 | 793 | 190.3 |
| D | 1 | 52 | 50238 | 259.8 | 812 | 793 | 190.3 |
| D | 12 | 79 | 44323 | 228.72 | 812 | 793 | 190.3 |
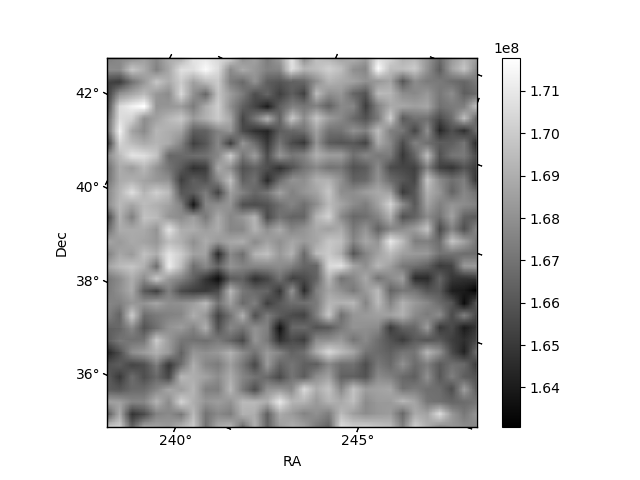
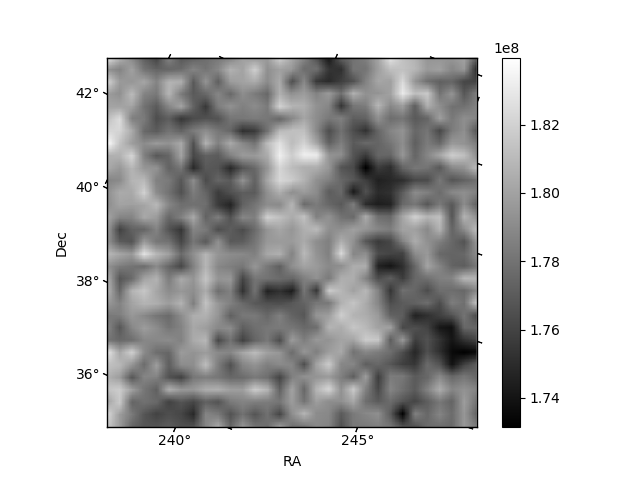
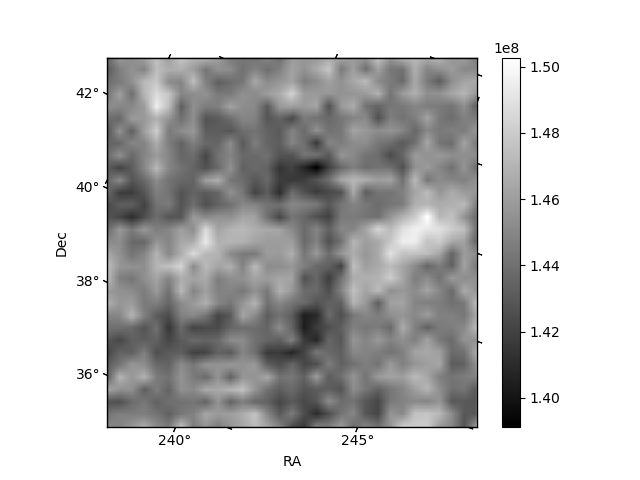
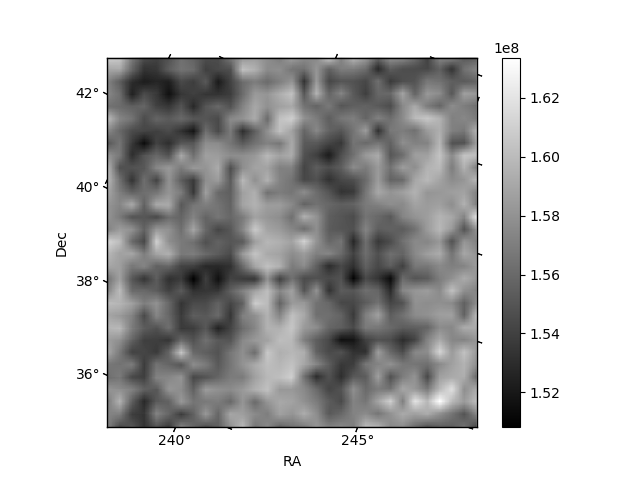
Histogram calculated using DETX and DETY for each event in the final _common_clean file
| Quadrant A |  |
 |
Quadrant B |
|---|---|---|---|
| Quadrant D |  |
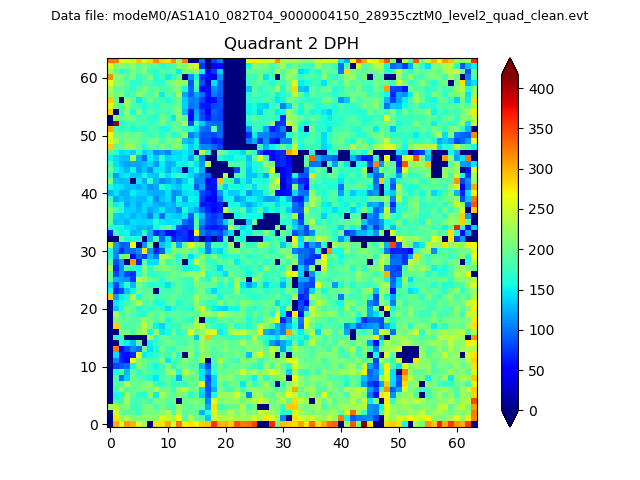 |
Quadrant C |
| Plot type | Count rate plots | Images |
|---|---|---|
| Comparison with Poisson distribution Blue bars denote a histogram of data divided into 1 sec bins. Red curve is a Poisson curve with rate = median count rate of data. |
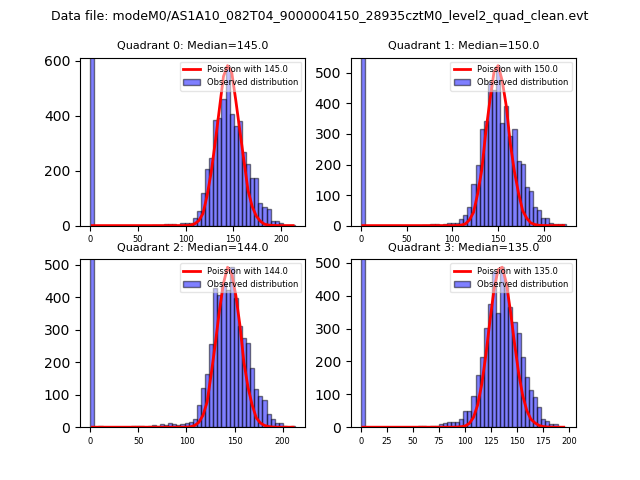 |
 |
| Quadrant-wise count rates Data is divided into 100 sec bins |
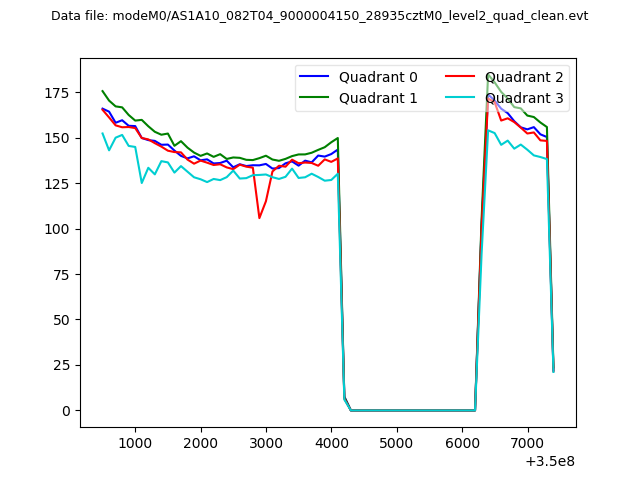 |
|
| Module-wise count rates for Quadrant A Data is divided into 100 sec bins |
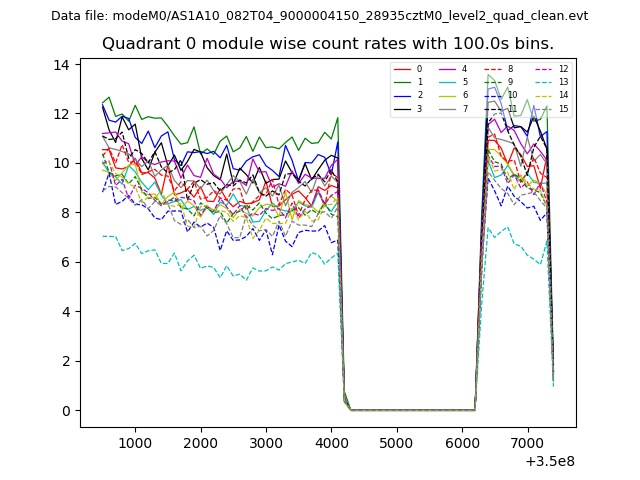 |
 |
| Module-wise count rates for Quadrant B Data is divided into 100 sec bins |
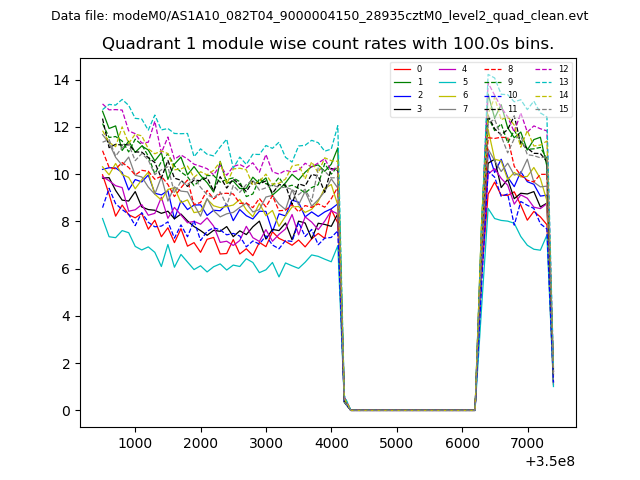 |
 |
| Module-wise count rates for Quadrant C Data is divided into 100 sec bins |
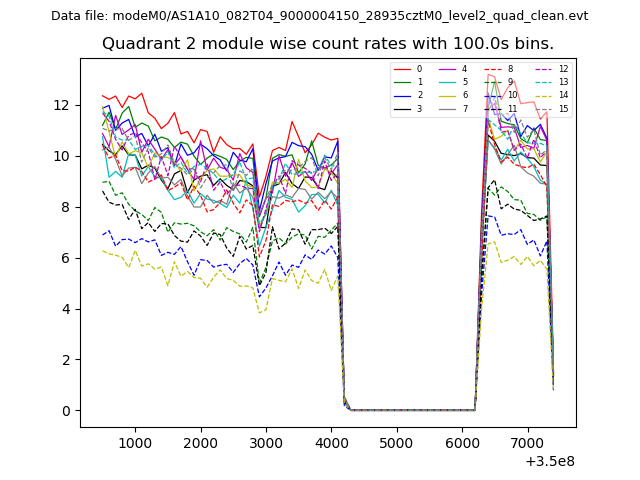 |
 |
| Module-wise count rates for Quadrant D Data is divided into 100 sec bins |
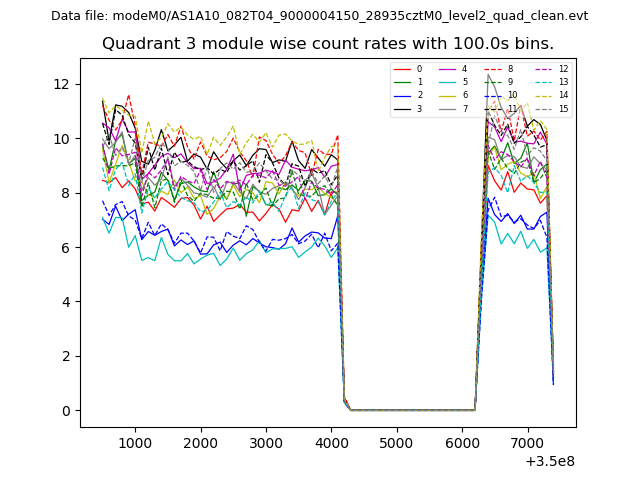 |
 |
| Parameter | Plot |
|---|---|
| CZT HV Monitor | 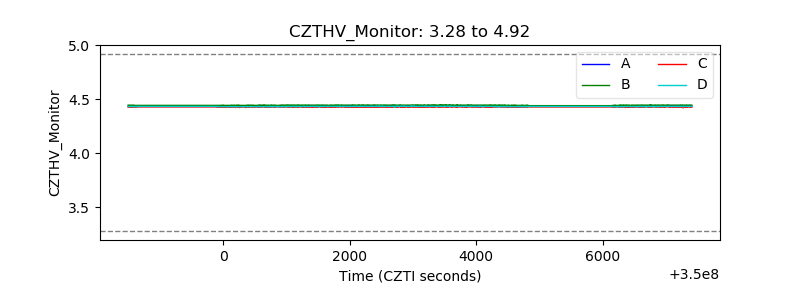 |
| D_VDD | 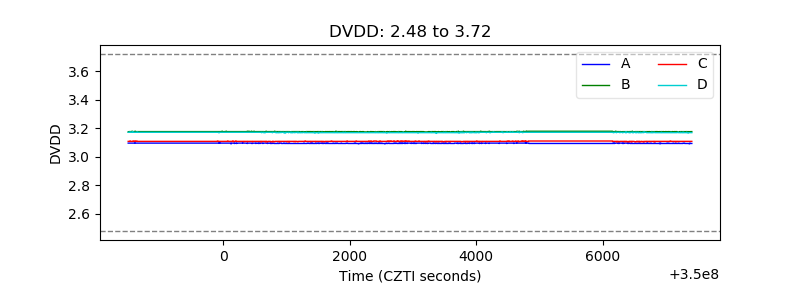 |
| Temperature 1 | 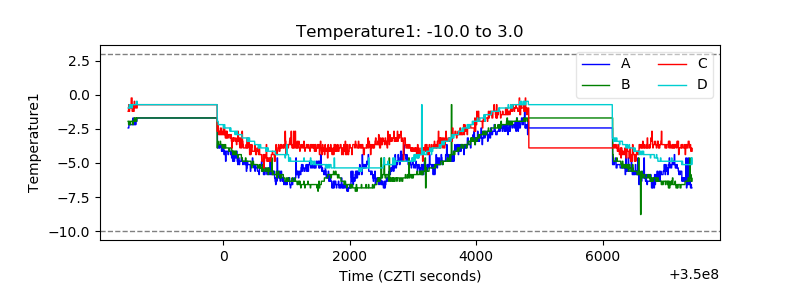 |
| Veto HV Monitor | 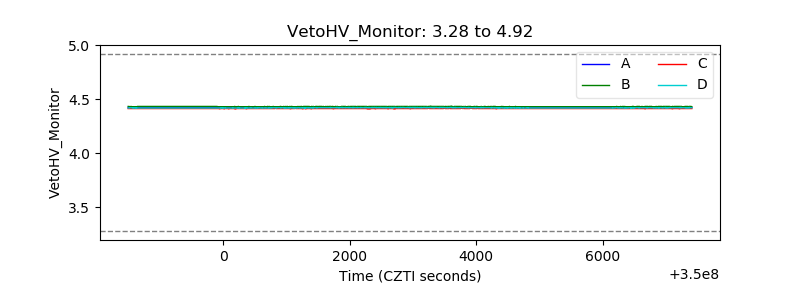 |
| Veto LLD | 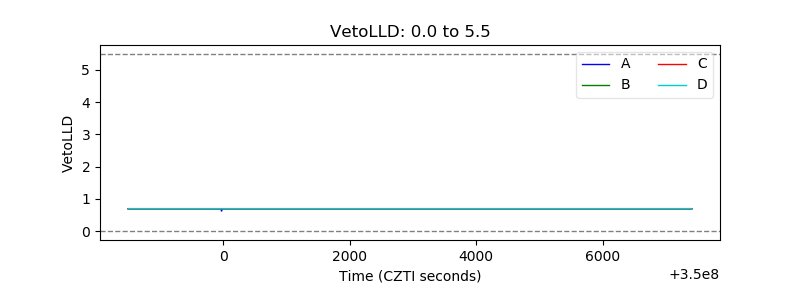 |
| Alpha Counter | 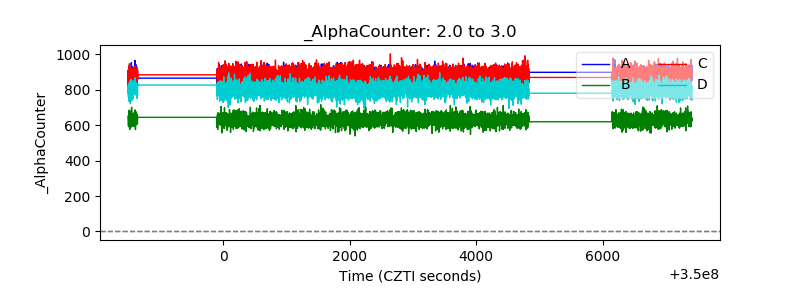 |
| _CPM_Rate | 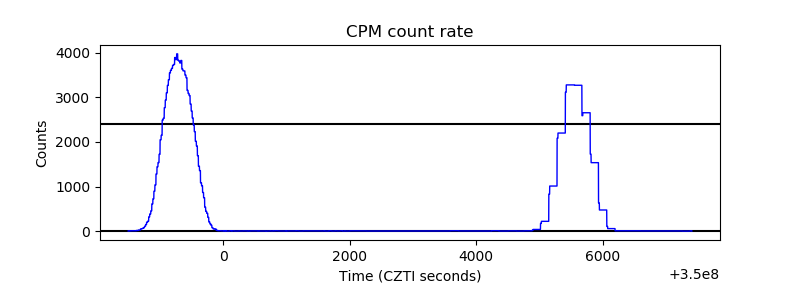 |
| CZT Counter | 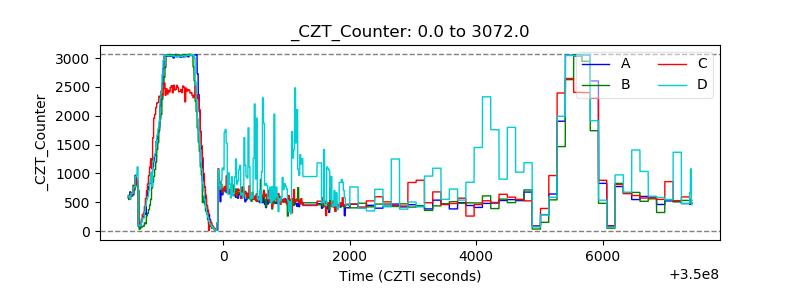 |
| +2.5 Volts monitor |  |
| +5 Volts monitor |  |
| _ROLL_ROT | 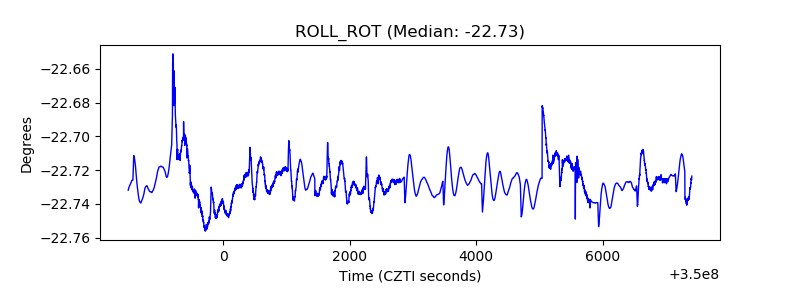 |
| _Roll_DEC | 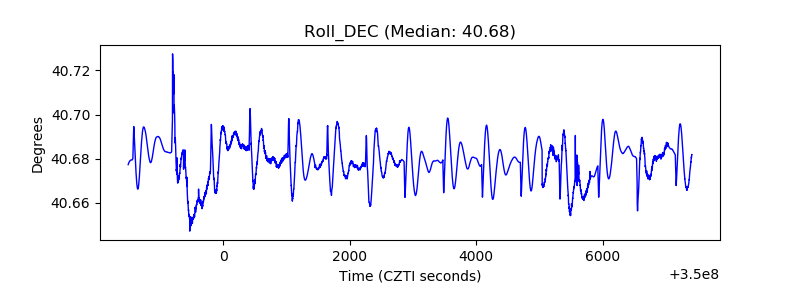 |
| _Roll_RA | 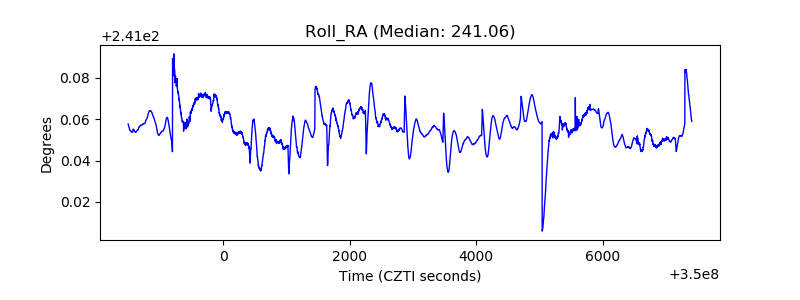 |
| Veto Counter | 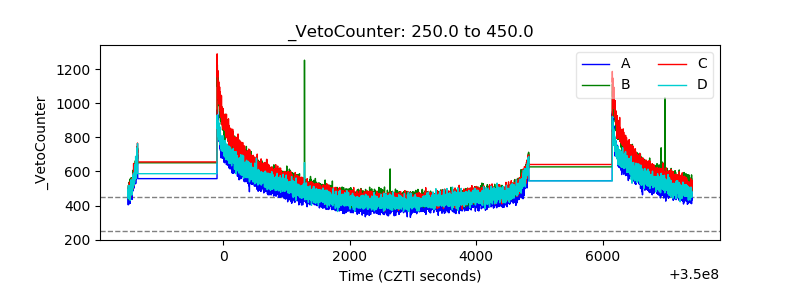 |