| Param | Original file | Final file |
|---|---|---|
| Filename | modeM0/AS1A10_082T04_9000004150_28936cztM0_level2.evt | modeM0/AS1A10_082T04_9000004150_28936cztM0_level2_quad_clean.evt |
| Size (bytes) | 513,720,000 | 111,070,080 |
| Size | 489.9 MB | 105.9 MB |
| Events in quadrant A | 3,163,029 | 736,408 |
| Events in quadrant B | 3,241,763 | 768,951 |
| Events in quadrant C | 3,684,587 | 728,224 |
| Events in quadrant D | 5,039,398 | 688,777 |
| Mode SS | |||
|---|---|---|---|
| Quadrant | BADHDUFLAG | Total packets | Discarded packets |
| A | 0 | 130 | 0 |
| B | 0 | 130 | 0 |
| C | 0 | 130 | 0 |
| D | 0 | 130 | 0 |
| Mode M0 | |||
|---|---|---|---|
| Quadrant | BADHDUFLAG | Total packets | Discarded packets |
| A | 0 | 13369 | 2 |
| B | 0 | 13551 | 2 |
| C | 0 | 15084 | 2 |
| D | 0 | 19359 | 2 |
| Mode M9 | |||
|---|---|---|---|
| Quadrant | BADHDUFLAG | Total packets | Discarded packets |
| A | 0 | 15 | 0 |
| B | 0 | 16 | 0 |
| C | 0 | 16 | 0 |
| D | 0 | 16 | 0 |
| Quadrant | Total seconds | Saturated seconds | Saturation percentage |
|---|---|---|---|
| A | 6321 | 31 | 0.490429% |
| B | 6321 | 55 | 0.870115% |
| C | 6321 | 140 | 2.214839% |
| D | 6321 | 353 | 5.584559% |
Noise dominated data is calculated using 1-second bins in cleaned event files. If a bin has >2000 counts, and if more than 50% of those come from <1% of pixels, then it is considered to be noise-dominated and hence unusable.
| Quadrant | # 1 sec bins | Bins with >0 counts | Bins with >2000 counts | High rate bins dominated by noise | Noise dominated (total time) | Noise dominated (detector-on time) | Marked lightcurve |
|---|---|---|---|---|---|---|---|
| A | 7636 | 6322 | 0 | 0 | 0.00% | 0.00% | 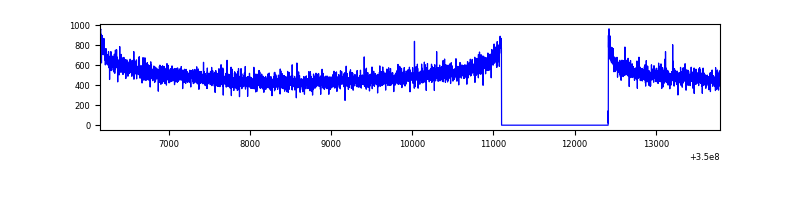 |
| B | 7636 | 6322 | 0 | 0 | 0.00% | 0.00% | 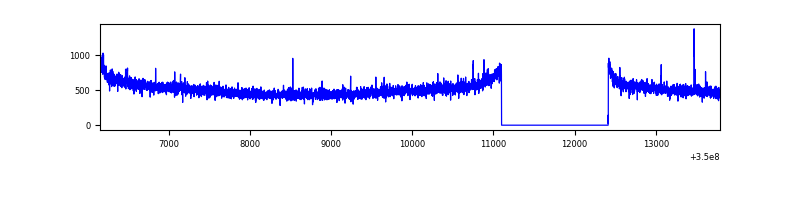 |
| C | 7636 | 6322 | 0 | 0 | 0.00% | 0.00% |  |
| D | 7636 | 6322 | 301 | 301 | 3.94% | 4.76% | 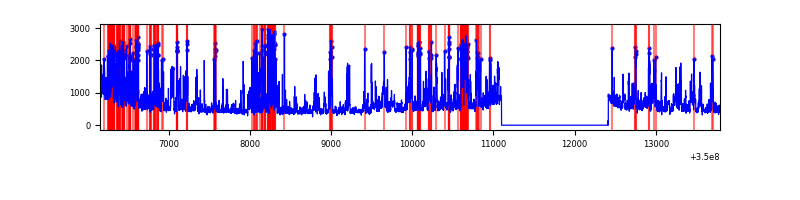 |
Top three noisy pixels from each quadrant. If the there are fewer than three noisy pixels in the level2.evt file, extra rows are filled as -1
| Pixel properties | Quadrant properties | ||||||
|---|---|---|---|---|---|---|---|
| Quadrant | DetID | PixID | Counts | Sigma | Mean | Median | Sigma |
| A | 13 | 254 | 10569 | 59.87 | 818 | 804 | 163.1 |
| A | 5 | 98 | 8435 | 46.79 | 818 | 804 | 163.1 |
| A | 3 | 137 | 7753 | 42.61 | 818 | 804 | 163.1 |
| B | 12 | 111 | 18436 | 114.65 | 824 | 805 | 153.8 |
| B | 11 | 111 | 16745 | 103.66 | 824 | 805 | 153.8 |
| B | 14 | 111 | 15741 | 97.13 | 824 | 805 | 153.8 |
| C | 3 | 233 | 400205 | 2181.07 | 790 | 798 | 183.1 |
| C | 14 | 238 | 149118 | 809.94 | 790 | 798 | 183.1 |
| C | 14 | 254 | 27410 | 145.32 | 790 | 798 | 183.1 |
| D | 8 | 195 | 1806180 | 9757.28 | 775 | 755 | 185.0 |
| D | 2 | 250 | 202639 | 1091.07 | 775 | 755 | 185.0 |
| D | 1 | 52 | 95243 | 510.65 | 775 | 755 | 185.0 |
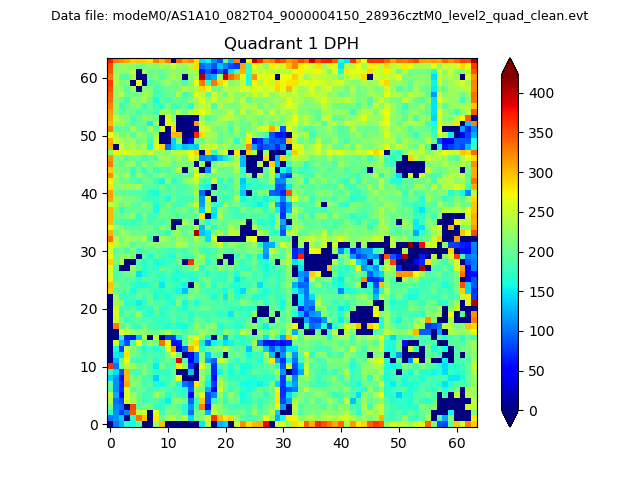
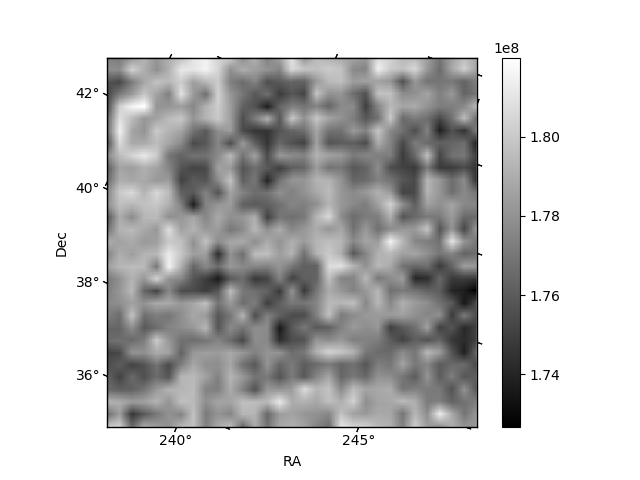
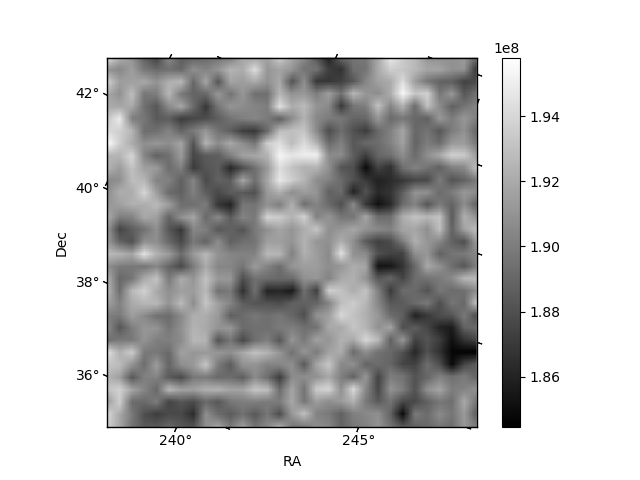
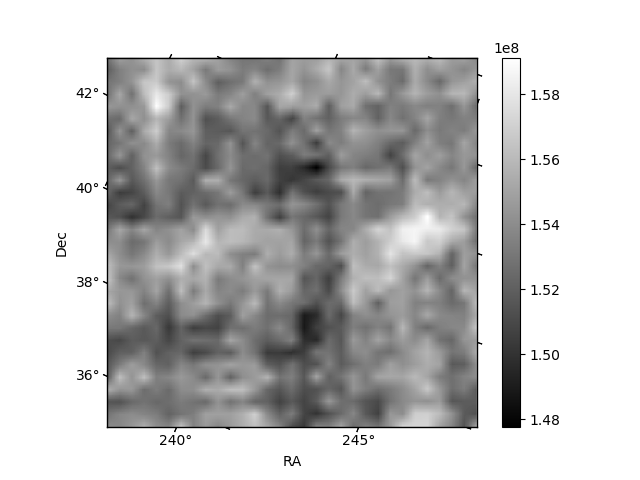
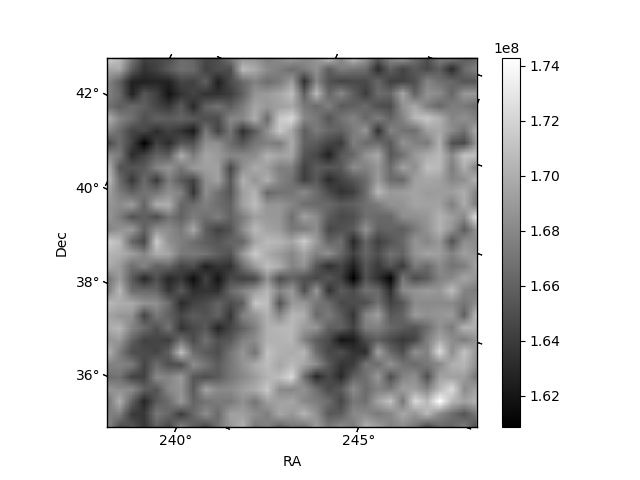
Histogram calculated using DETX and DETY for each event in the final _common_clean file
| Quadrant A | 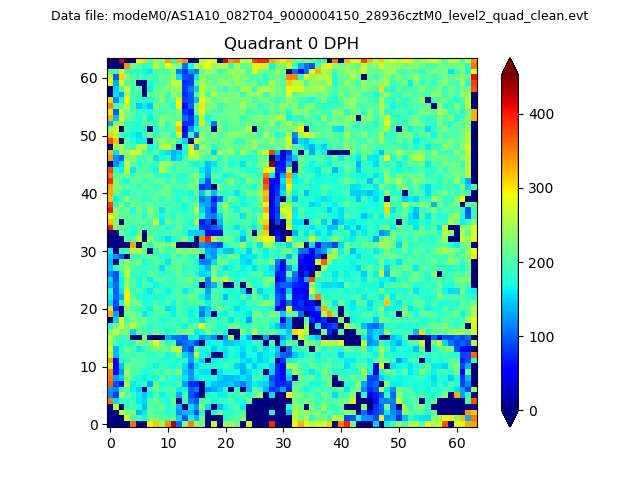 |
 |
Quadrant B |
|---|---|---|---|
| Quadrant D | 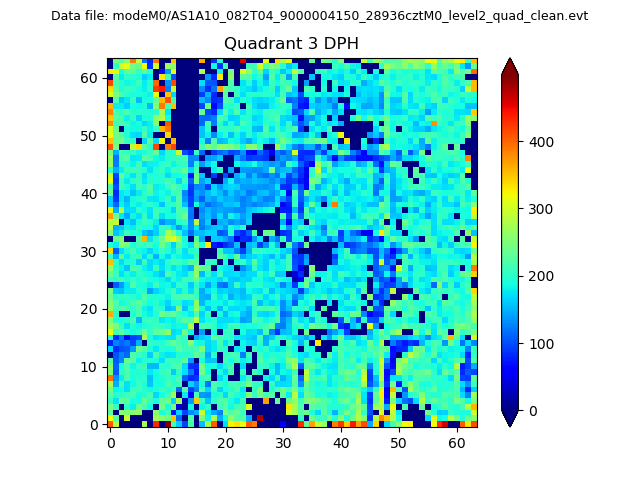 |
 |
Quadrant C |
| Plot type | Count rate plots | Images |
|---|---|---|
| Comparison with Poisson distribution Blue bars denote a histogram of data divided into 1 sec bins. Red curve is a Poisson curve with rate = median count rate of data. |
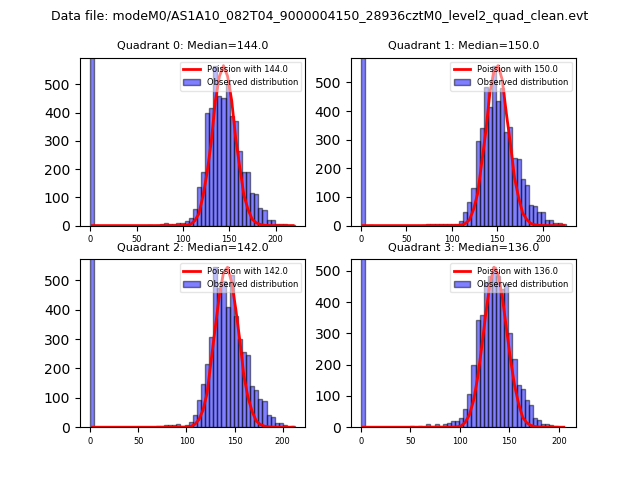 |
 |
| Quadrant-wise count rates Data is divided into 100 sec bins |
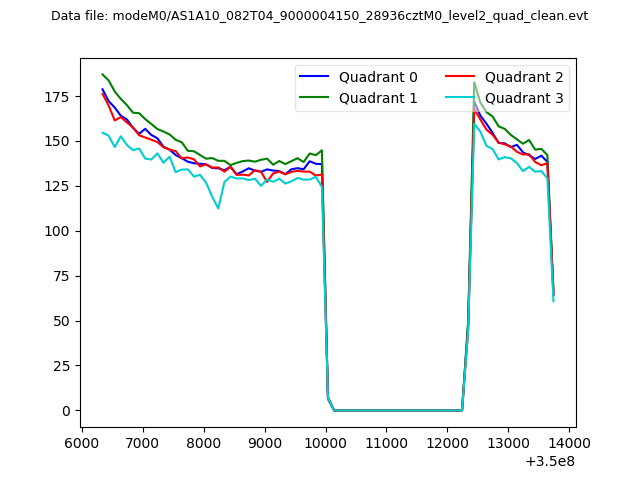 |
|
| Module-wise count rates for Quadrant A Data is divided into 100 sec bins |
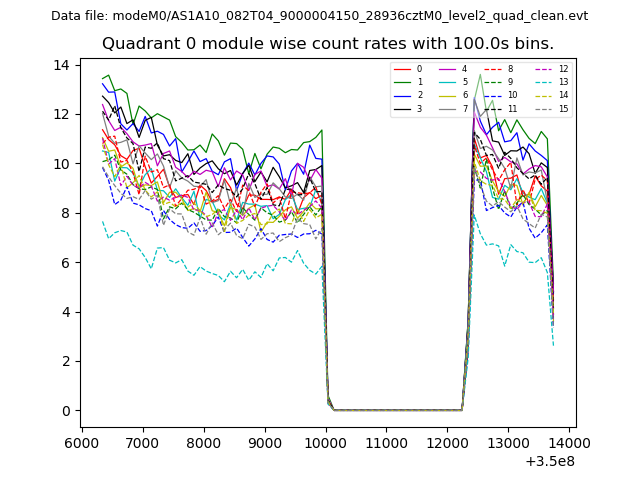 |
 |
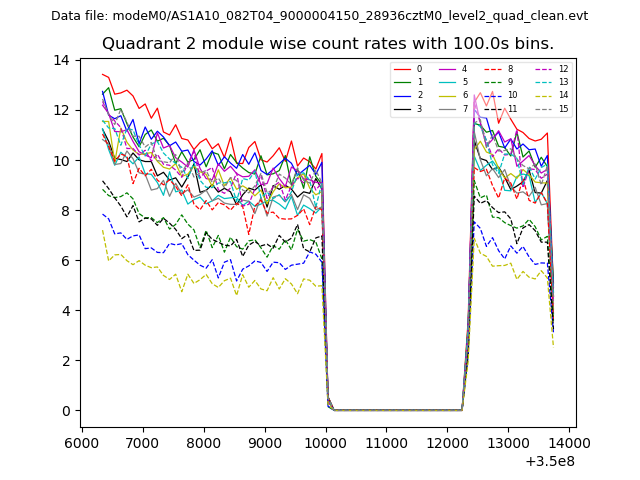
| Module-wise count rates for Quadrant B Data is divided into 100 sec bins |
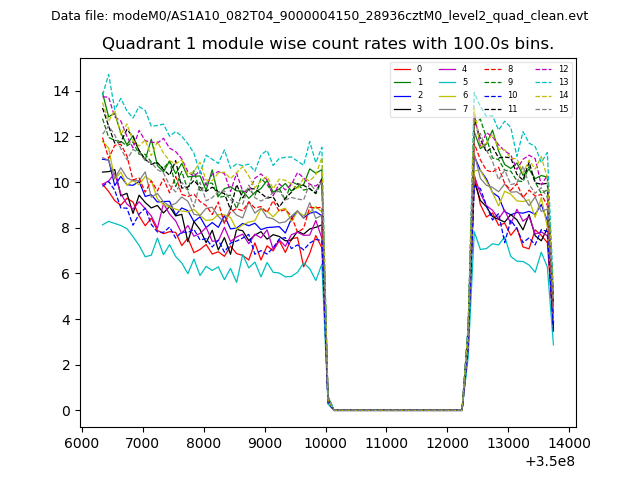 |
 |
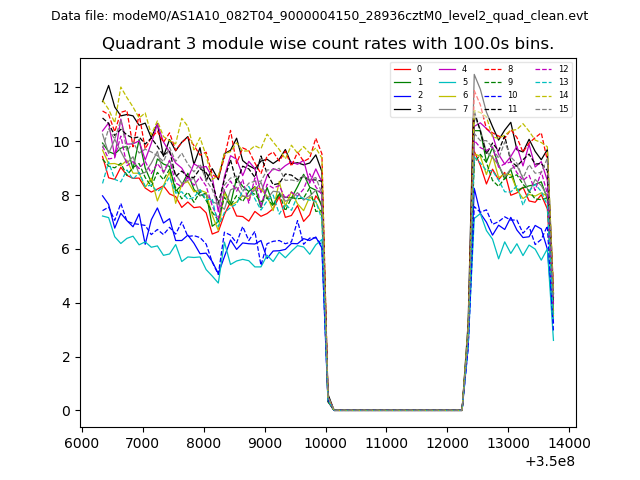
| Module-wise count rates for Quadrant C Data is divided into 100 sec bins |
 |
 |
| Module-wise count rates for Quadrant D Data is divided into 100 sec bins |
 |
 |
| Parameter | Plot |
|---|---|
| CZT HV Monitor | 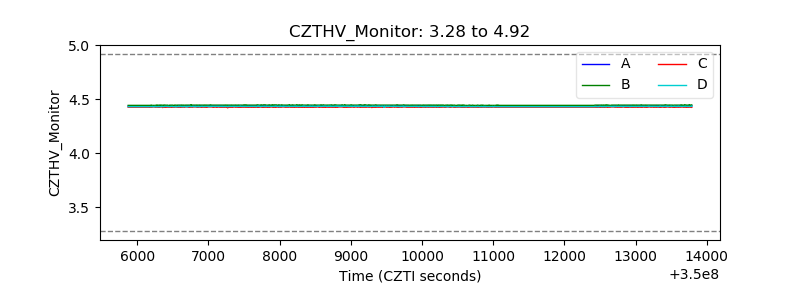 |
| D_VDD | 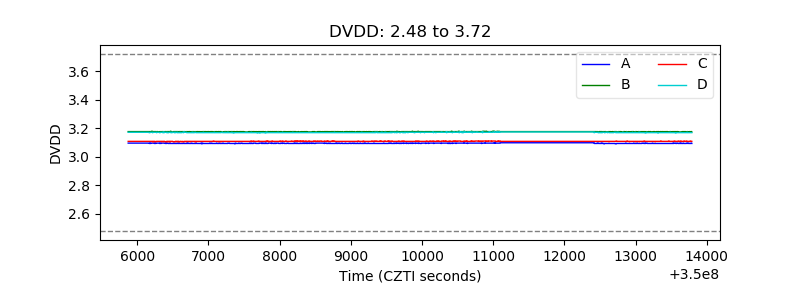 |
| Temperature 1 |  |
| Veto HV Monitor | 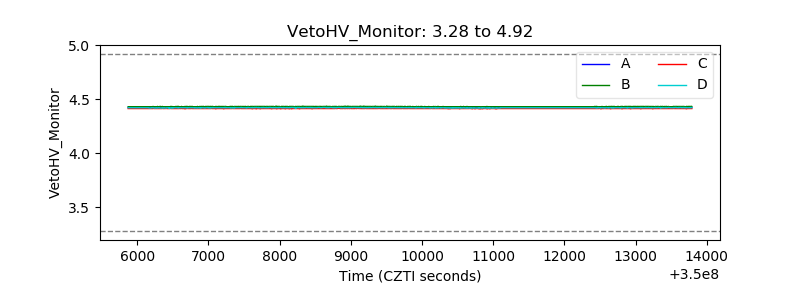 |
| Veto LLD | 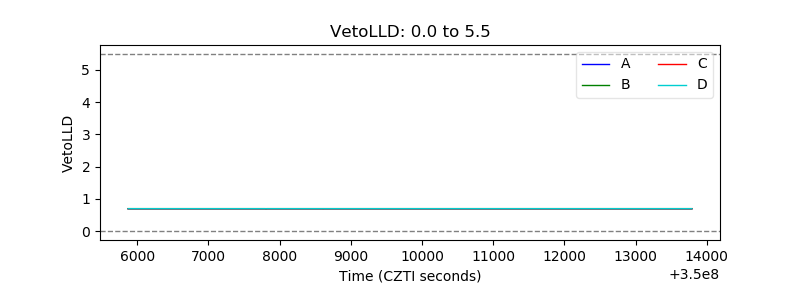 |
| Alpha Counter | 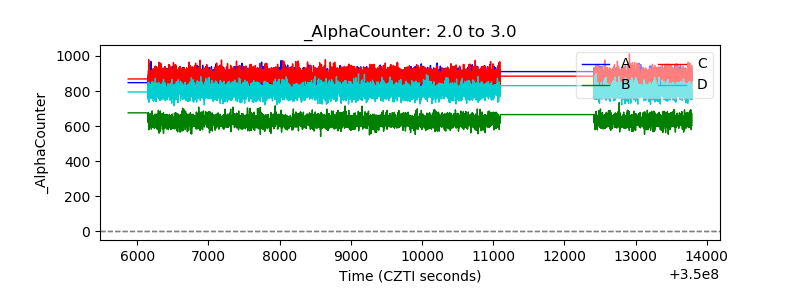 |
| _CPM_Rate | 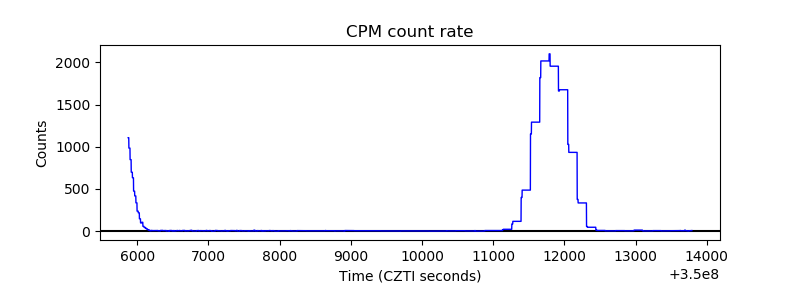 |
| CZT Counter |  |
| +2.5 Volts monitor |  |
| +5 Volts monitor |  |
| _ROLL_ROT | 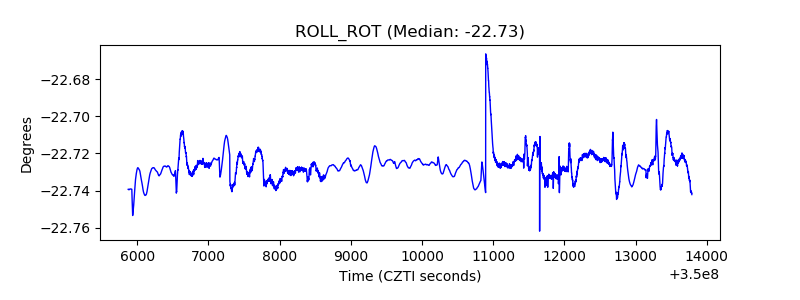 |
| _Roll_DEC | 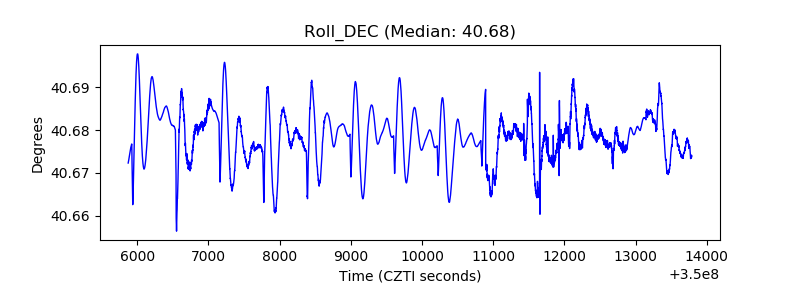 |
| _Roll_RA | 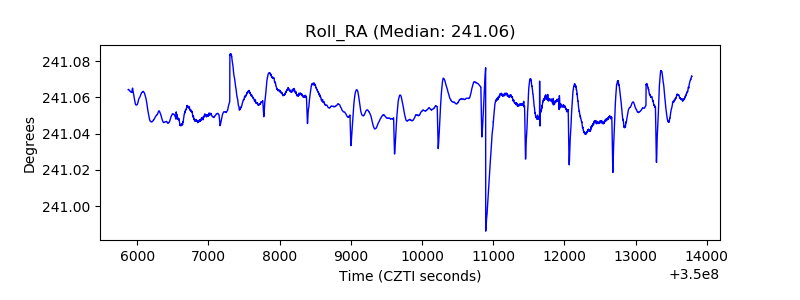 |
| Veto Counter | 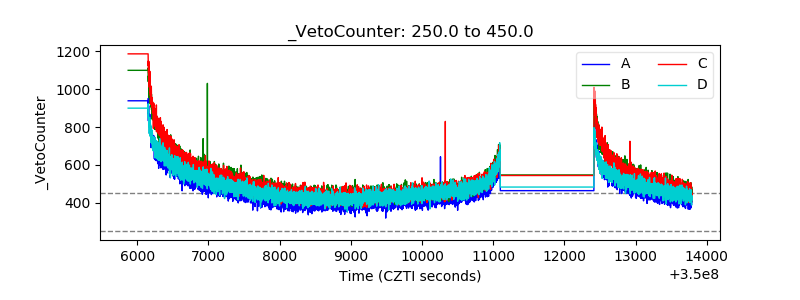 |