| Param | Original file | Final file |
|---|---|---|
| Filename | modeM0/AS1A10_082T04_9000004150_28937cztM0_level2.evt | modeM0/AS1A10_082T04_9000004150_28937cztM0_level2_quad_clean.evt |
| Size (bytes) | 580,786,560 | 106,764,480 |
| Size | 553.9 MB | 101.8 MB |
| Events in quadrant A | 3,274,864 | 708,185 |
| Events in quadrant B | 3,345,516 | 732,437 |
| Events in quadrant C | 3,721,725 | 694,465 |
| Events in quadrant D | 6,790,096 | 628,305 |
| Mode SS | |||
|---|---|---|---|
| Quadrant | BADHDUFLAG | Total packets | Discarded packets |
| A | 0 | 138 | 0 |
| B | 0 | 138 | 0 |
| C | 0 | 138 | 0 |
| D | 0 | 138 | 0 |
| Mode M0 | |||
|---|---|---|---|
| Quadrant | BADHDUFLAG | Total packets | Discarded packets |
| A | 0 | 14043 | 2 |
| B | 0 | 14226 | 2 |
| C | 0 | 15200 | 2 |
| D | 0 | 24757 | 2 |
| Mode M9 | |||
|---|---|---|---|
| Quadrant | BADHDUFLAG | Total packets | Discarded packets |
| A | 0 | 17 | 0 |
| B | 0 | 18 | 0 |
| C | 0 | 18 | 0 |
| D | 0 | 18 | 0 |
| Quadrant | Total seconds | Saturated seconds | Saturation percentage |
|---|---|---|---|
| A | 6735 | 23 | 0.341500% |
| B | 6735 | 58 | 0.861173% |
| C | 6735 | 168 | 2.494432% |
| D | 6735 | 1184 | 17.579807% |
Noise dominated data is calculated using 1-second bins in cleaned event files. If a bin has >2000 counts, and if more than 50% of those come from <1% of pixels, then it is considered to be noise-dominated and hence unusable.
| Quadrant | # 1 sec bins | Bins with >0 counts | Bins with >2000 counts | High rate bins dominated by noise | Noise dominated (total time) | Noise dominated (detector-on time) | Marked lightcurve |
|---|---|---|---|---|---|---|---|
| A | 7895 | 6736 | 0 | 0 | 0.00% | 0.00% | 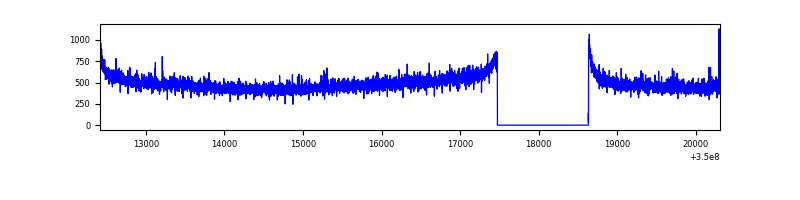 |
| B | 7895 | 6736 | 1 | 1 | 0.01% | 0.01% | 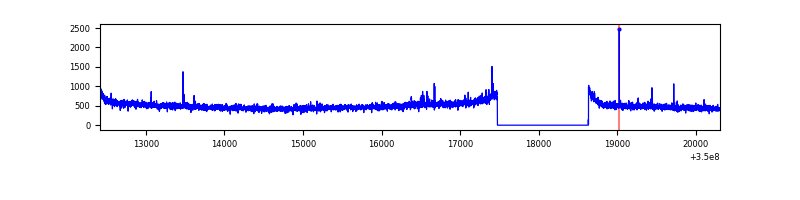 |
| C | 7895 | 6736 | 36 | 36 | 0.46% | 0.53% | 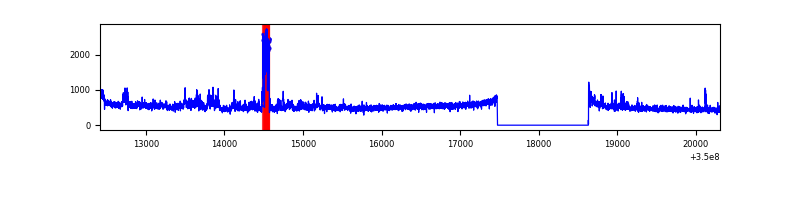 |
| D | 7895 | 6736 | 1110 | 1110 | 14.06% | 16.48% | 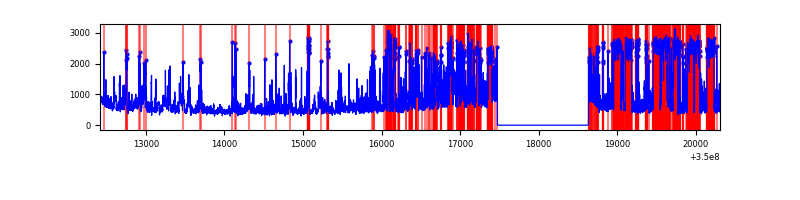 |
Top three noisy pixels from each quadrant. If the there are fewer than three noisy pixels in the level2.evt file, extra rows are filled as -1
| Pixel properties | Quadrant properties | ||||||
|---|---|---|---|---|---|---|---|
| Quadrant | DetID | PixID | Counts | Sigma | Mean | Median | Sigma |
| A | 5 | 98 | 20737 | 119.11 | 838 | 822 | 167.2 |
| A | 1 | 113 | 16202 | 91.98 | 838 | 822 | 167.2 |
| A | 13 | 254 | 11502 | 63.87 | 838 | 822 | 167.2 |
| B | 12 | 111 | 19645 | 119.2 | 841 | 821 | 157.9 |
| B | 11 | 111 | 17433 | 105.19 | 841 | 821 | 157.9 |
| B | 14 | 111 | 16592 | 99.87 | 841 | 821 | 157.9 |
| C | 3 | 233 | 278372 | 1489.45 | 804 | 809 | 186.4 |
| C | 14 | 238 | 149914 | 800.12 | 804 | 809 | 186.4 |
| C | 2 | 16 | 118446 | 631.26 | 804 | 809 | 186.4 |
| D | 8 | 195 | 2655862 | 14741.49 | 753 | 731 | 180.1 |
| D | 1 | 52 | 1267811 | 7034.92 | 753 | 731 | 180.1 |
| D | 2 | 234 | 24328 | 131.01 | 753 | 731 | 180.1 |
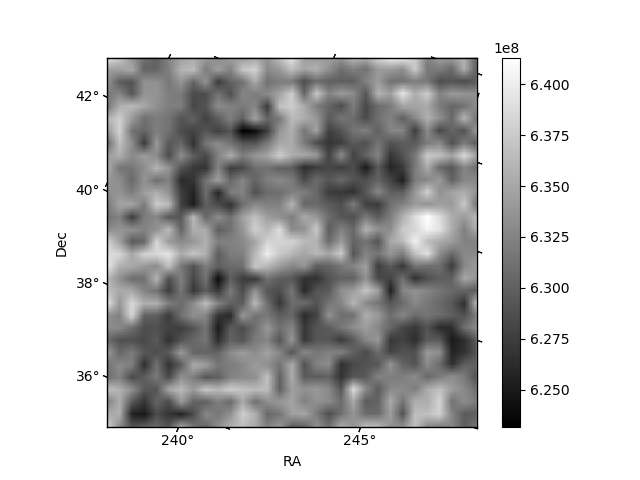
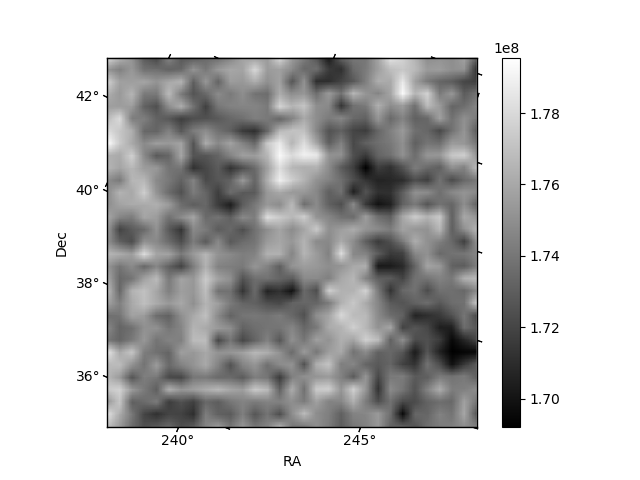
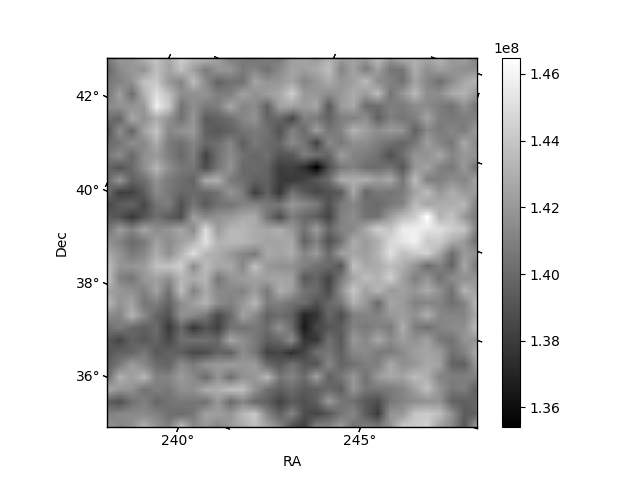
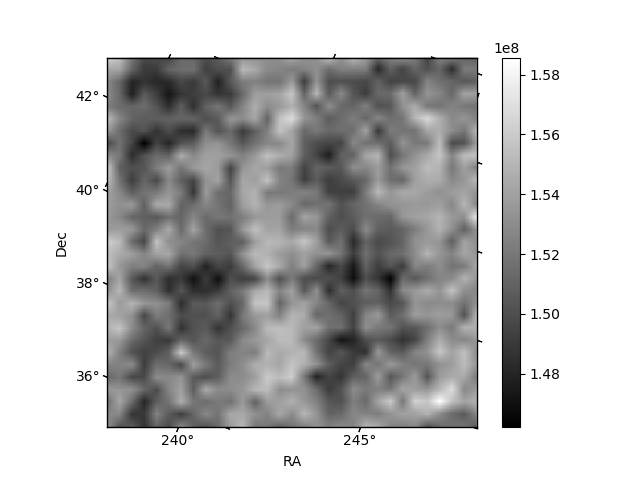
Histogram calculated using DETX and DETY for each event in the final _common_clean file
| Quadrant A | 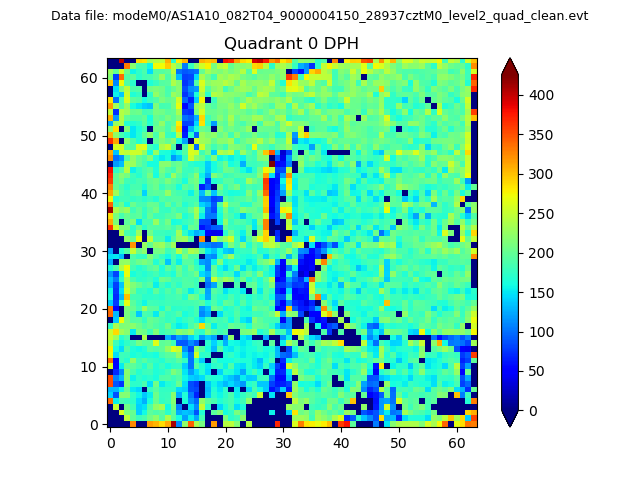 |
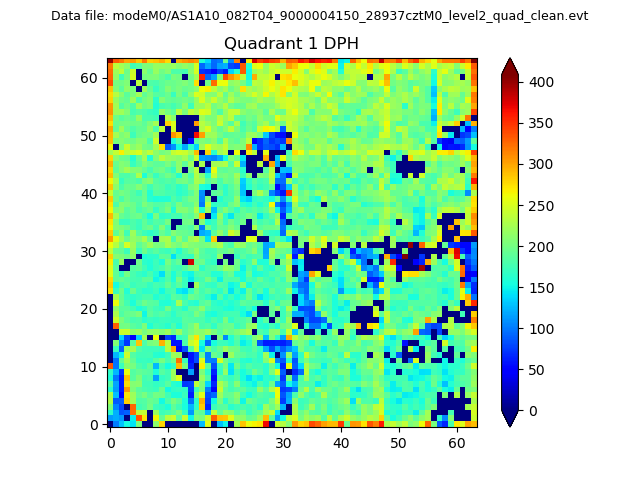 |
Quadrant B |
|---|---|---|---|
| Quadrant D | 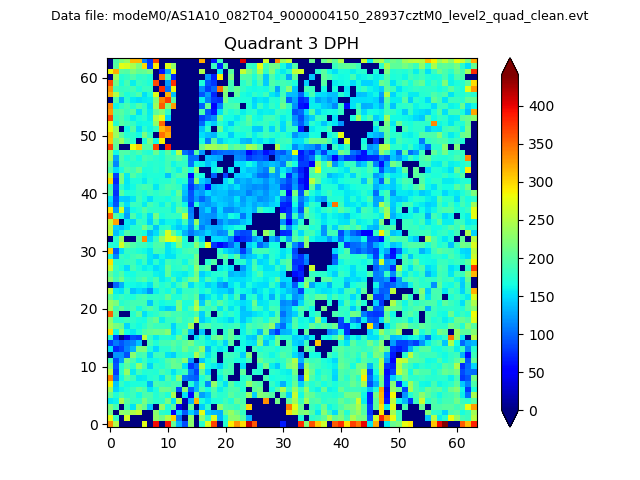 |
 |
Quadrant C |
| Plot type | Count rate plots | Images |
|---|---|---|
| Comparison with Poisson distribution Blue bars denote a histogram of data divided into 1 sec bins. Red curve is a Poisson curve with rate = median count rate of data. |
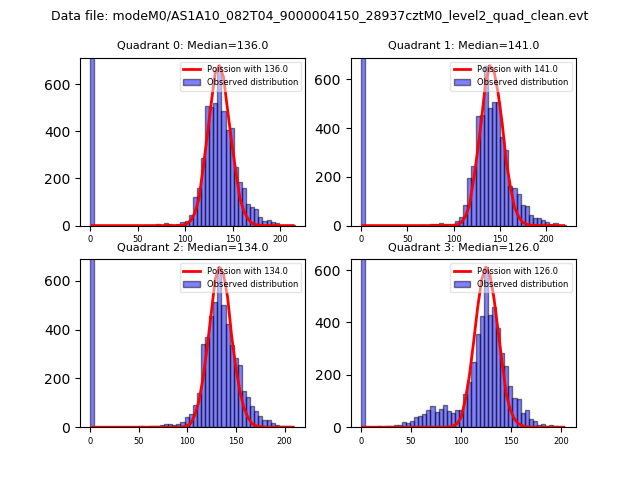 |
 |
| Quadrant-wise count rates Data is divided into 100 sec bins |
 |
|
| Module-wise count rates for Quadrant A Data is divided into 100 sec bins |
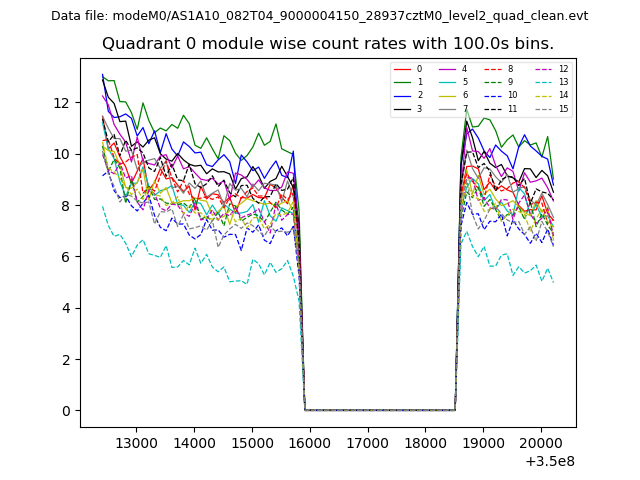 |
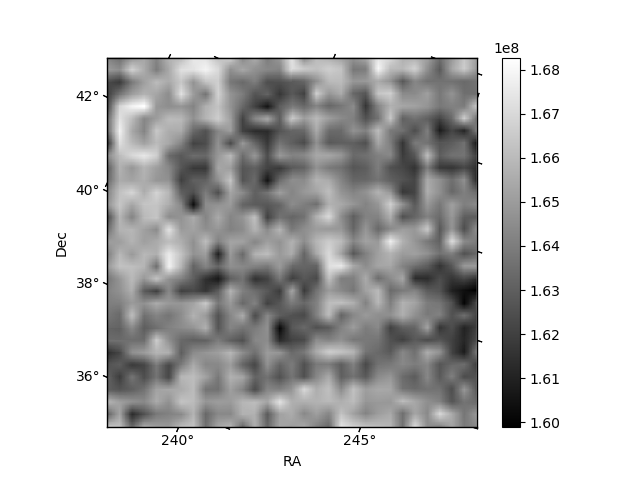 |
| Module-wise count rates for Quadrant B Data is divided into 100 sec bins |
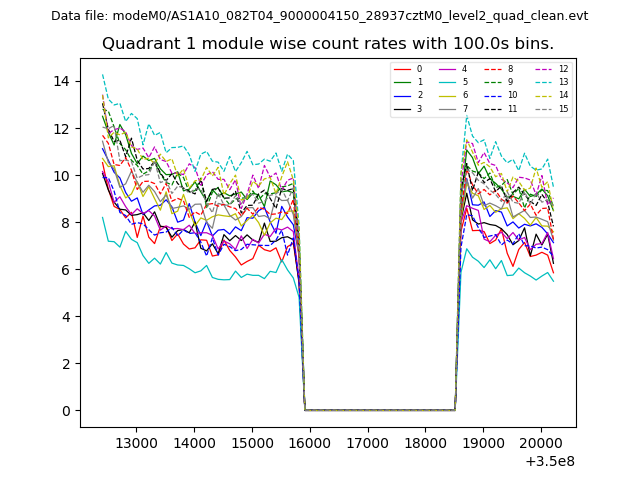 |
 |
| Module-wise count rates for Quadrant C Data is divided into 100 sec bins |
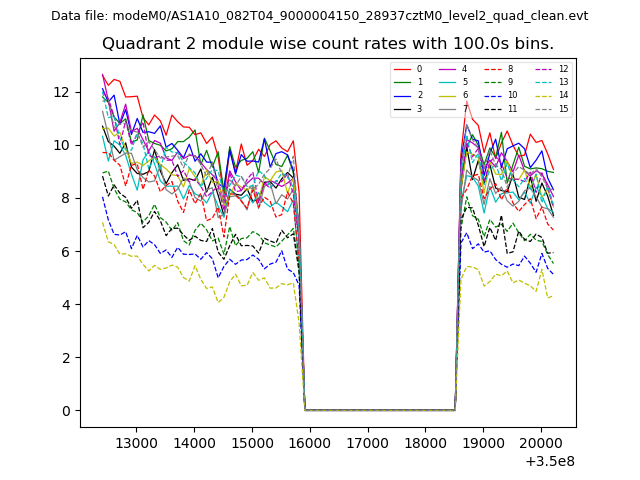 |
 |
| Module-wise count rates for Quadrant D Data is divided into 100 sec bins |
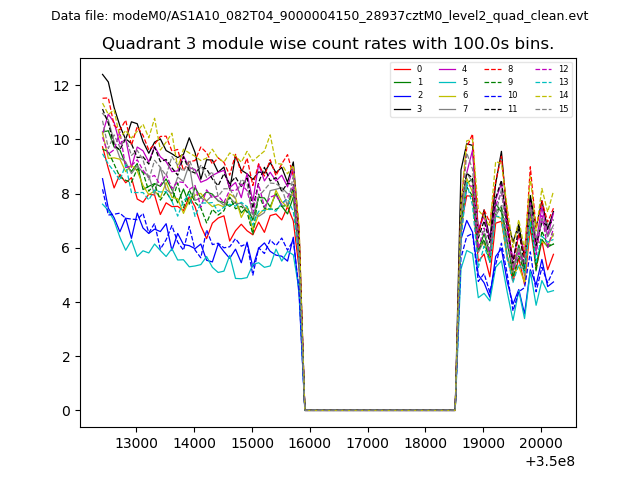 |
 |
| Parameter | Plot |
|---|---|
| CZT HV Monitor | 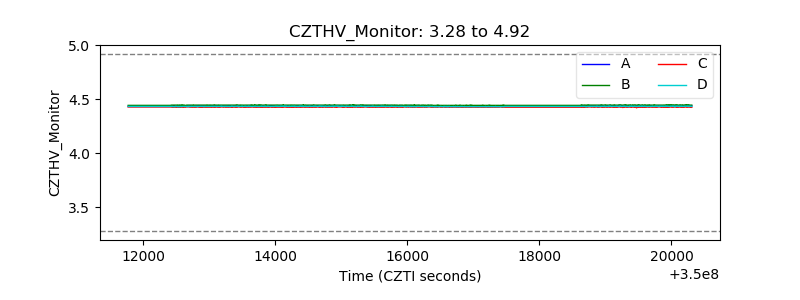 |
| D_VDD | 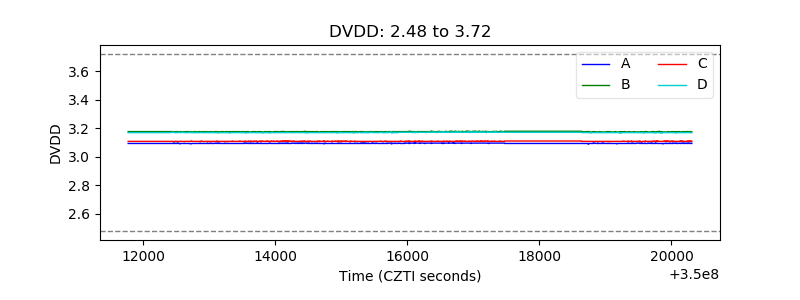 |
| Temperature 1 | 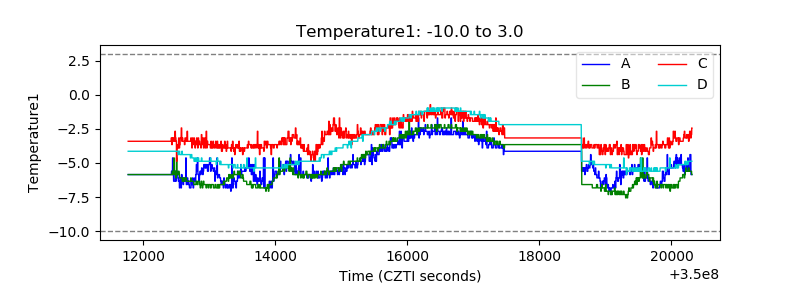 |
| Veto HV Monitor | 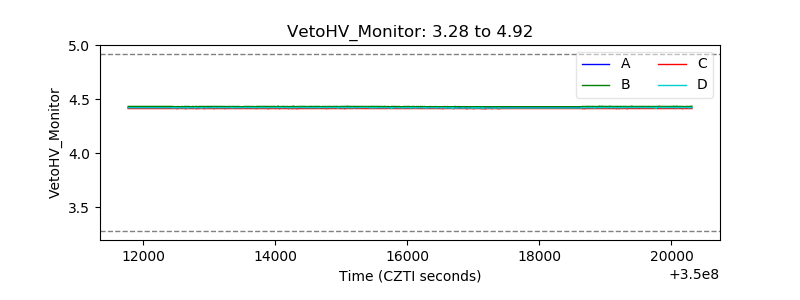 |
| Veto LLD | 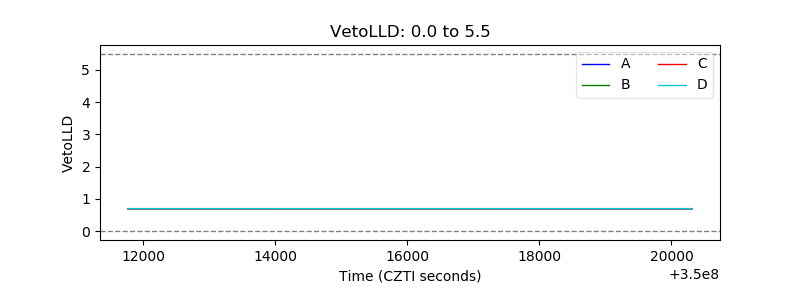 |
| Alpha Counter | 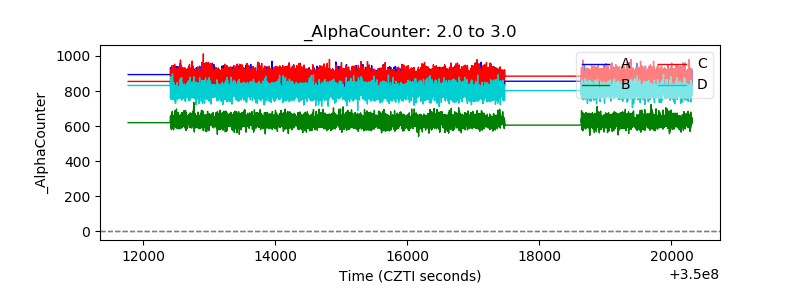 |
| _CPM_Rate | 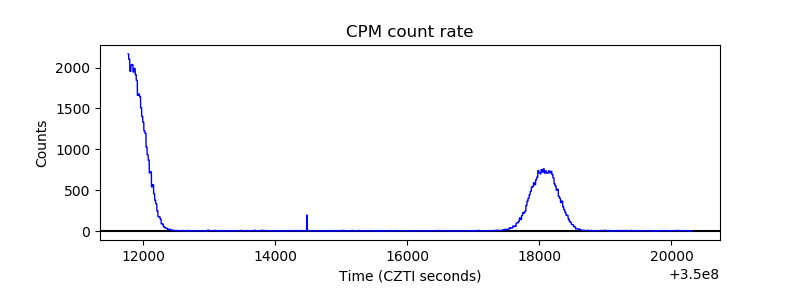 |
| CZT Counter |  |
| +2.5 Volts monitor |  |
| +5 Volts monitor |  |
| _ROLL_ROT | 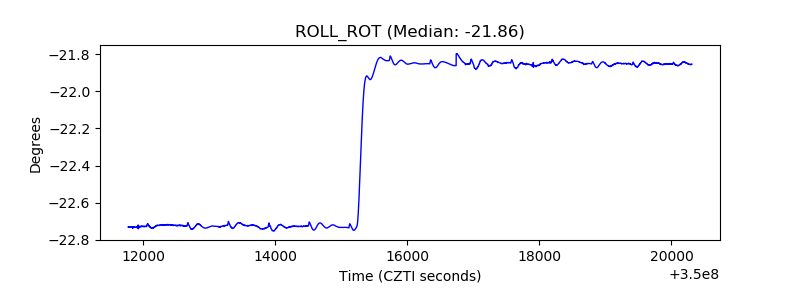 |
| _Roll_DEC | 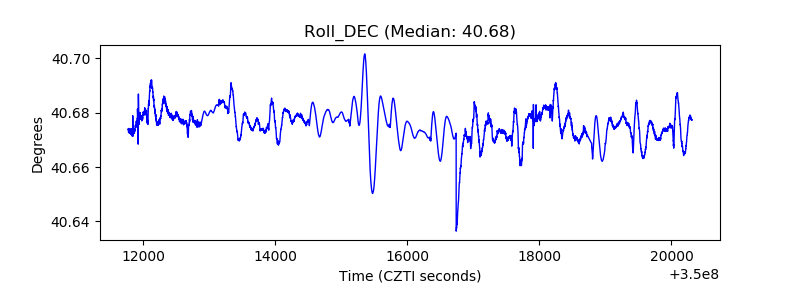 |
| _Roll_RA | 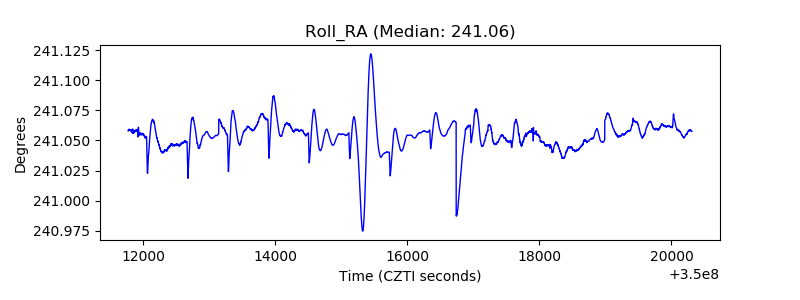 |
| Veto Counter | 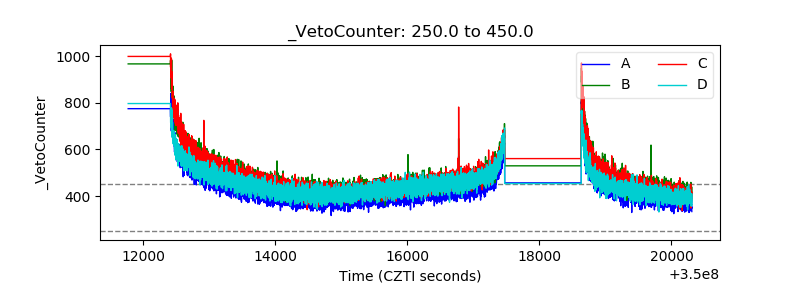 |