| Param | Original file | Final file |
|---|---|---|
| Filename | modeM0/AS1A10_082T04_9000004150_28938cztM0_level2.evt | modeM0/AS1A10_082T04_9000004150_28938cztM0_level2_quad_clean.evt |
| Size (bytes) | 645,609,600 | 89,222,400 |
| Size | 615.7 MB | 85.1 MB |
| Events in quadrant A | 3,347,201 | 586,370 |
| Events in quadrant B | 3,519,311 | 598,401 |
| Events in quadrant C | 3,361,754 | 565,017 |
| Events in quadrant D | 8,870,533 | 485,026 |
| Mode SS | |||
|---|---|---|---|
| Quadrant | BADHDUFLAG | Total packets | Discarded packets |
| A | 0 | 136 | 0 |
| B | 0 | 136 | 0 |
| C | 0 | 136 | 0 |
| D | 0 | 136 | 0 |
| Mode M0 | |||
|---|---|---|---|
| Quadrant | BADHDUFLAG | Total packets | Discarded packets |
| A | 0 | 14324 | 1 |
| B | 0 | 14874 | 1 |
| C | 0 | 14352 | 1 |
| D | 0 | 30933 | 1 |
| Mode M9 | |||
|---|---|---|---|
| Quadrant | BADHDUFLAG | Total packets | Discarded packets |
| A | 0 | 9 | 0 |
| B | 0 | 9 | 0 |
| C | 0 | 9 | 0 |
| D | 0 | 9 | 0 |
| Quadrant | Total seconds | Saturated seconds | Saturation percentage |
|---|---|---|---|
| A | 6693 | 51 | 0.761990% |
| B | 6694 | 191 | 2.853301% |
| C | 6694 | 318 | 4.750523% |
| D | 6694 | 2173 | 32.461906% |
Noise dominated data is calculated using 1-second bins in cleaned event files. If a bin has >2000 counts, and if more than 50% of those come from <1% of pixels, then it is considered to be noise-dominated and hence unusable.
| Quadrant | # 1 sec bins | Bins with >0 counts | Bins with >2000 counts | High rate bins dominated by noise | Noise dominated (total time) | Noise dominated (detector-on time) | Marked lightcurve |
|---|---|---|---|---|---|---|---|
| A | 7533 | 6695 | 0 | 0 | 0.00% | 0.00% | 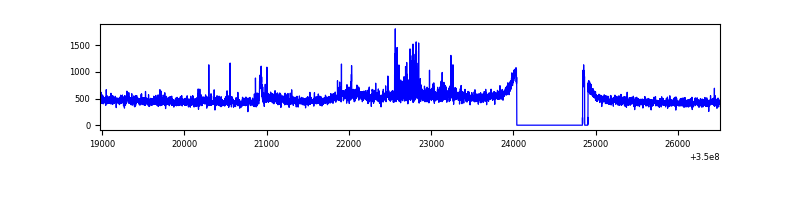 |
| B | 7534 | 6696 | 51 | 51 | 0.68% | 0.76% | 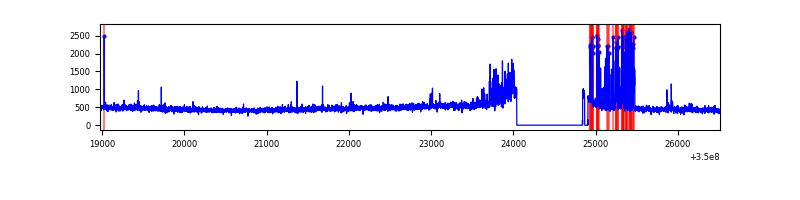 |
| C | 7534 | 6696 | 0 | 0 | 0.00% | 0.00% | 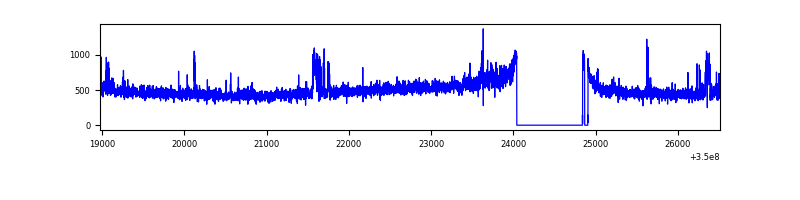 |
| D | 7534 | 6696 | 2063 | 2063 | 27.38% | 30.81% | 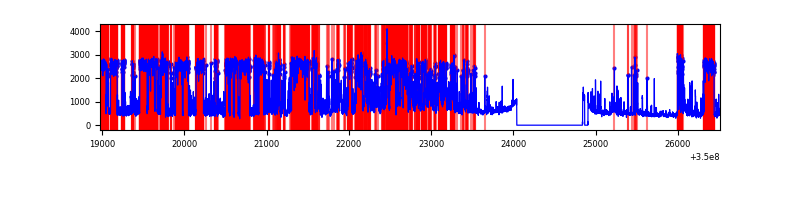 |
Top three noisy pixels from each quadrant. If the there are fewer than three noisy pixels in the level2.evt file, extra rows are filled as -1
| Pixel properties | Quadrant properties | ||||||
|---|---|---|---|---|---|---|---|
| Quadrant | DetID | PixID | Counts | Sigma | Mean | Median | Sigma |
| A | 1 | 113 | 159879 | 978.12 | 808 | 793 | 162.6 |
| A | 5 | 98 | 65881 | 400.19 | 808 | 793 | 162.6 |
| A | 13 | 254 | 11481 | 65.71 | 808 | 793 | 162.6 |
| B | 10 | 245 | 349407 | 2264.22 | 801 | 783 | 154.0 |
| B | 12 | 111 | 18923 | 117.81 | 801 | 783 | 154.0 |
| B | 11 | 111 | 17359 | 107.66 | 801 | 783 | 154.0 |
| C | 14 | 238 | 189821 | 1057.9 | 762 | 766 | 178.7 |
| C | 14 | 254 | 100811 | 559.82 | 762 | 766 | 178.7 |
| C | 3 | 233 | 81409 | 451.26 | 762 | 766 | 178.7 |
| D | 8 | 195 | 4322481 | 26117.73 | 691 | 672 | 165.5 |
| D | 1 | 52 | 1914561 | 11566.09 | 691 | 672 | 165.5 |
| D | 2 | 234 | 22831 | 133.91 | 691 | 672 | 165.5 |
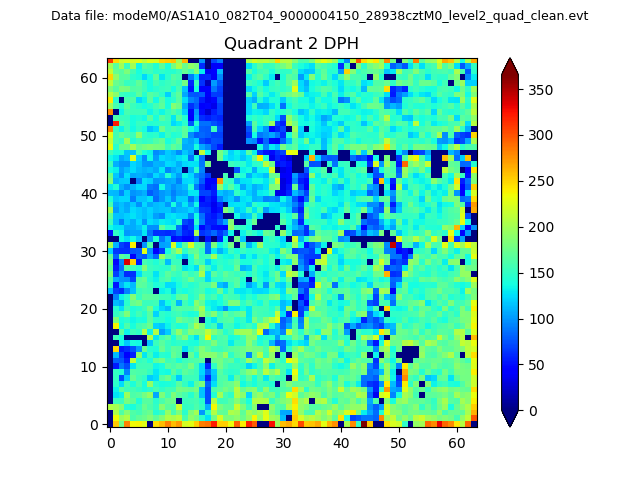
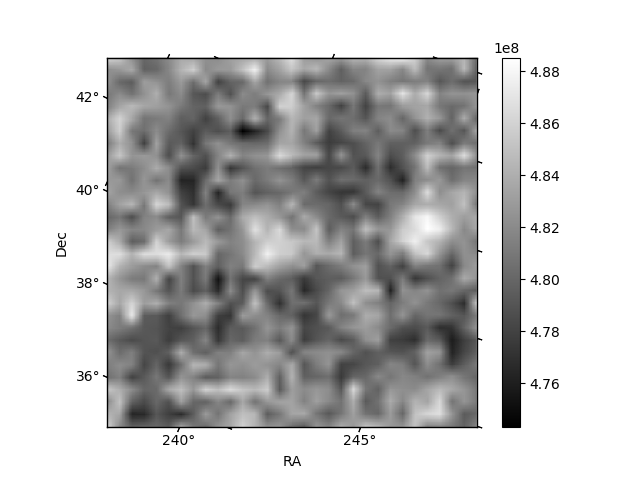
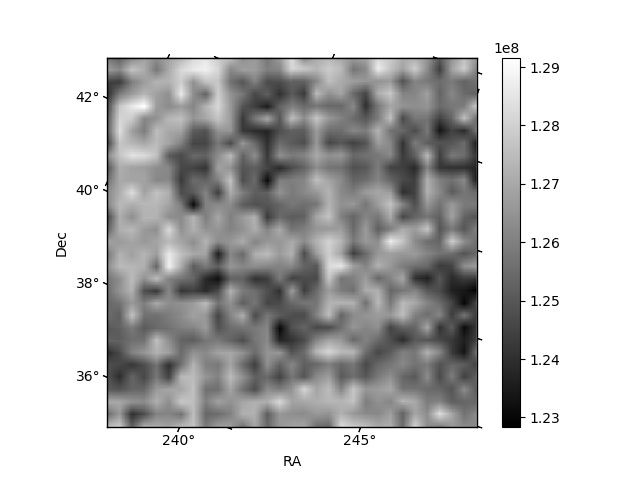
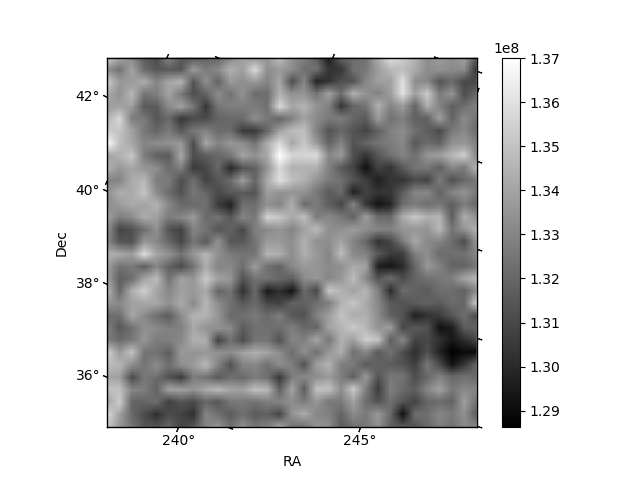
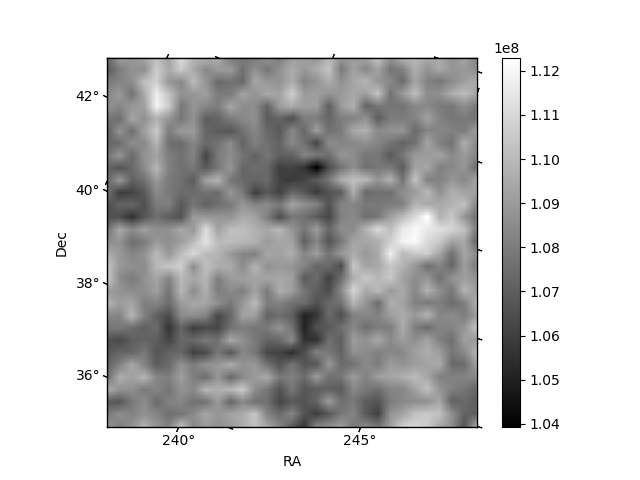
Histogram calculated using DETX and DETY for each event in the final _common_clean file
| Quadrant A | 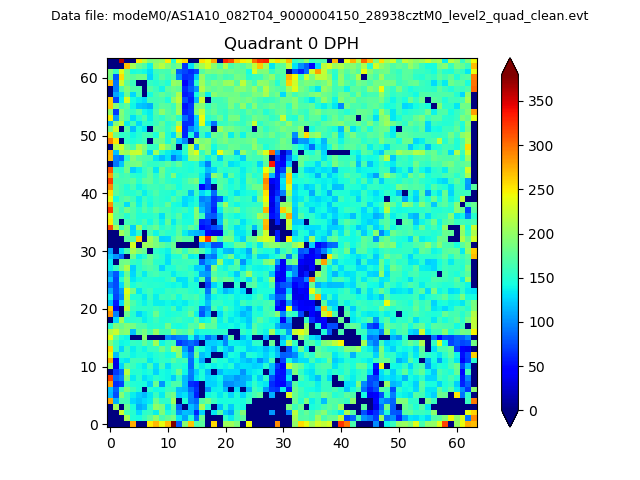 |
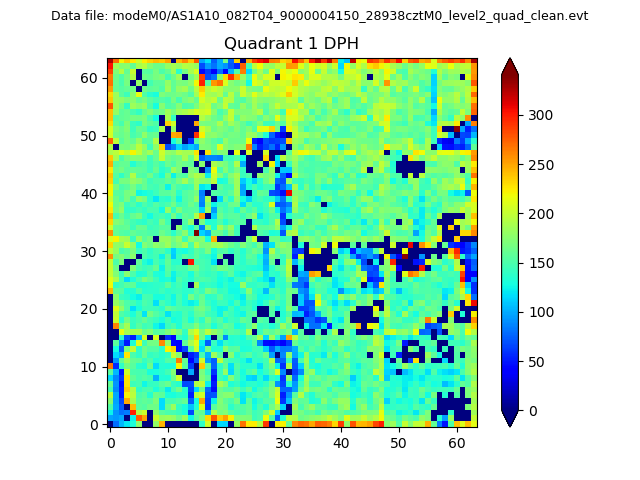 |
Quadrant B |
|---|---|---|---|
| Quadrant D | 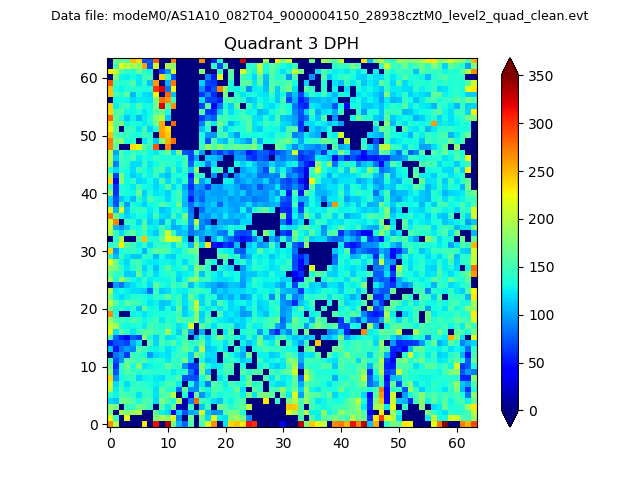 |
 |
Quadrant C |
| Plot type | Count rate plots | Images |
|---|---|---|
| Comparison with Poisson distribution Blue bars denote a histogram of data divided into 1 sec bins. Red curve is a Poisson curve with rate = median count rate of data. |
 |
 |
| Quadrant-wise count rates Data is divided into 100 sec bins |
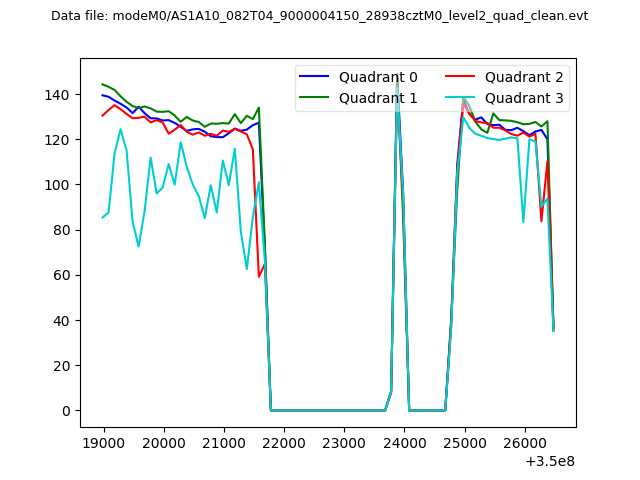 |
|
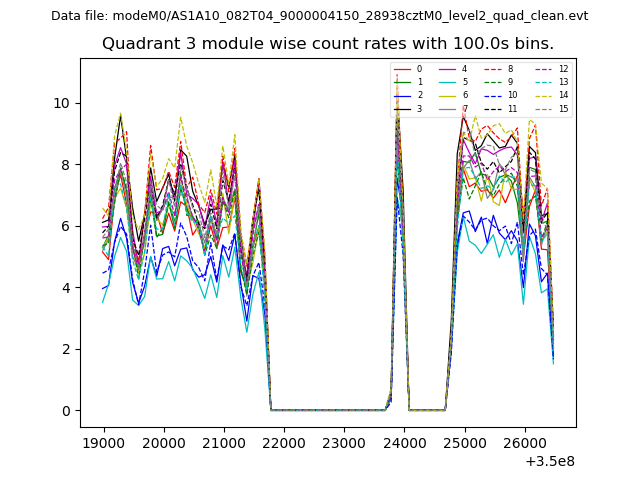
| Module-wise count rates for Quadrant A Data is divided into 100 sec bins |
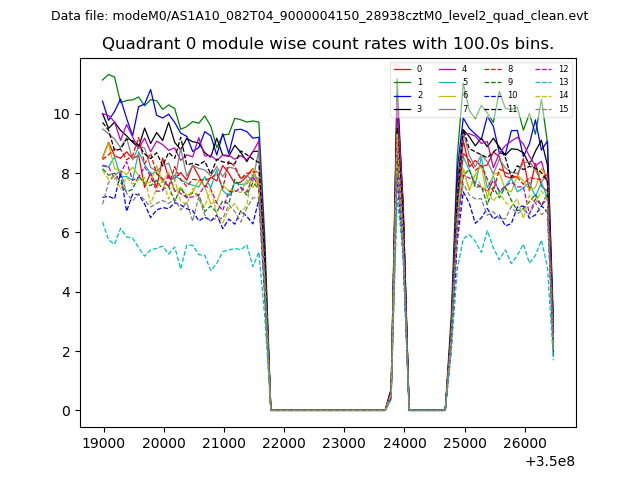 |
 |
| Module-wise count rates for Quadrant B Data is divided into 100 sec bins |
 |
 |
| Module-wise count rates for Quadrant C Data is divided into 100 sec bins |
 |
 |
| Module-wise count rates for Quadrant D Data is divided into 100 sec bins |
 |
 |
| Parameter | Plot |
|---|---|
| CZT HV Monitor |  |
| D_VDD | 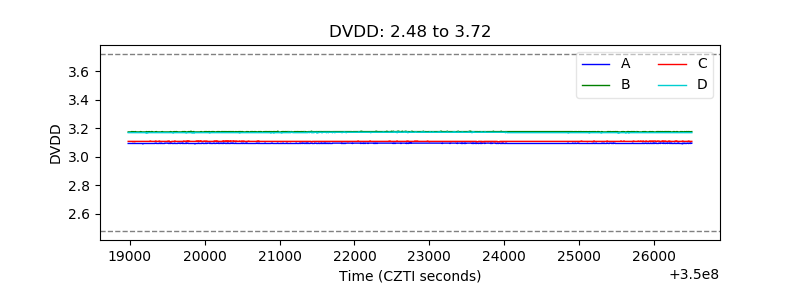 |
| Temperature 1 | 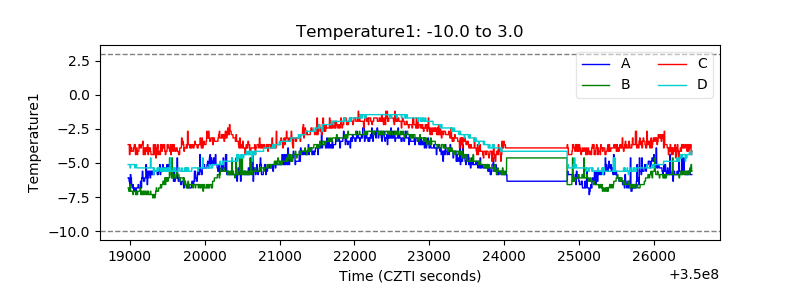 |
| Veto HV Monitor | 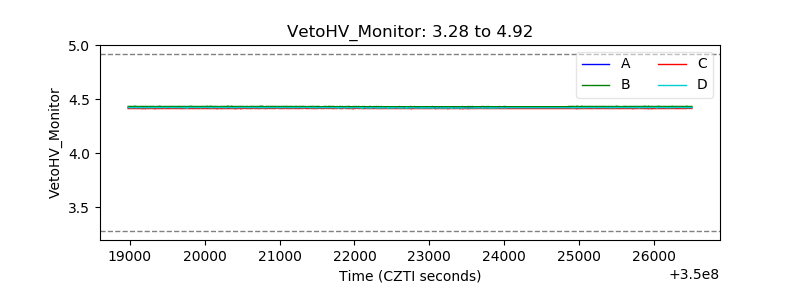 |
| Veto LLD | 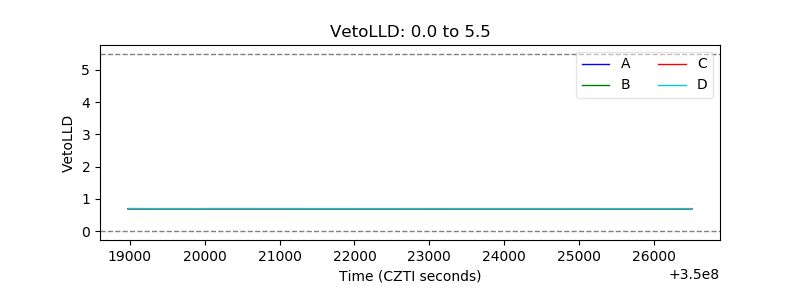 |
| Alpha Counter | 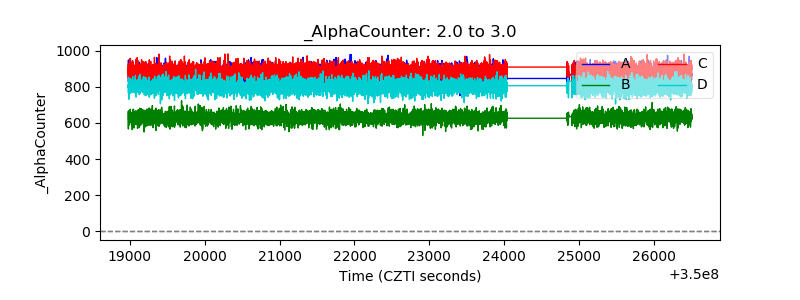 |
| _CPM_Rate | 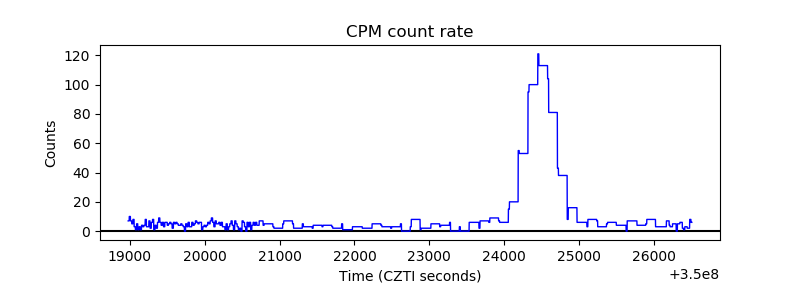 |
| CZT Counter | 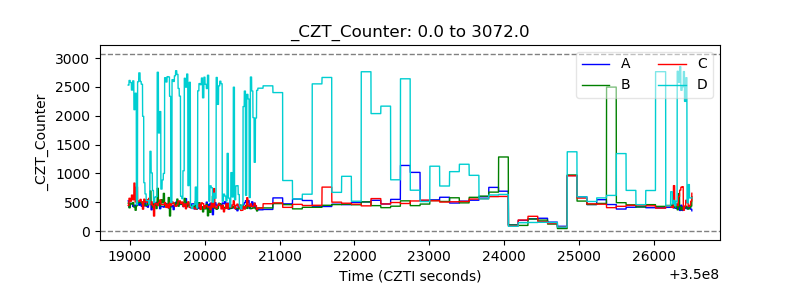 |
| +2.5 Volts monitor | 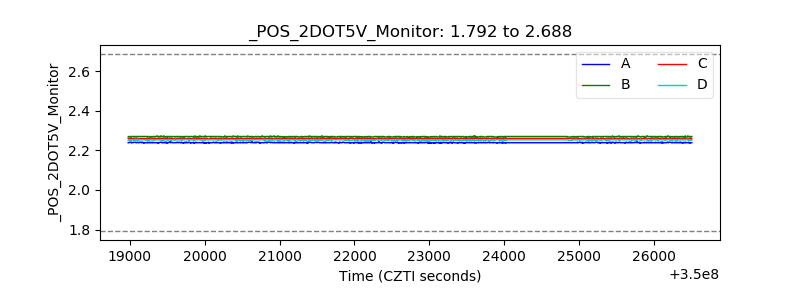 |
| +5 Volts monitor |  |
| _ROLL_ROT | 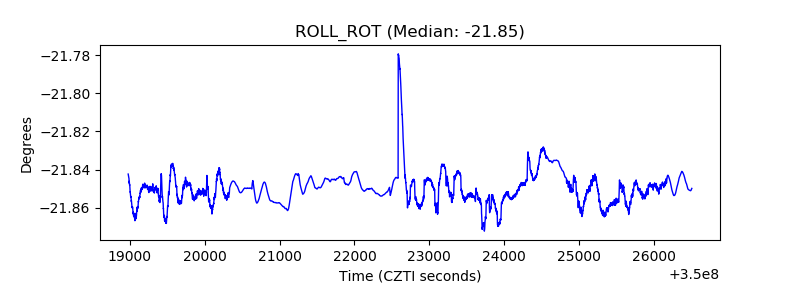 |
| _Roll_DEC | 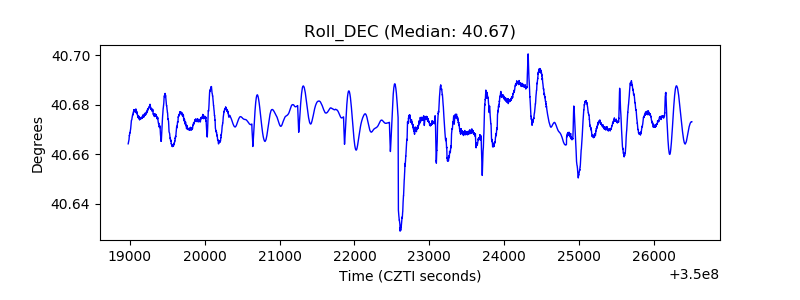 |
| _Roll_RA | 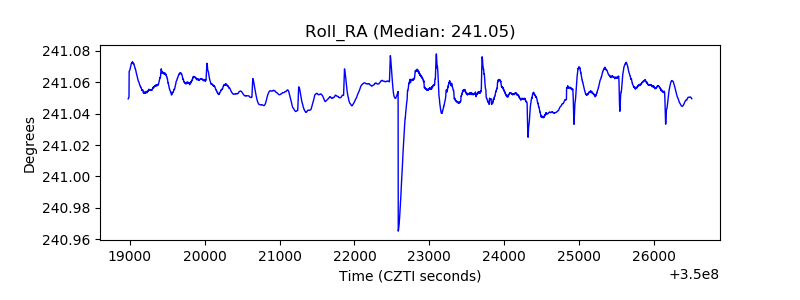 |
| Veto Counter | 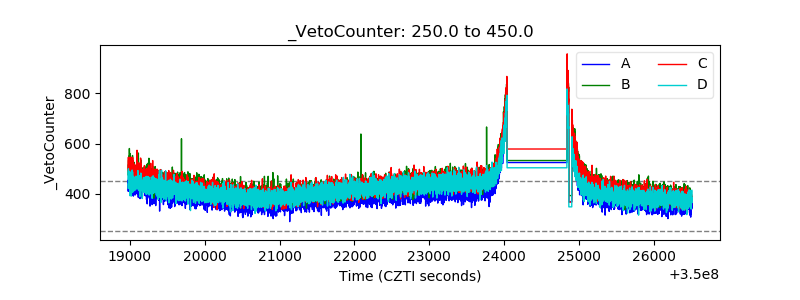 |