| Param | Original file | Final file |
|---|---|---|
| Filename | modeM0/AS1A10_082T04_9000004150_28939cztM0_level2.evt | modeM0/AS1A10_082T04_9000004150_28939cztM0_level2_quad_clean.evt |
| Size (bytes) | 615,153,600 | 92,436,480 |
| Size | 586.7 MB | 88.2 MB |
| Events in quadrant A | 3,236,018 | 597,249 |
| Events in quadrant B | 3,325,609 | 613,777 |
| Events in quadrant C | 3,473,568 | 584,346 |
| Events in quadrant D | 8,128,421 | 524,388 |
| Mode SS | |||
|---|---|---|---|
| Quadrant | BADHDUFLAG | Total packets | Discarded packets |
| A | 0 | 140 | 0 |
| B | 0 | 140 | 0 |
| C | 0 | 140 | 0 |
| D | 0 | 140 | 0 |
| Mode M0 | |||
|---|---|---|---|
| Quadrant | BADHDUFLAG | Total packets | Discarded packets |
| A | 0 | 14232 | 1 |
| B | 0 | 14370 | 1 |
| C | 0 | 14781 | 1 |
| D | 0 | 28825 | 1 |
| Mode M9 | |||
|---|---|---|---|
| Quadrant | BADHDUFLAG | Total packets | Discarded packets |
| A | 0 | 3 | 0 |
| B | 0 | 3 | 0 |
| C | 0 | 3 | 0 |
| D | 0 | 3 | 0 |
| Quadrant | Total seconds | Saturated seconds | Saturation percentage |
|---|---|---|---|
| A | 6870 | 140 | 2.037846% |
| B | 6871 | 159 | 2.314074% |
| C | 6871 | 250 | 3.638481% |
| D | 6871 | 1856 | 27.012080% |
Noise dominated data is calculated using 1-second bins in cleaned event files. If a bin has >2000 counts, and if more than 50% of those come from <1% of pixels, then it is considered to be noise-dominated and hence unusable.
| Quadrant | # 1 sec bins | Bins with >0 counts | Bins with >2000 counts | High rate bins dominated by noise | Noise dominated (total time) | Noise dominated (detector-on time) | Marked lightcurve |
|---|---|---|---|---|---|---|---|
| A | 7201 | 6872 | 0 | 0 | 0.00% | 0.00% | 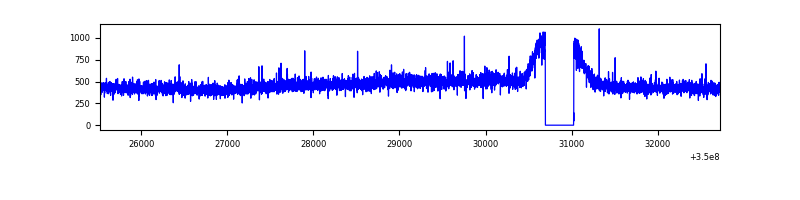 |
| B | 7202 | 6873 | 2 | 2 | 0.03% | 0.03% | 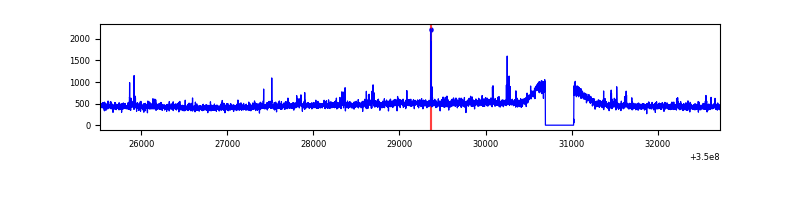 |
| C | 7202 | 6873 | 0 | 0 | 0.00% | 0.00% | 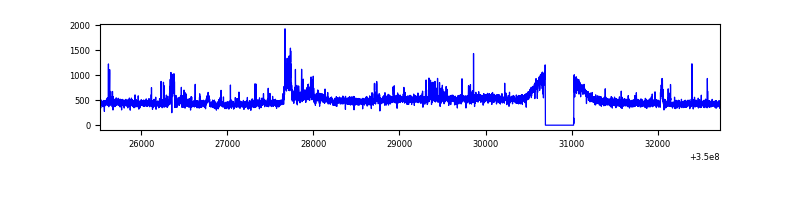 |
| D | 7202 | 6873 | 1739 | 1739 | 24.15% | 25.30% | 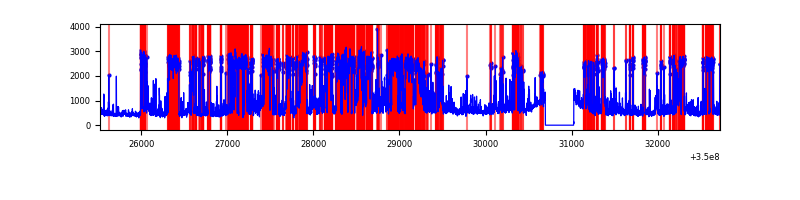 |
Top three noisy pixels from each quadrant. If the there are fewer than three noisy pixels in the level2.evt file, extra rows are filled as -1
| Pixel properties | Quadrant properties | ||||||
|---|---|---|---|---|---|---|---|
| Quadrant | DetID | PixID | Counts | Sigma | Mean | Median | Sigma |
| A | 13 | 254 | 12027 | 65.96 | 837 | 819 | 169.9 |
| A | 3 | 137 | 8532 | 45.39 | 837 | 819 | 169.9 |
| A | 0 | 226 | 7248 | 37.83 | 837 | 819 | 169.9 |
| B | 12 | 111 | 20353 | 121.51 | 829 | 808 | 160.8 |
| B | 11 | 111 | 18726 | 111.4 | 829 | 808 | 160.8 |
| B | 14 | 111 | 17216 | 102.01 | 829 | 808 | 160.8 |
| C | 14 | 238 | 166687 | 882.74 | 794 | 798 | 187.9 |
| C | 3 | 233 | 128795 | 681.11 | 794 | 798 | 187.9 |
| C | 14 | 254 | 58862 | 308.97 | 794 | 798 | 187.9 |
| D | 8 | 195 | 3505176 | 20407.54 | 722 | 701 | 171.7 |
| D | 1 | 52 | 1680894 | 9784.23 | 722 | 701 | 171.7 |
| D | 12 | 79 | 179256 | 1039.77 | 722 | 701 | 171.7 |
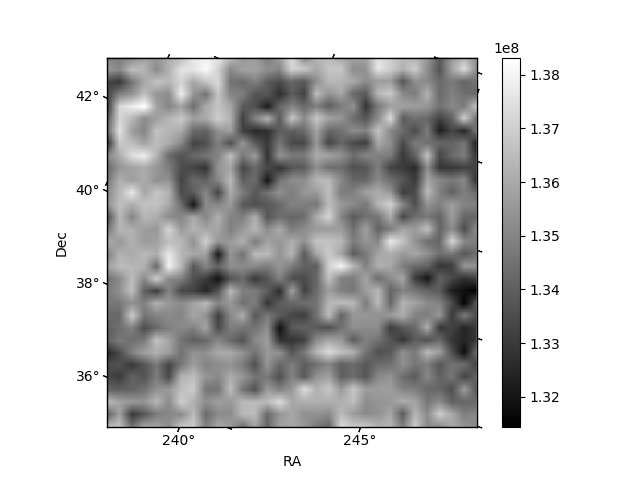
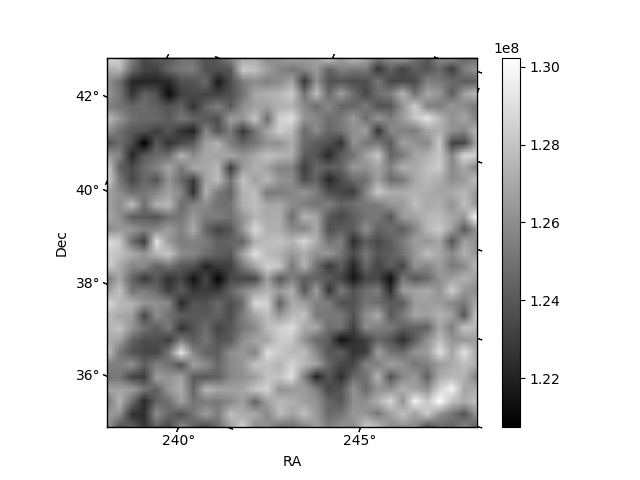
Histogram calculated using DETX and DETY for each event in the final _common_clean file
| Quadrant A | 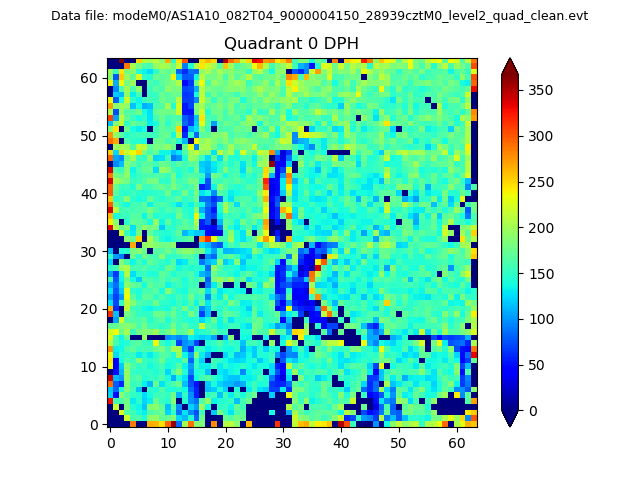 |
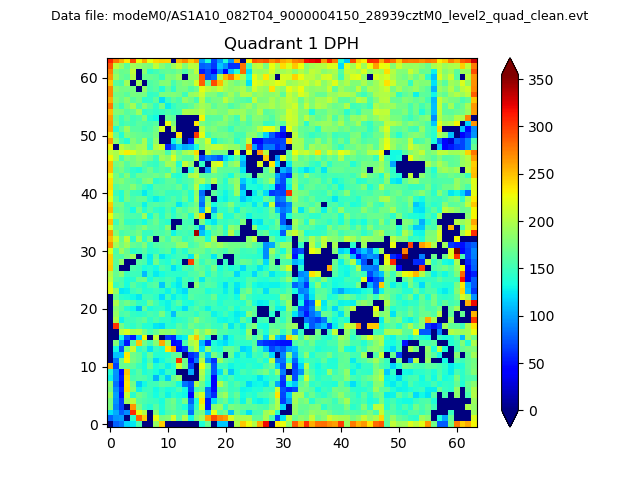 |
Quadrant B |
|---|---|---|---|
| Quadrant D | 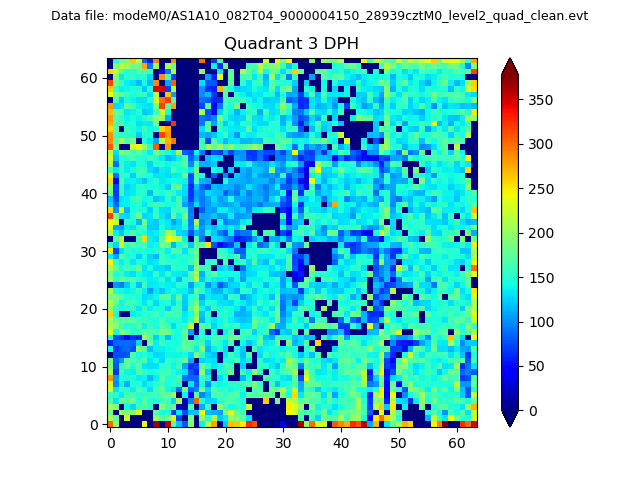 |
 |
Quadrant C |
| Plot type | Count rate plots | Images |
|---|---|---|
| Comparison with Poisson distribution Blue bars denote a histogram of data divided into 1 sec bins. Red curve is a Poisson curve with rate = median count rate of data. |
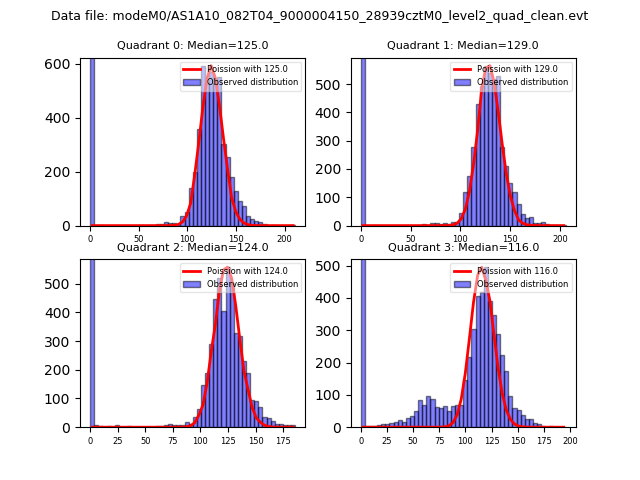 |
 |
| Quadrant-wise count rates Data is divided into 100 sec bins |
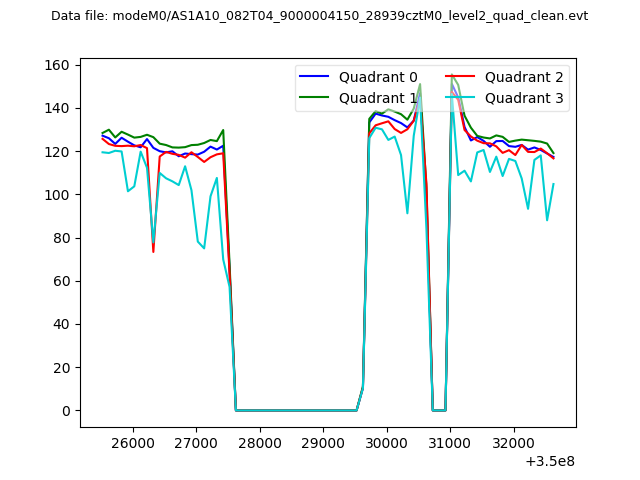 |
|
| Module-wise count rates for Quadrant A Data is divided into 100 sec bins |
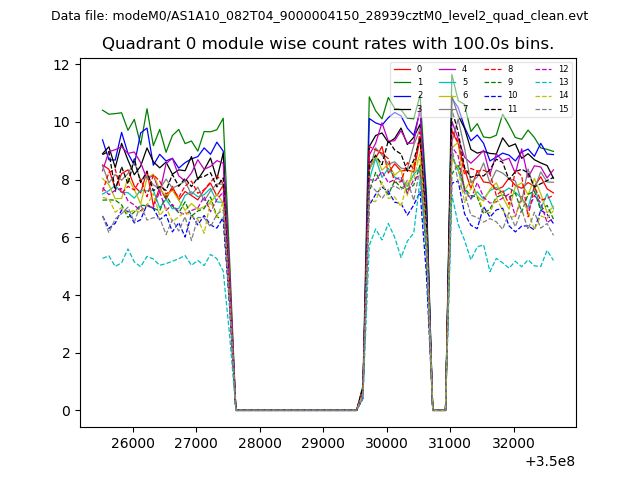 |
 |
| Module-wise count rates for Quadrant B Data is divided into 100 sec bins |
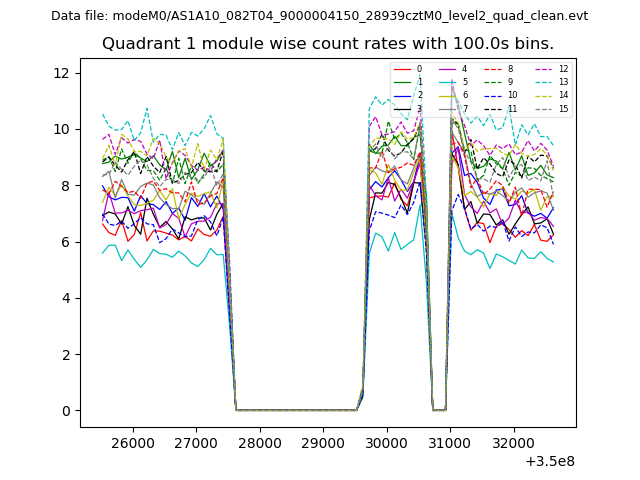 |
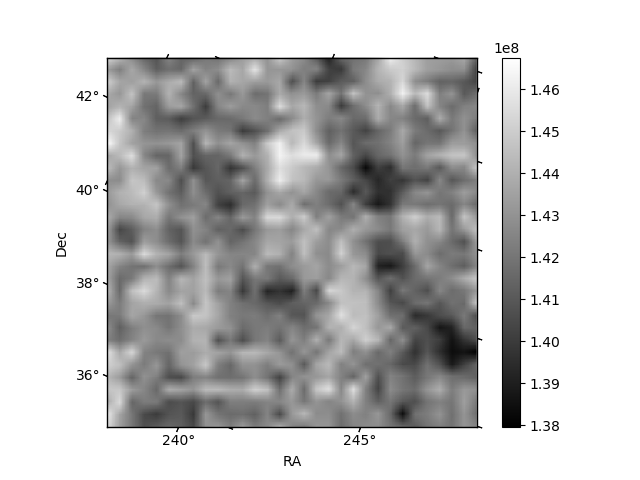 |
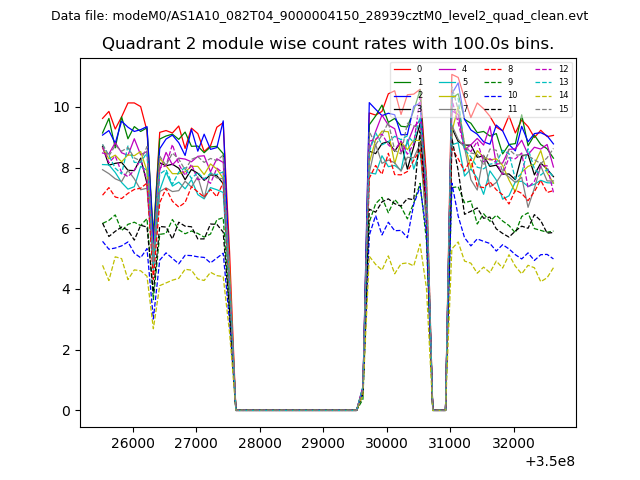
| Module-wise count rates for Quadrant C Data is divided into 100 sec bins |
 |
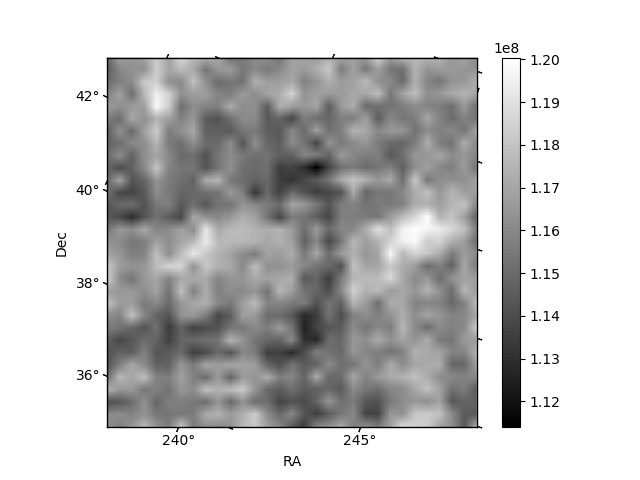 |
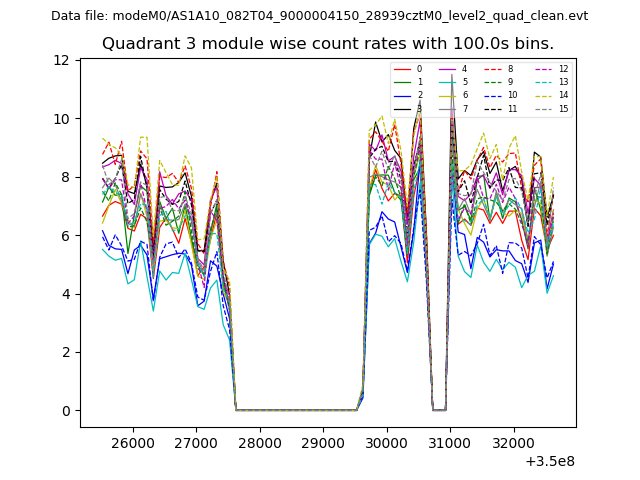
| Module-wise count rates for Quadrant D Data is divided into 100 sec bins |
 |
 |
| Parameter | Plot |
|---|---|
| CZT HV Monitor | 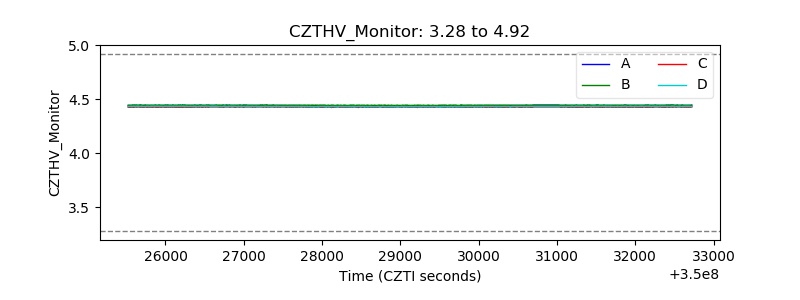 |
| D_VDD | 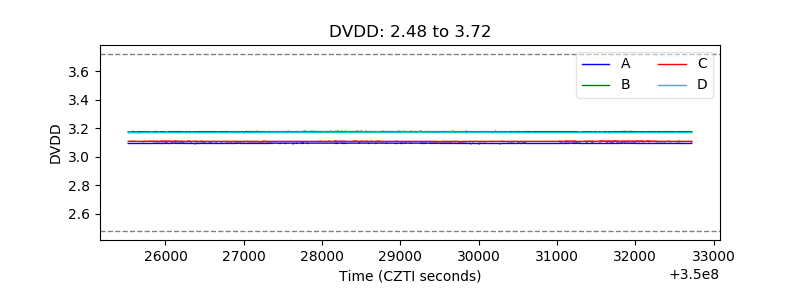 |
| Temperature 1 |  |
| Veto HV Monitor | 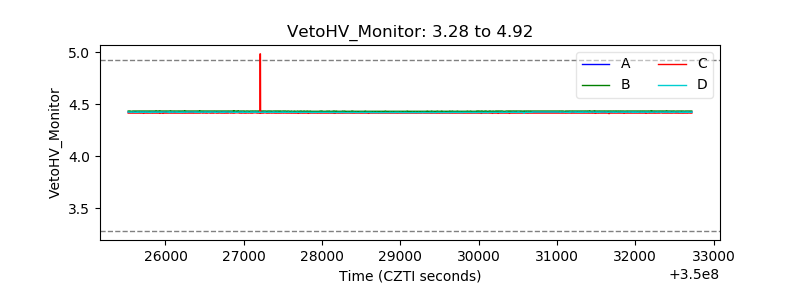 |
| Veto LLD | 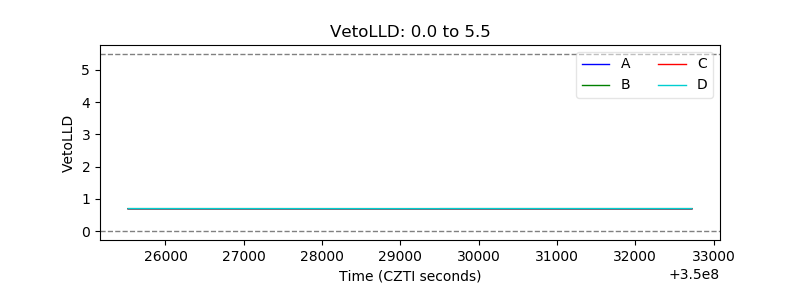 |
| Alpha Counter |  |
| _CPM_Rate | 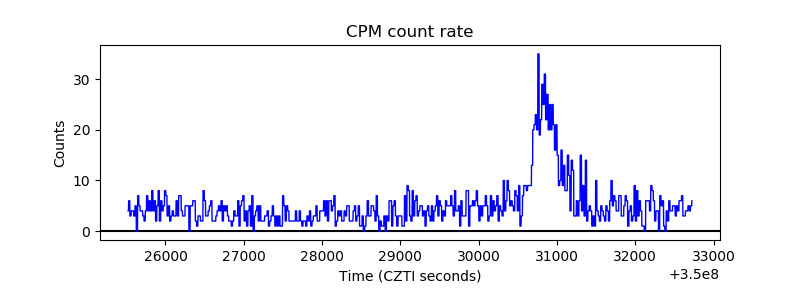 |
| CZT Counter |  |
| +2.5 Volts monitor |  |
| +5 Volts monitor |  |
| _ROLL_ROT | 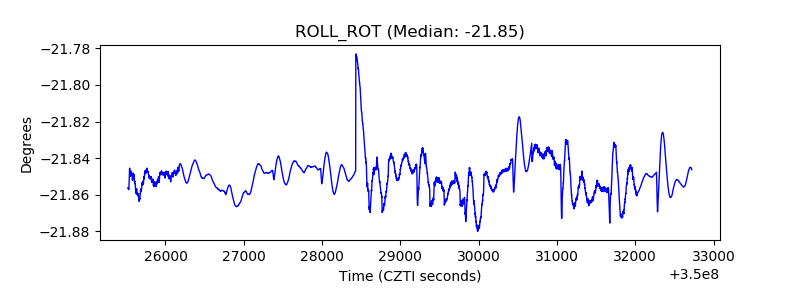 |
| _Roll_DEC | 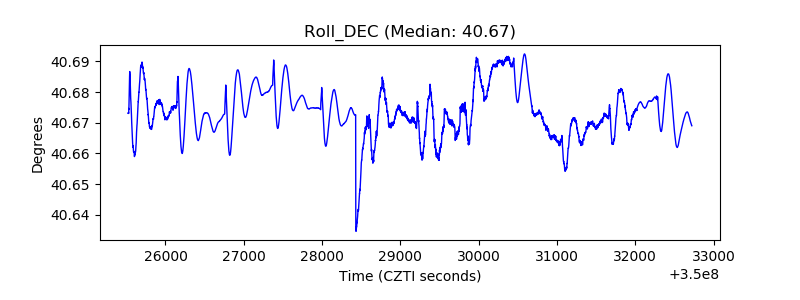 |
| _Roll_RA |  |
| Veto Counter | 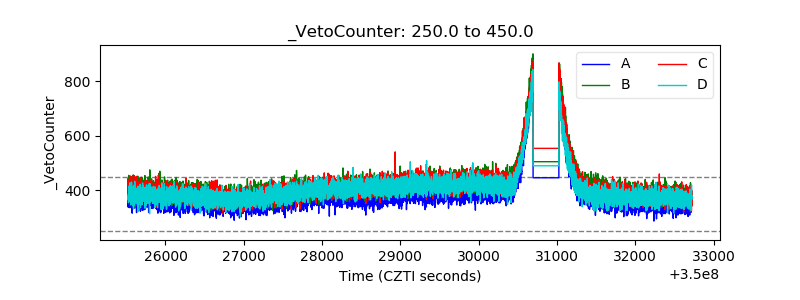 |