| Param | Original file | Final file |
|---|---|---|
| Filename | modeM0/AS1A10_082T04_9000004150_28940cztM0_level2.evt | modeM0/AS1A10_082T04_9000004150_28940cztM0_level2_quad_clean.evt |
| Size (bytes) | 626,299,200 | 90,348,480 |
| Size | 597.3 MB | 86.2 MB |
| Events in quadrant A | 3,165,317 | 584,200 |
| Events in quadrant B | 3,251,470 | 600,593 |
| Events in quadrant C | 3,215,631 | 577,065 |
| Events in quadrant D | 8,873,361 | 499,196 |
| Mode SS | |||
|---|---|---|---|
| Quadrant | BADHDUFLAG | Total packets | Discarded packets |
| A | 0 | 140 | 0 |
| B | 0 | 140 | 0 |
| C | 0 | 140 | 0 |
| D | 0 | 140 | 0 |
| Mode M0 | |||
|---|---|---|---|
| Quadrant | BADHDUFLAG | Total packets | Discarded packets |
| A | 0 | 13938 | 1 |
| B | 0 | 14084 | 1 |
| C | 0 | 13988 | 1 |
| D | 0 | 31042 | 1 |
| Mode M9 | |||
|---|---|---|---|
| Quadrant | BADHDUFLAG | Total packets | Discarded packets |
| A | 0 | 2 | 0 |
| B | 0 | 2 | 0 |
| C | 0 | 2 | 0 |
| D | 0 | 2 | 0 |
| Quadrant | Total seconds | Saturated seconds | Saturation percentage |
|---|---|---|---|
| A | 6802 | 80 | 1.176125% |
| B | 6803 | 86 | 1.264148% |
| C | 6803 | 131 | 1.925621% |
| D | 6803 | 2041 | 30.001470% |
Noise dominated data is calculated using 1-second bins in cleaned event files. If a bin has >2000 counts, and if more than 50% of those come from <1% of pixels, then it is considered to be noise-dominated and hence unusable.
| Quadrant | # 1 sec bins | Bins with >0 counts | Bins with >2000 counts | High rate bins dominated by noise | Noise dominated (total time) | Noise dominated (detector-on time) | Marked lightcurve |
|---|---|---|---|---|---|---|---|
| A | 7001 | 6802 | 0 | 0 | 0.00% | 0.00% | 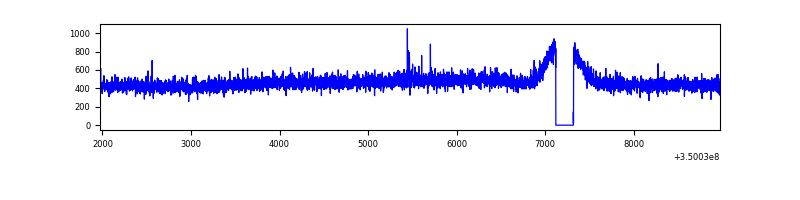 |
| B | 7003 | 6804 | 0 | 0 | 0.00% | 0.00% | 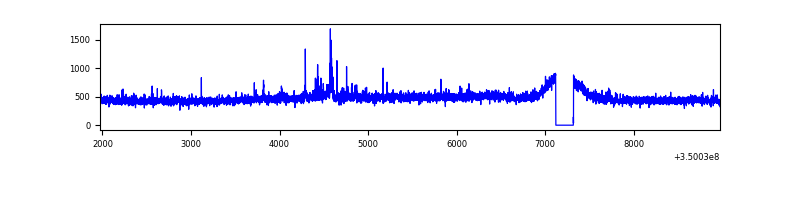 |
| C | 7003 | 6804 | 0 | 0 | 0.00% | 0.00% | 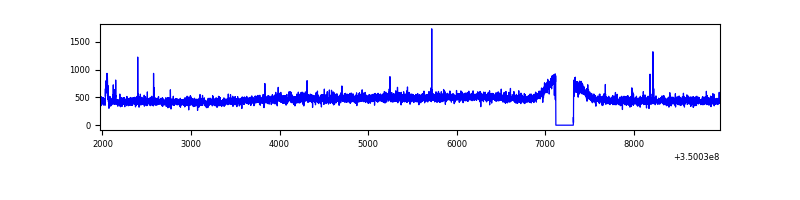 |
| D | 7003 | 6804 | 1946 | 1946 | 27.79% | 28.60% | 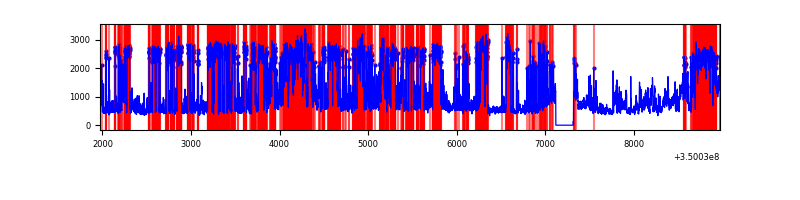 |
Top three noisy pixels from each quadrant. If the there are fewer than three noisy pixels in the level2.evt file, extra rows are filled as -1
| Pixel properties | Quadrant properties | ||||||
|---|---|---|---|---|---|---|---|
| Quadrant | DetID | PixID | Counts | Sigma | Mean | Median | Sigma |
| A | 12 | 96 | 12764 | 72.32 | 817 | 798 | 165.5 |
| A | 13 | 254 | 10937 | 61.28 | 817 | 798 | 165.5 |
| A | 3 | 137 | 8376 | 45.8 | 817 | 798 | 165.5 |
| B | 10 | 245 | 37038 | 231.35 | 810 | 787 | 156.7 |
| B | 12 | 111 | 19505 | 119.46 | 810 | 787 | 156.7 |
| B | 11 | 111 | 17898 | 109.2 | 810 | 787 | 156.7 |
| C | 14 | 238 | 137270 | 742.36 | 780 | 781 | 183.9 |
| C | 14 | 254 | 16441 | 85.17 | 780 | 781 | 183.9 |
| C | 2 | 114 | 15625 | 80.74 | 780 | 781 | 183.9 |
| D | 8 | 195 | 3541539 | 21348.33 | 690 | 667 | 165.9 |
| D | 1 | 52 | 2627898 | 15839.88 | 690 | 667 | 165.9 |
| D | 12 | 79 | 75401 | 450.58 | 690 | 667 | 165.9 |
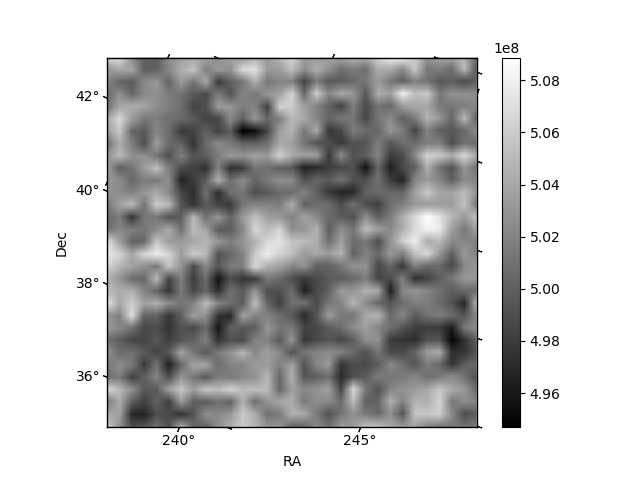
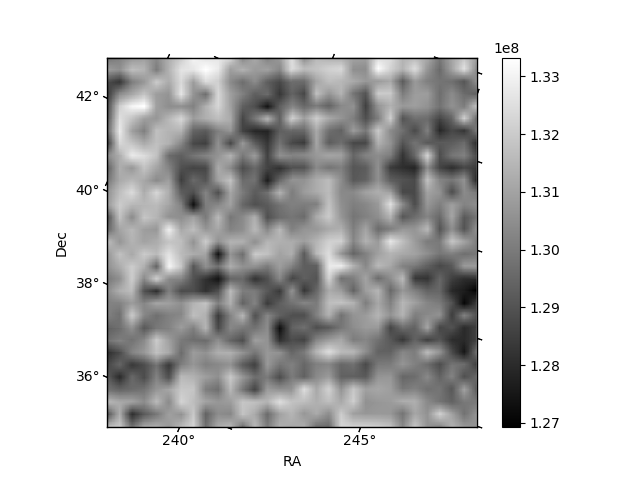
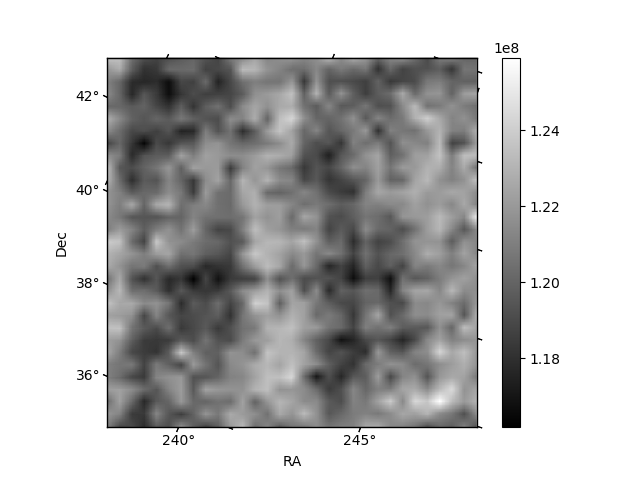
Histogram calculated using DETX and DETY for each event in the final _common_clean file
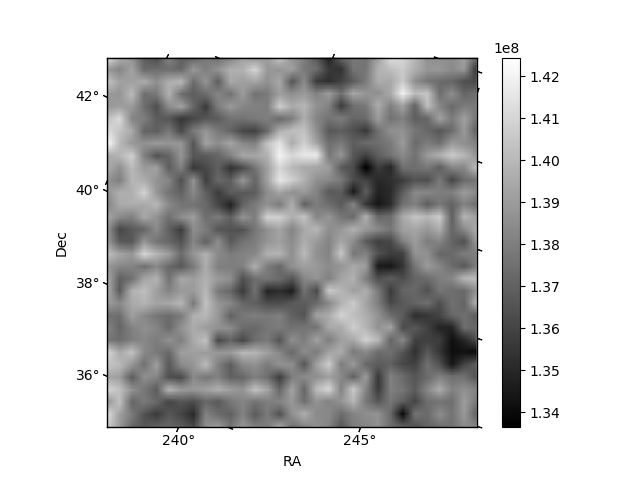
| Quadrant A | 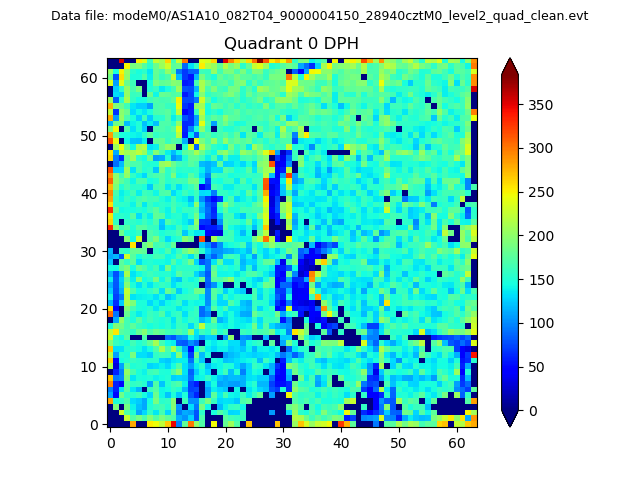 |
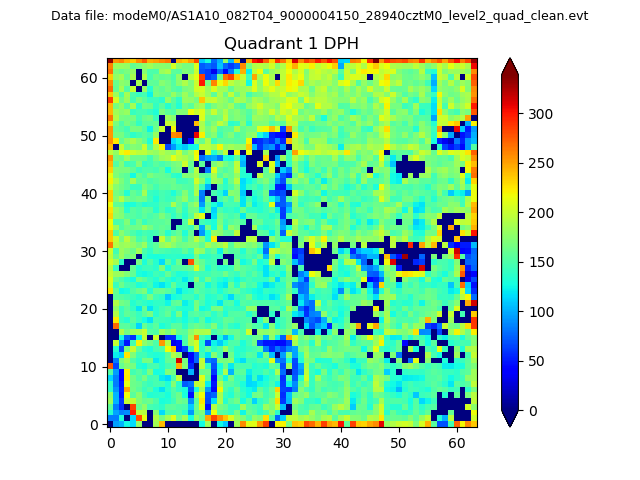 |
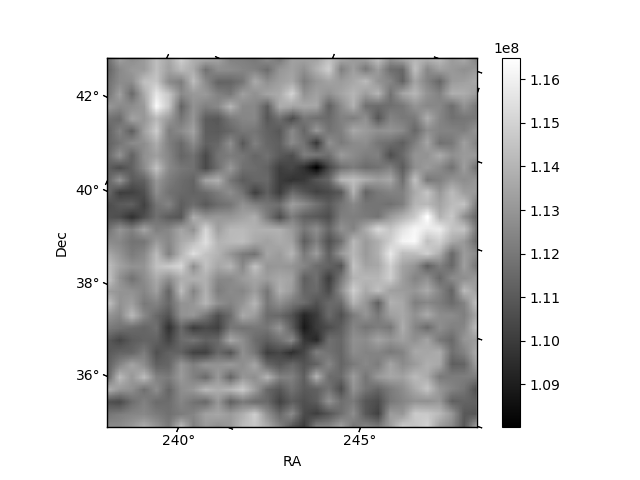
Quadrant B |
|---|---|---|---|
| Quadrant D | 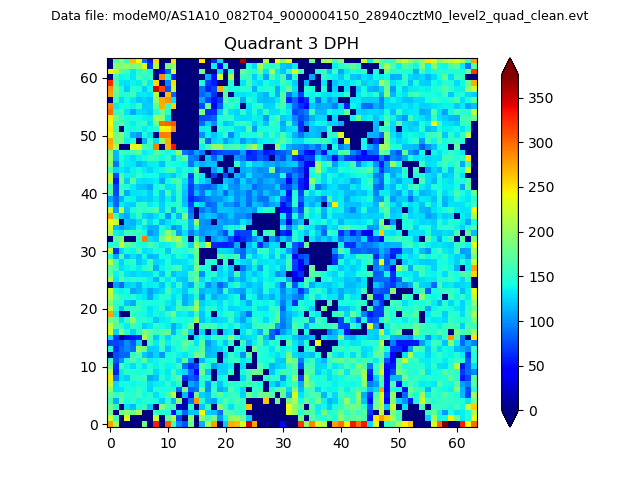 |
 |
Quadrant C |
| Plot type | Count rate plots | Images |
|---|---|---|
| Comparison with Poisson distribution Blue bars denote a histogram of data divided into 1 sec bins. Red curve is a Poisson curve with rate = median count rate of data. |
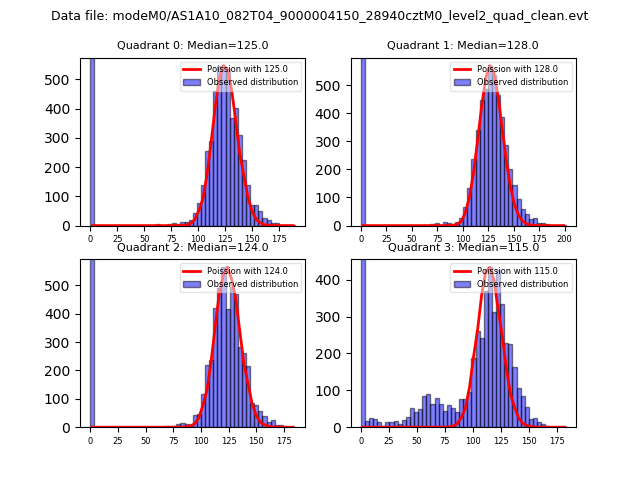 |
 |
| Quadrant-wise count rates Data is divided into 100 sec bins |
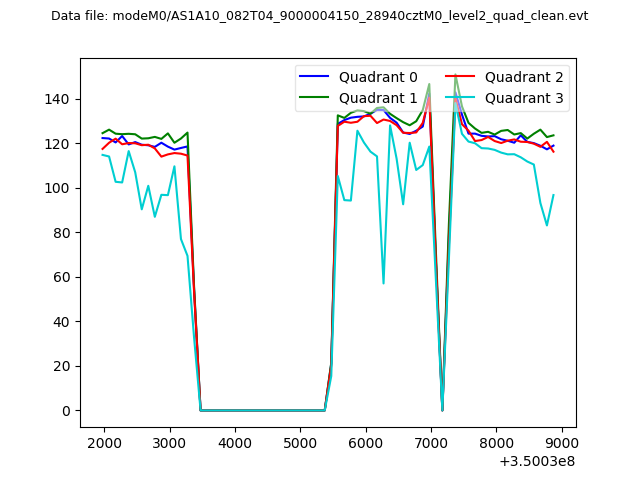 |
|
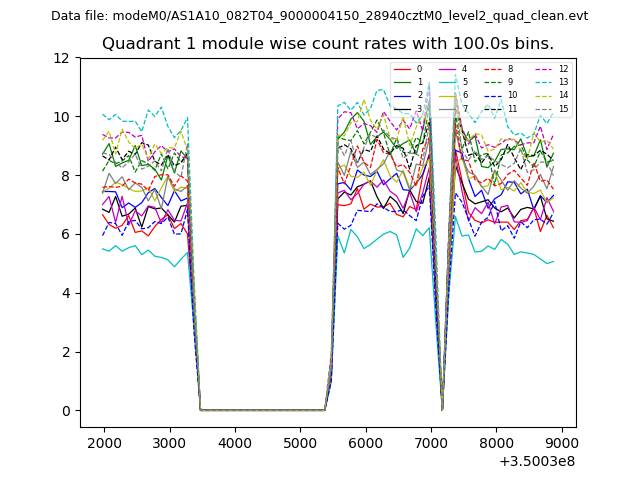
| Module-wise count rates for Quadrant A Data is divided into 100 sec bins |
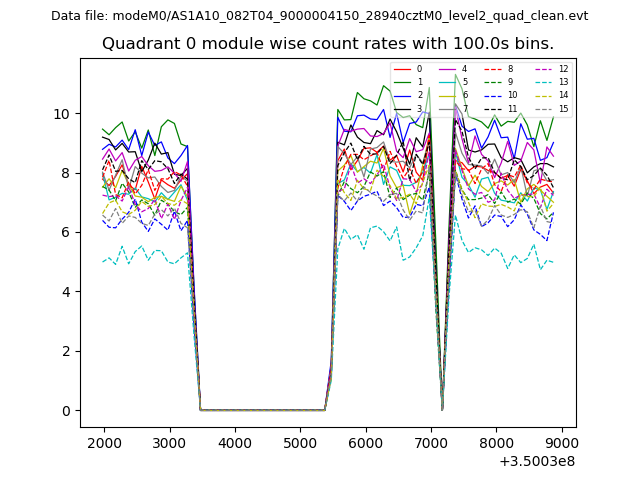 |
 |
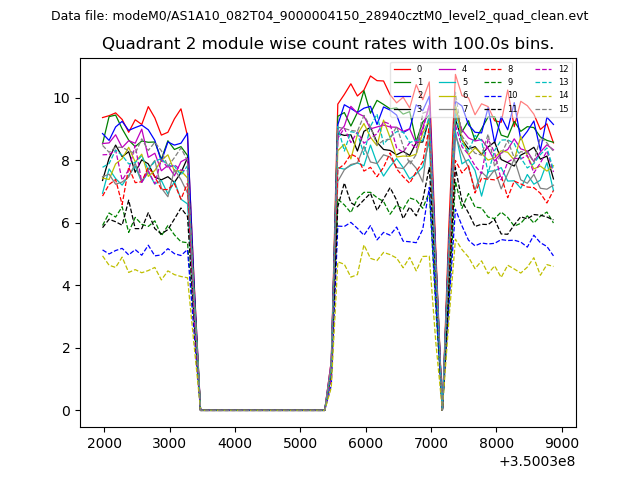
| Module-wise count rates for Quadrant B Data is divided into 100 sec bins |
 |
 |
| Module-wise count rates for Quadrant C Data is divided into 100 sec bins |
 |
 |
| Module-wise count rates for Quadrant D Data is divided into 100 sec bins |
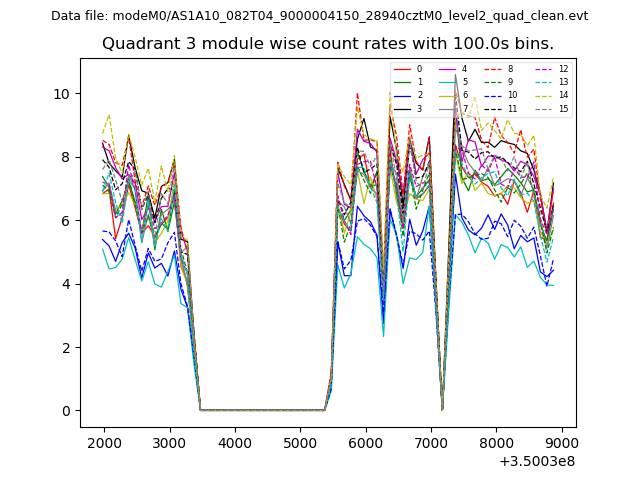 |
 |
| Parameter | Plot |
|---|---|
| CZT HV Monitor | 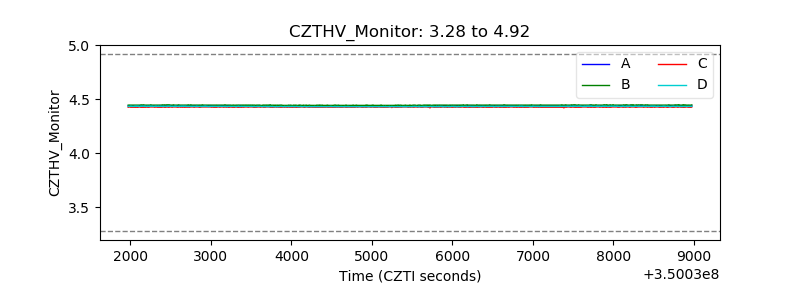 |
| D_VDD | 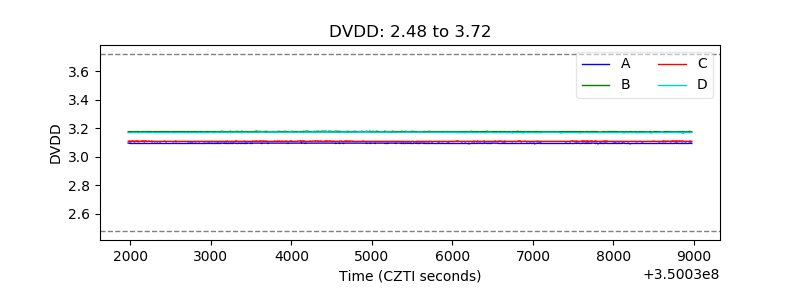 |
| Temperature 1 | 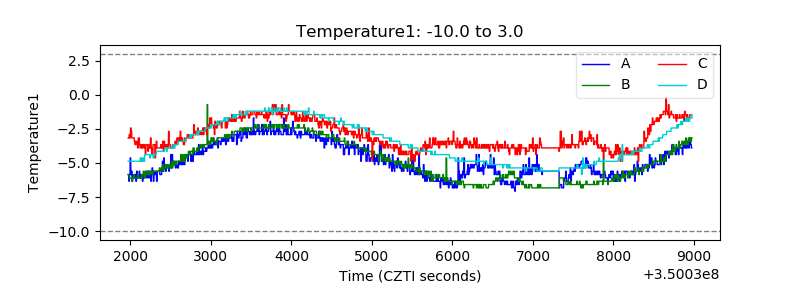 |
| Veto HV Monitor | 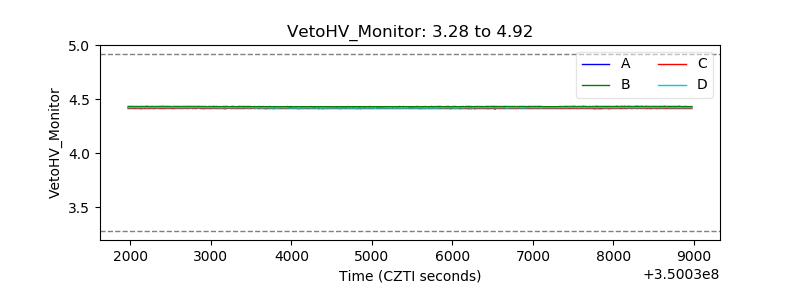 |
| Veto LLD | 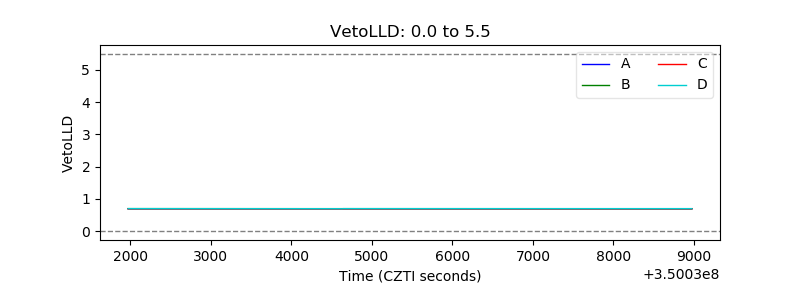 |
| Alpha Counter | 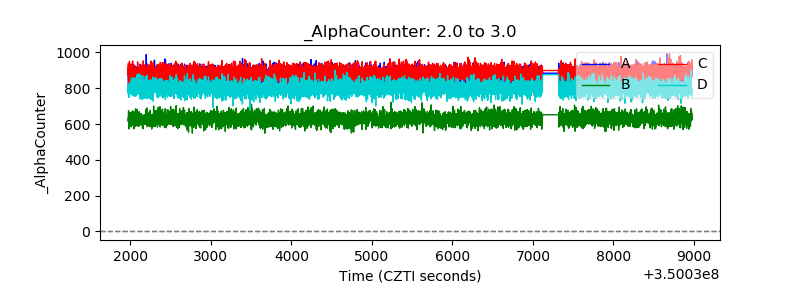 |
| _CPM_Rate | 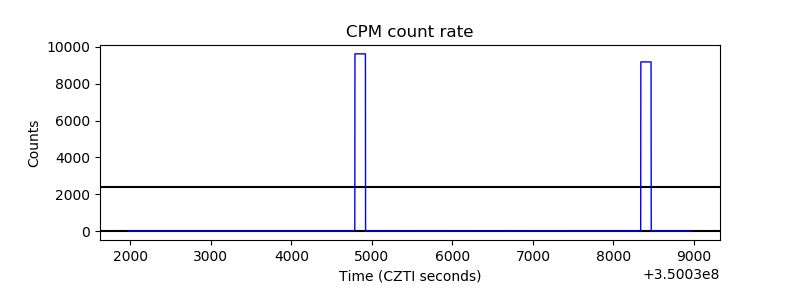 |
| CZT Counter | 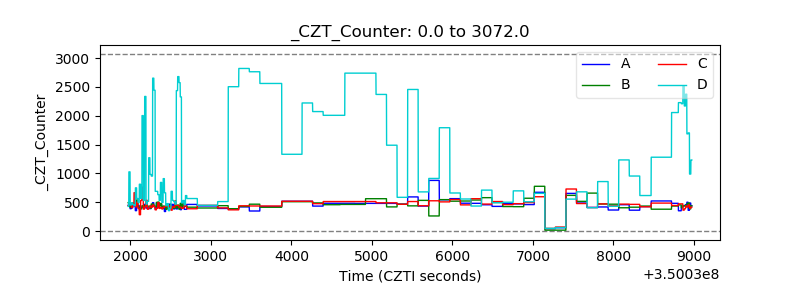 |
| +2.5 Volts monitor |  |
| +5 Volts monitor |  |
| _ROLL_ROT | 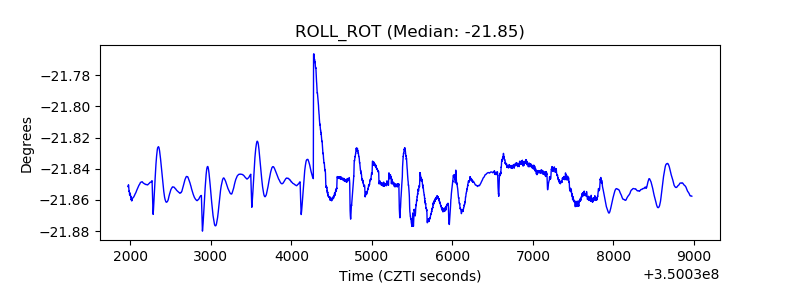 |
| _Roll_DEC | 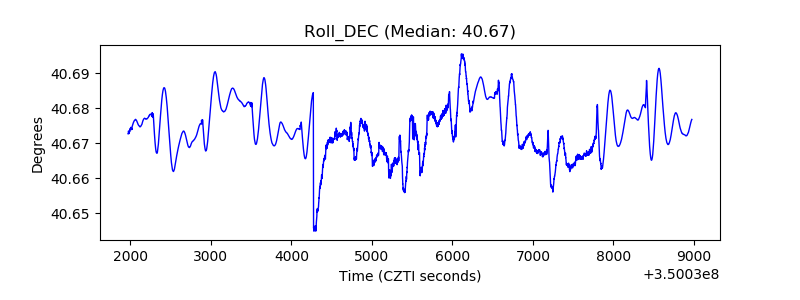 |
| _Roll_RA |  |
| Veto Counter | 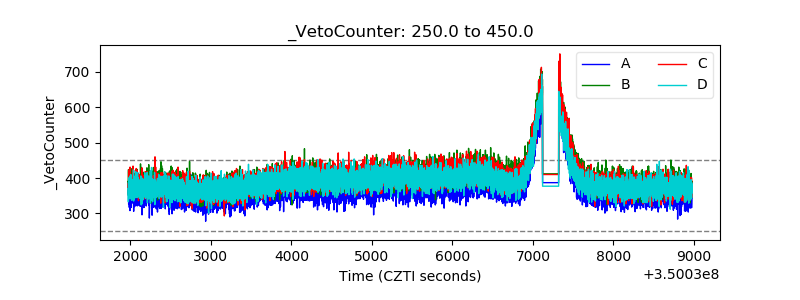 |