| Param | Original file | Final file |
|---|---|---|
| Filename | modeM0/AS1A10_082T04_9000004150_28944cztM0_level2.evt | modeM0/AS1A10_082T04_9000004150_28944cztM0_level2_quad_clean.evt |
| Size (bytes) | 1,676,727,360 | 197,225,280 |
| Size | 1.6 GB | 188.1 MB |
| Events in quadrant A | 8,427,762 | 1,242,198 |
| Events in quadrant B | 8,722,059 | 1,265,488 |
| Events in quadrant C | 8,620,322 | 1,212,025 |
| Events in quadrant D | 23,800,586 | 1,016,675 |
| Mode SS | |||
|---|---|---|---|
| Quadrant | BADHDUFLAG | Total packets | Discarded packets |
| A | 0 | 366 | 0 |
| B | 0 | 366 | 0 |
| C | 0 | 366 | 0 |
| D | 0 | 366 | 0 |
| Mode M0 | |||
|---|---|---|---|
| Quadrant | BADHDUFLAG | Total packets | Discarded packets |
| A | 0 | 36583 | 3 |
| B | 0 | 37270 | 3 |
| C | 0 | 36798 | 3 |
| D | 0 | 82780 | 3 |
| Mode M9 | |||
|---|---|---|---|
| Quadrant | BADHDUFLAG | Total packets | Discarded packets |
| A | 0 | 20 | 0 |
| B | 0 | 20 | 0 |
| C | 0 | 20 | 0 |
| D | 0 | 20 | 0 |
| Quadrant | Total seconds | Saturated seconds | Saturation percentage |
|---|---|---|---|
| A | 17910 | 177 | 0.988275% |
| B | 17911 | 211 | 1.178047% |
| C | 17911 | 446 | 2.490090% |
| D | 17911 | 5840 | 32.605661% |
Noise dominated data is calculated using 1-second bins in cleaned event files. If a bin has >2000 counts, and if more than 50% of those come from <1% of pixels, then it is considered to be noise-dominated and hence unusable.
| Quadrant | # 1 sec bins | Bins with >0 counts | Bins with >2000 counts | High rate bins dominated by noise | Noise dominated (total time) | Noise dominated (detector-on time) | Marked lightcurve |
|---|---|---|---|---|---|---|---|
| A | 19959 | 17912 | 5 | 5 | 0.03% | 0.03% | 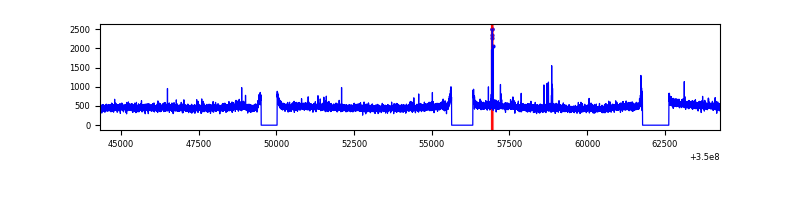 |
| B | 19960 | 17913 | 10 | 10 | 0.05% | 0.06% | 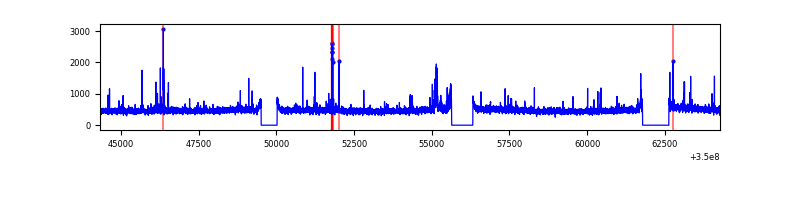 |
| C | 19960 | 17913 | 0 | 0 | 0.00% | 0.00% |  |
| D | 19960 | 17913 | 5656 | 5656 | 28.34% | 31.57% |  |
Top three noisy pixels from each quadrant. If the there are fewer than three noisy pixels in the level2.evt file, extra rows are filled as -1
| Pixel properties | Quadrant properties | ||||||
|---|---|---|---|---|---|---|---|
| Quadrant | DetID | PixID | Counts | Sigma | Mean | Median | Sigma |
| A | 12 | 96 | 57496 | 127.31 | 2165 | 2119 | 435.0 |
| A | 13 | 254 | 29523 | 63.0 | 2165 | 2119 | 435.0 |
| A | 3 | 137 | 21758 | 45.15 | 2165 | 2119 | 435.0 |
| B | 10 | 245 | 195554 | 472.59 | 2146 | 2090 | 409.4 |
| B | 12 | 111 | 52123 | 122.22 | 2146 | 2090 | 409.4 |
| B | 11 | 111 | 47118 | 109.99 | 2146 | 2090 | 409.4 |
| C | 14 | 238 | 394987 | 811.73 | 2065 | 2074 | 484.0 |
| C | 14 | 254 | 99938 | 202.18 | 2065 | 2074 | 484.0 |
| C | 2 | 114 | 42655 | 83.84 | 2065 | 2074 | 484.0 |
| D | 8 | 195 | 13311192 | 30031.18 | 1853 | 1803 | 443.2 |
| D | 1 | 52 | 3241289 | 7309.55 | 1853 | 1803 | 443.2 |
| D | 12 | 79 | 129356 | 287.81 | 1853 | 1803 | 443.2 |
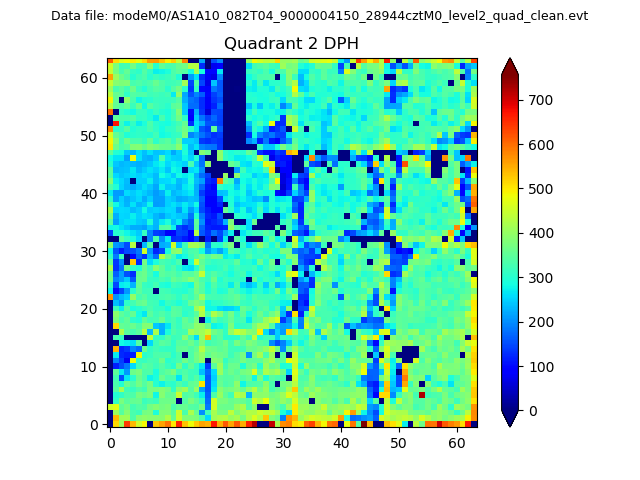
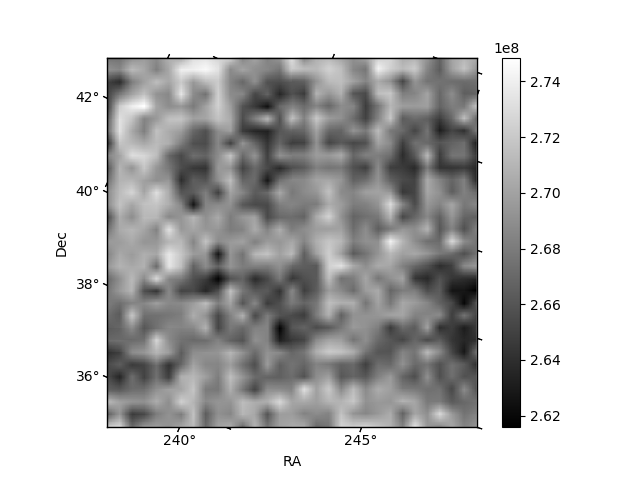
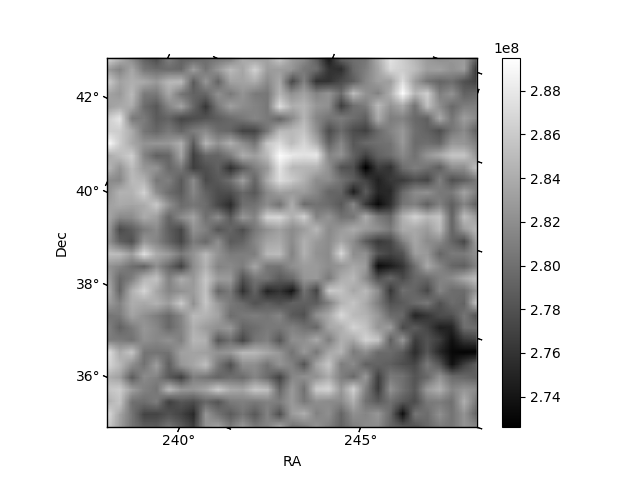
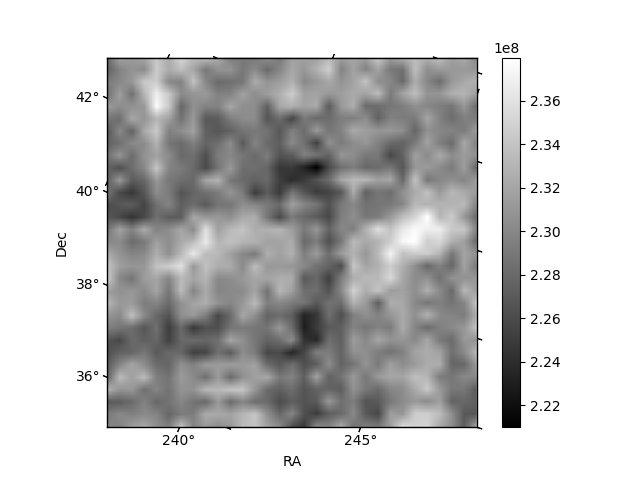
Histogram calculated using DETX and DETY for each event in the final _common_clean file
| Quadrant A | 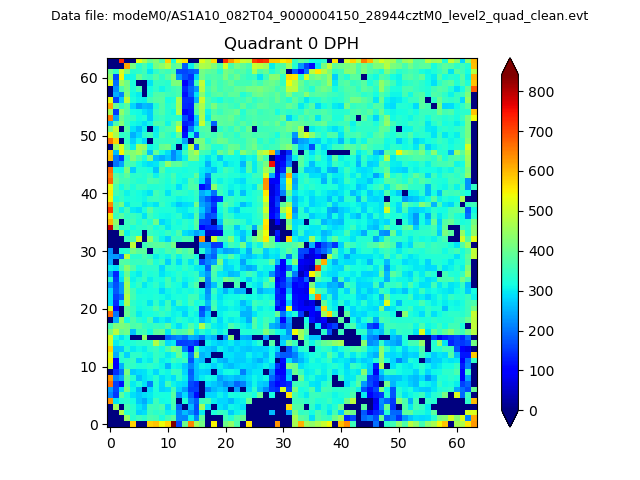 |
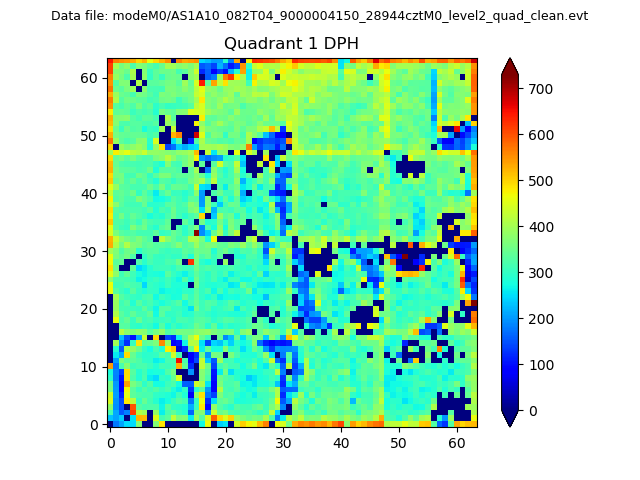 |
Quadrant B |
|---|---|---|---|
| Quadrant D | 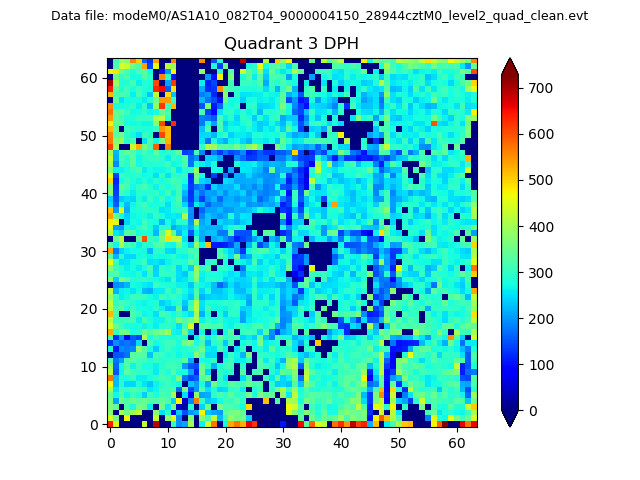 |
 |
Quadrant C |
| Plot type | Count rate plots | Images |
|---|---|---|
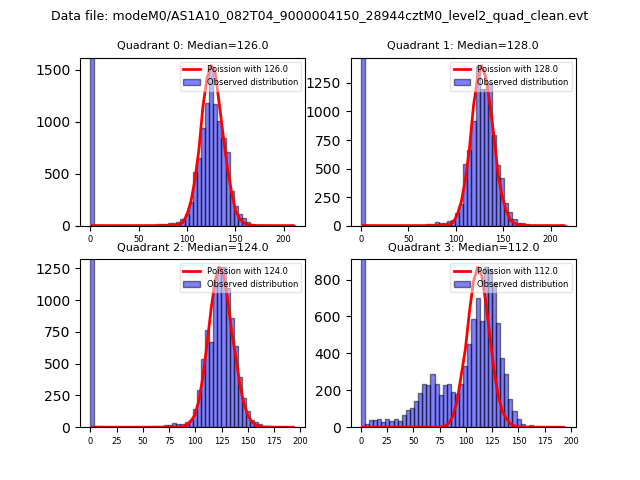
| Comparison with Poisson distribution Blue bars denote a histogram of data divided into 1 sec bins. Red curve is a Poisson curve with rate = median count rate of data. |
 |
 |
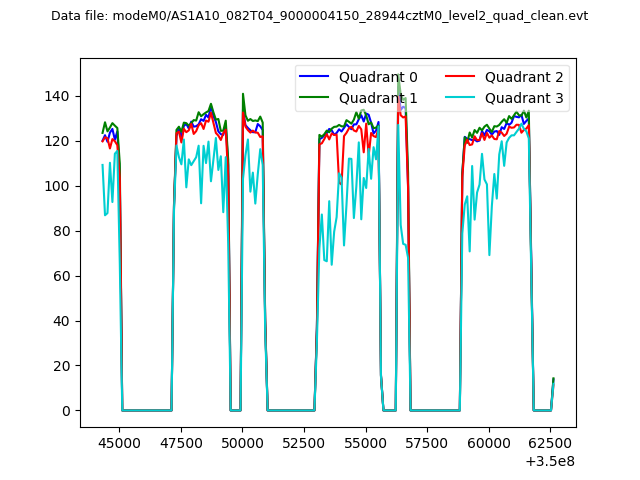
| Quadrant-wise count rates Data is divided into 100 sec bins |
 |
|
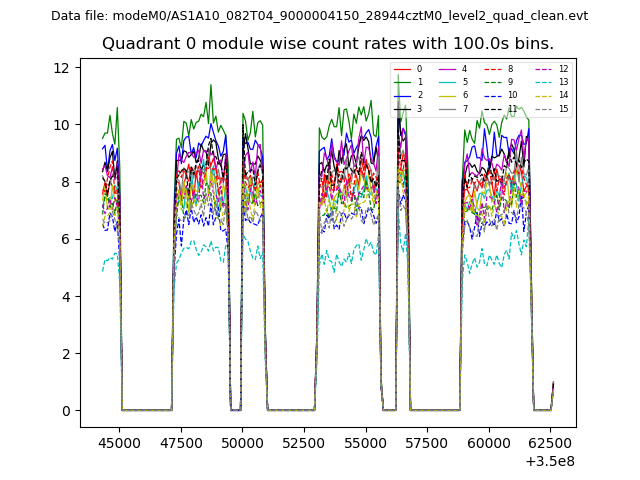
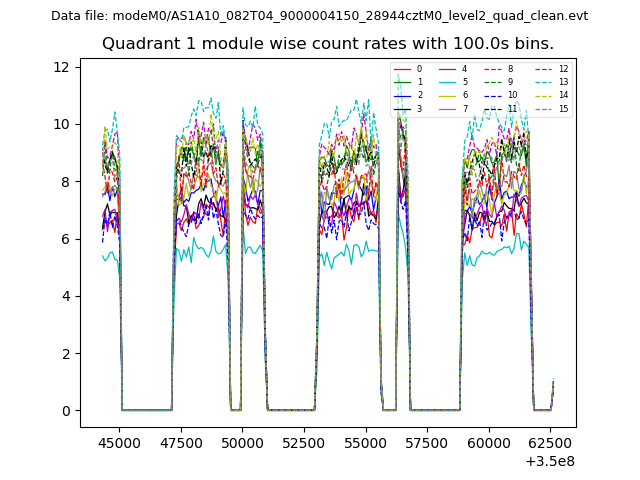
| Module-wise count rates for Quadrant A Data is divided into 100 sec bins |
 |
 |
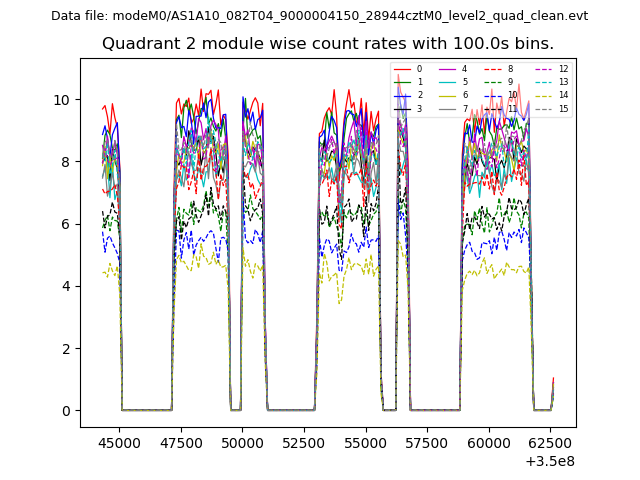
| Module-wise count rates for Quadrant B Data is divided into 100 sec bins |
 |
 |
| Module-wise count rates for Quadrant C Data is divided into 100 sec bins |
 |
 |
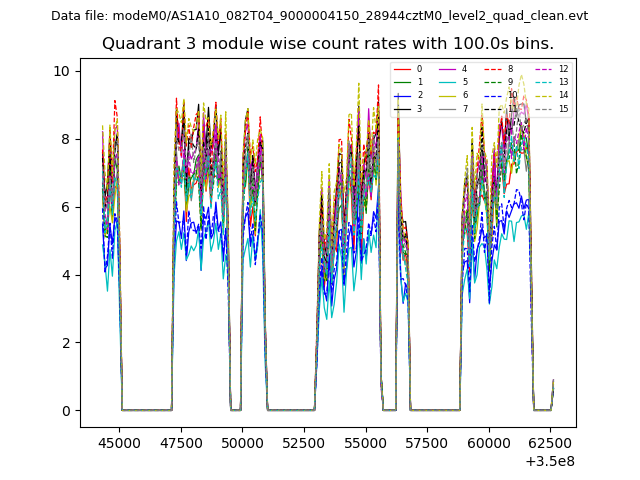
| Module-wise count rates for Quadrant D Data is divided into 100 sec bins |
 |
 |
| Parameter | Plot |
|---|---|
| CZT HV Monitor | 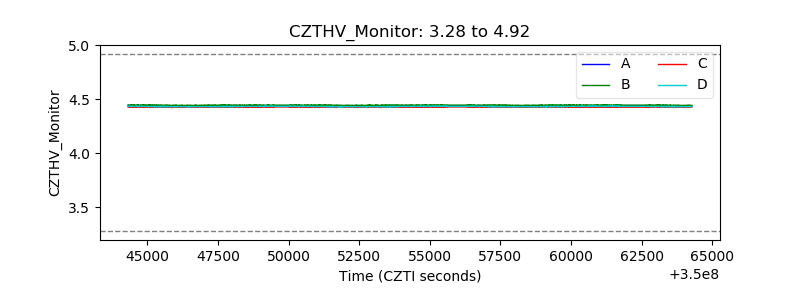 |
| D_VDD | 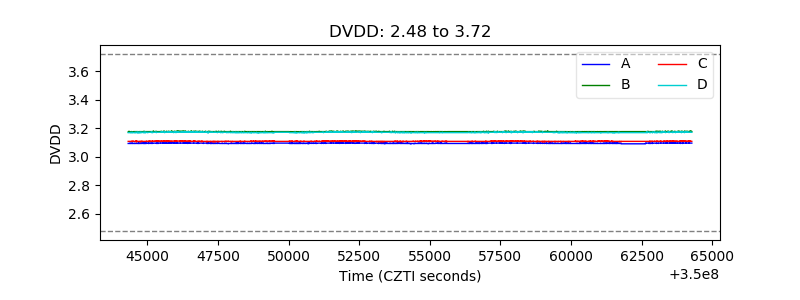 |
| Temperature 1 | 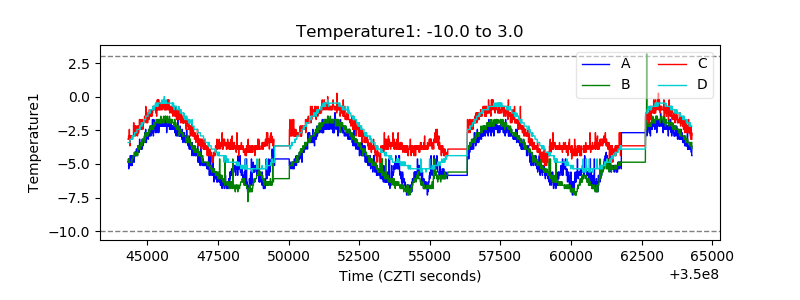 |
| Veto HV Monitor | 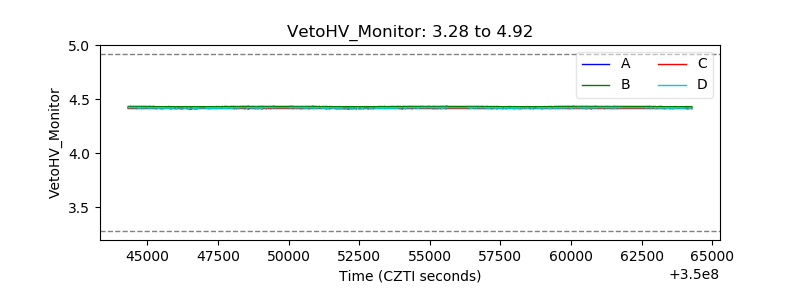 |
| Veto LLD | 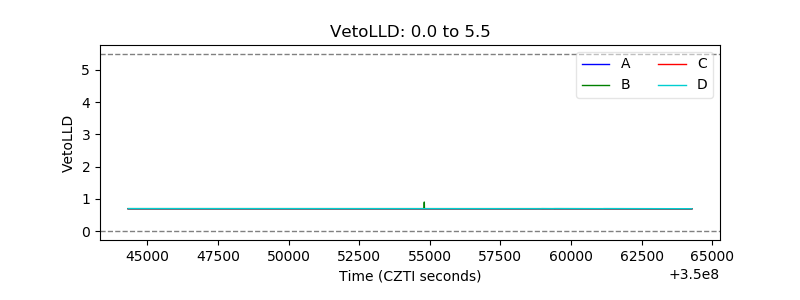 |
| Alpha Counter | 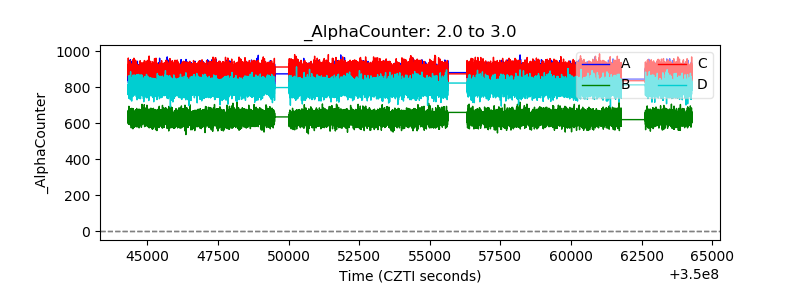 |
| _CPM_Rate | 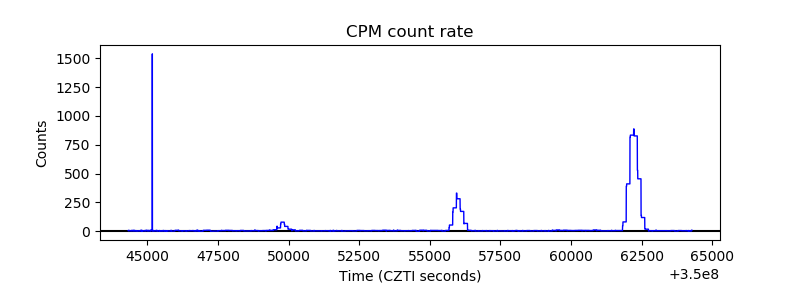 |
| CZT Counter | 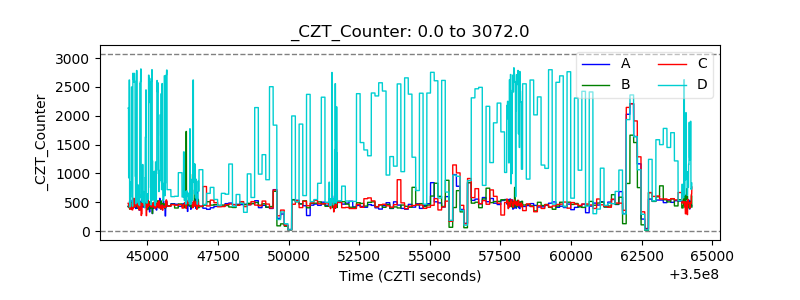 |
| +2.5 Volts monitor |  |
| +5 Volts monitor |  |
| _ROLL_ROT | 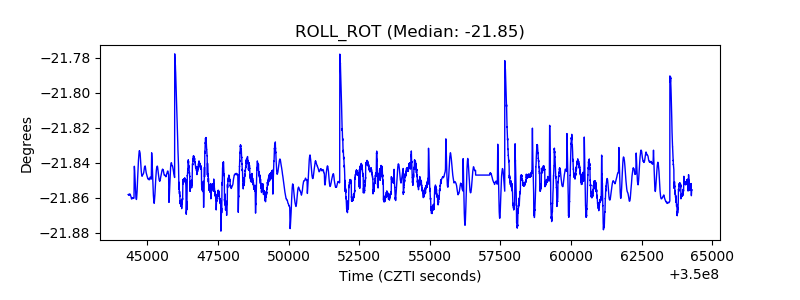 |
| _Roll_DEC | 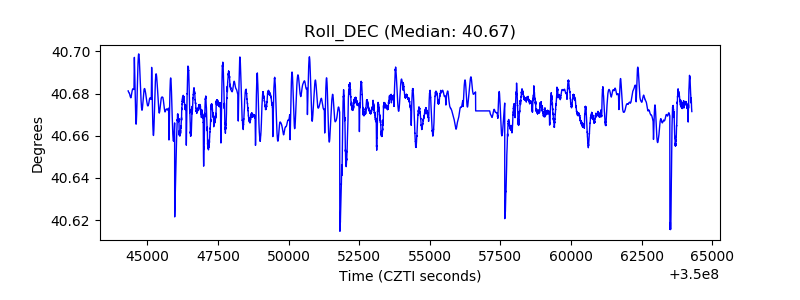 |
| _Roll_RA | 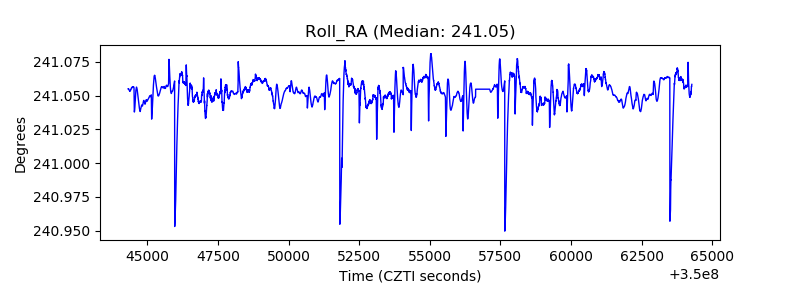 |
| Veto Counter | 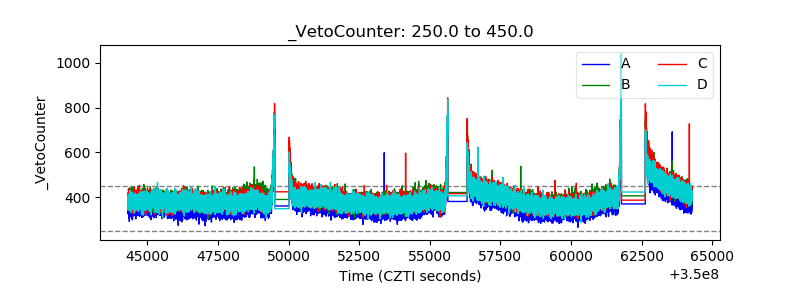 |