| Param | Original file | Final file |
|---|---|---|
| Filename | modeM0/AS1A10_123T08_9000004152_28945cztM0_level2.evt | modeM0/AS1A10_123T08_9000004152_28945cztM0_level2_quad_clean.evt |
| Size (bytes) | 280,172,160 | 41,209,920 |
| Size | 267.2 MB | 39.3 MB |
| Events in quadrant A | 1,556,426 | 262,168 |
| Events in quadrant B | 1,577,465 | 268,114 |
| Events in quadrant C | 1,599,132 | 258,378 |
| Events in quadrant D | 3,544,997 | 242,984 |
| Mode SS | |||
|---|---|---|---|
| Quadrant | BADHDUFLAG | Total packets | Discarded packets |
| A | 0 | 62 | 0 |
| B | 0 | 62 | 0 |
| C | 0 | 62 | 0 |
| D | 0 | 62 | 0 |
| Mode M0 | |||
|---|---|---|---|
| Quadrant | BADHDUFLAG | Total packets | Discarded packets |
| A | 0 | 6536 | 1 |
| B | 0 | 6633 | 2 |
| C | 0 | 6749 | 1 |
| D | 0 | 12633 | 1 |
| Mode M9 | |||
|---|---|---|---|
| Quadrant | BADHDUFLAG | Total packets | Discarded packets |
| A | 0 | 10 | 0 |
| B | 0 | 10 | 0 |
| C | 0 | 10 | 0 |
| D | 0 | 10 | 0 |
| Quadrant | Total seconds | Saturated seconds | Saturation percentage |
|---|---|---|---|
| A | 3030 | 46 | 1.518152% |
| B | 3029 | 48 | 1.584681% |
| C | 3029 | 89 | 2.938263% |
| D | 3029 | 492 | 16.242984% |
Noise dominated data is calculated using 1-second bins in cleaned event files. If a bin has >2000 counts, and if more than 50% of those come from <1% of pixels, then it is considered to be noise-dominated and hence unusable.
| Quadrant | # 1 sec bins | Bins with >0 counts | Bins with >2000 counts | High rate bins dominated by noise | Noise dominated (total time) | Noise dominated (detector-on time) | Marked lightcurve |
|---|---|---|---|---|---|---|---|
| A | 4030 | 3033 | 0 | 0 | 0.00% | 0.00% | 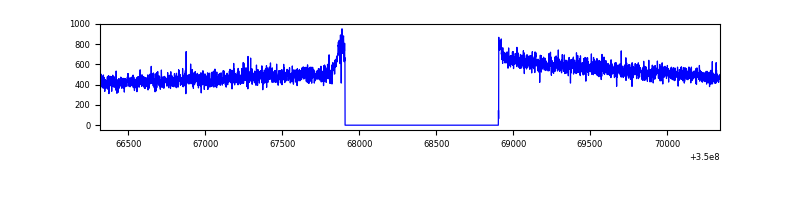 |
| B | 4029 | 3032 | 0 | 0 | 0.00% | 0.00% | 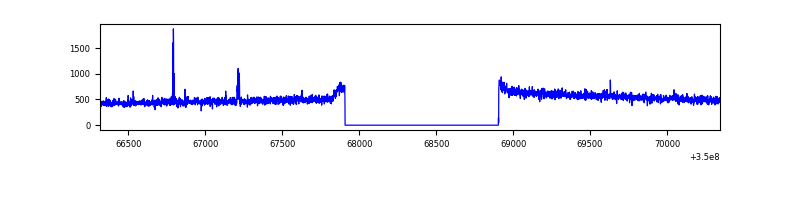 |
| C | 4029 | 3032 | 0 | 0 | 0.00% | 0.00% | 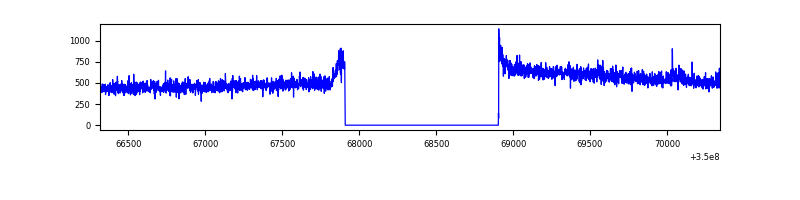 |
| D | 4029 | 3032 | 288 | 288 | 7.15% | 9.50% | 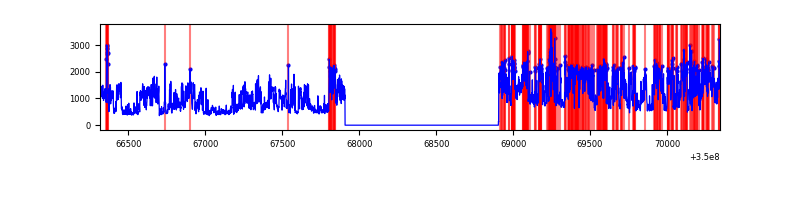 |
Top three noisy pixels from each quadrant. If the there are fewer than three noisy pixels in the level2.evt file, extra rows are filled as -1
| Pixel properties | Quadrant properties | ||||||
|---|---|---|---|---|---|---|---|
| Quadrant | DetID | PixID | Counts | Sigma | Mean | Median | Sigma |
| A | 13 | 254 | 5117 | 57.04 | 403 | 393 | 82.8 |
| A | 3 | 137 | 4023 | 43.83 | 403 | 393 | 82.8 |
| A | 0 | 226 | 3462 | 37.06 | 403 | 393 | 82.8 |
| B | 10 | 245 | 12599 | 157.04 | 399 | 389 | 77.8 |
| B | 12 | 111 | 9315 | 114.8 | 399 | 389 | 77.8 |
| B | 11 | 111 | 8479 | 104.05 | 399 | 389 | 77.8 |
| C | 14 | 238 | 62778 | 684.4 | 386 | 386 | 91.2 |
| C | 3 | 233 | 22918 | 247.16 | 386 | 386 | 91.2 |
| C | 2 | 114 | 7764 | 80.93 | 386 | 386 | 91.2 |
| D | 8 | 195 | 1628849 | 17808.84 | 375 | 363 | 91.4 |
| D | 1 | 52 | 392764 | 4291.23 | 375 | 363 | 91.4 |
| D | 5 | 233 | 45862 | 497.57 | 375 | 363 | 91.4 |
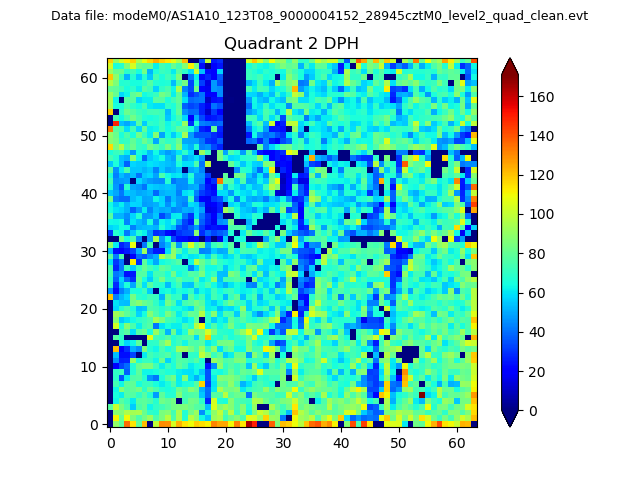
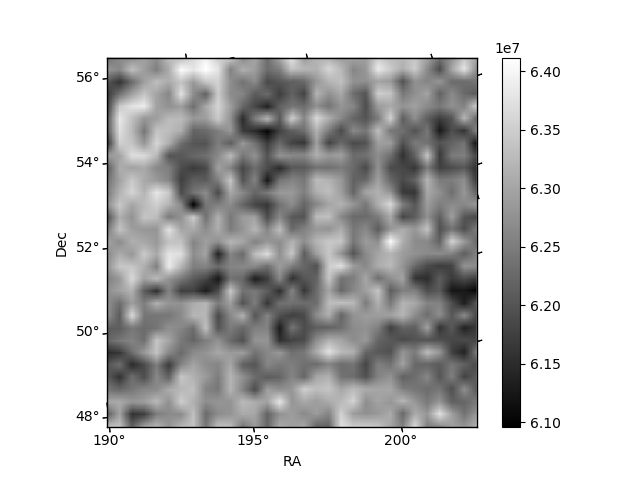
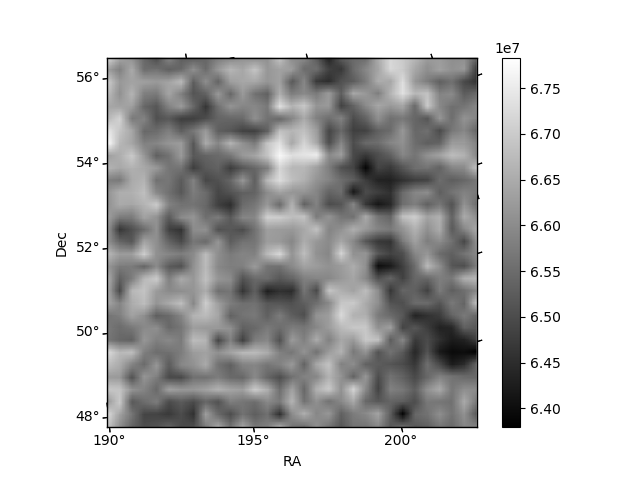
Histogram calculated using DETX and DETY for each event in the final _common_clean file
| Quadrant A | 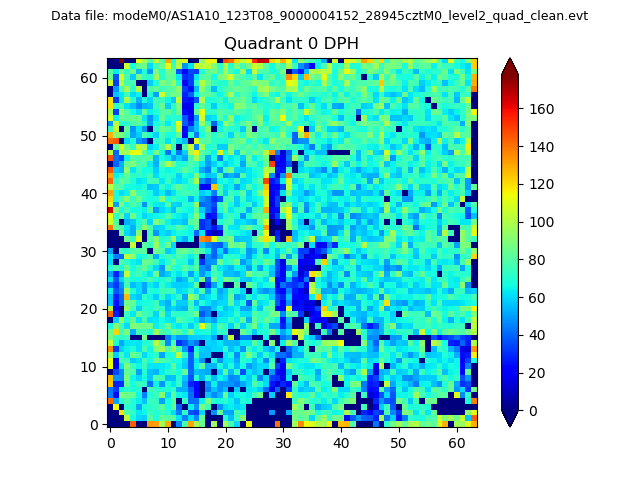 |
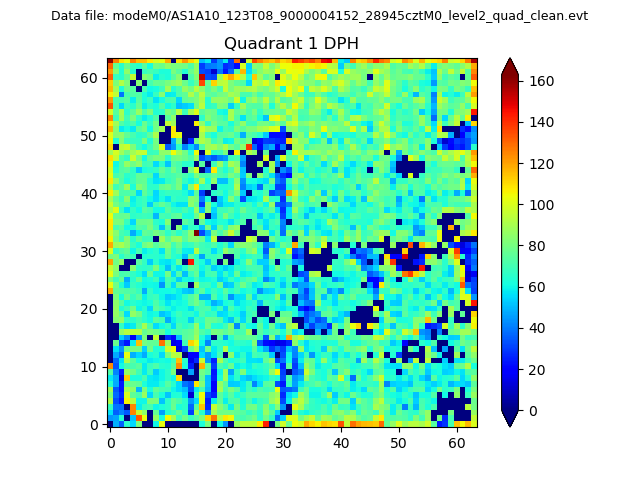 |
Quadrant B |
|---|---|---|---|
| Quadrant D | 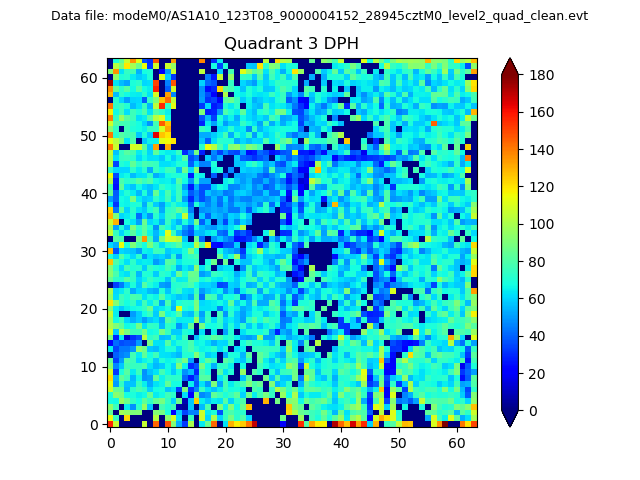 |
 |
Quadrant C |
| Plot type | Count rate plots | Images |
|---|---|---|
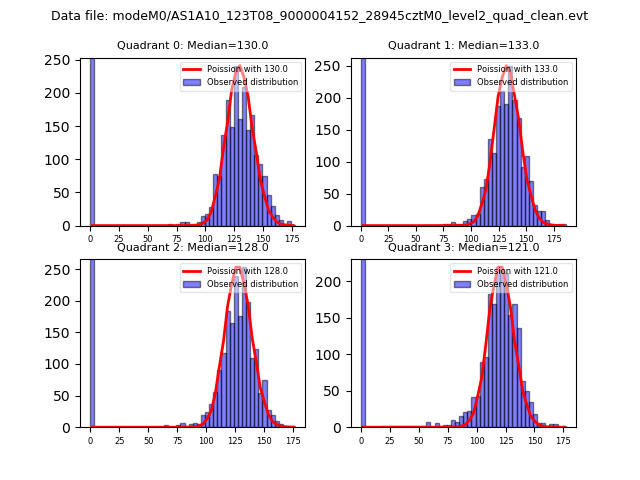
| Comparison with Poisson distribution Blue bars denote a histogram of data divided into 1 sec bins. Red curve is a Poisson curve with rate = median count rate of data. |
 |
 |
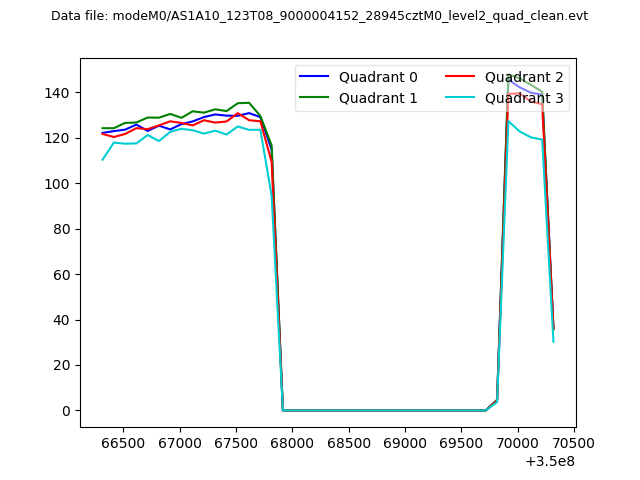
| Quadrant-wise count rates Data is divided into 100 sec bins |
 |
|
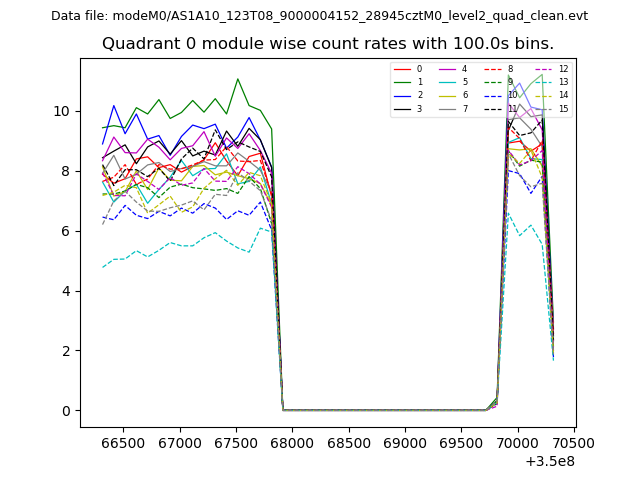
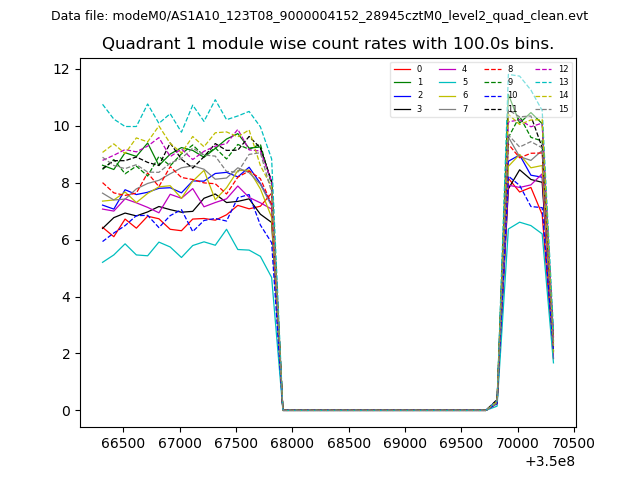
| Module-wise count rates for Quadrant A Data is divided into 100 sec bins |
 |
 |
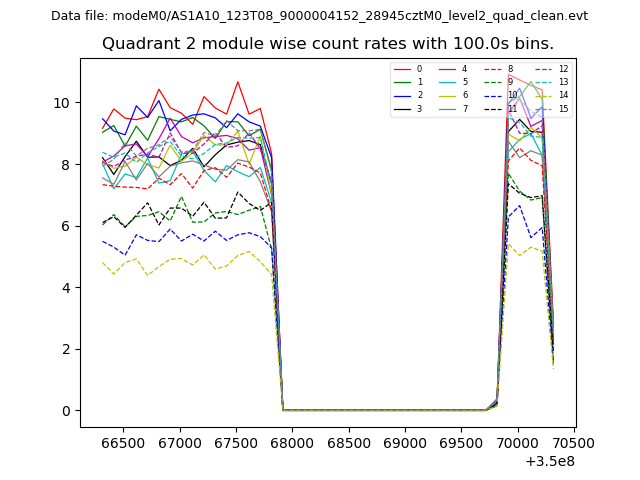
| Module-wise count rates for Quadrant B Data is divided into 100 sec bins |
 |
 |
| Module-wise count rates for Quadrant C Data is divided into 100 sec bins |
 |
 |
| Module-wise count rates for Quadrant D Data is divided into 100 sec bins |
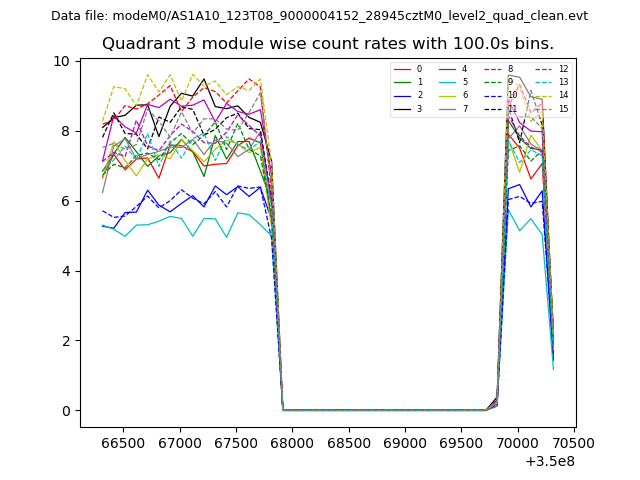 |
 |
| Parameter | Plot |
|---|---|
| CZT HV Monitor | 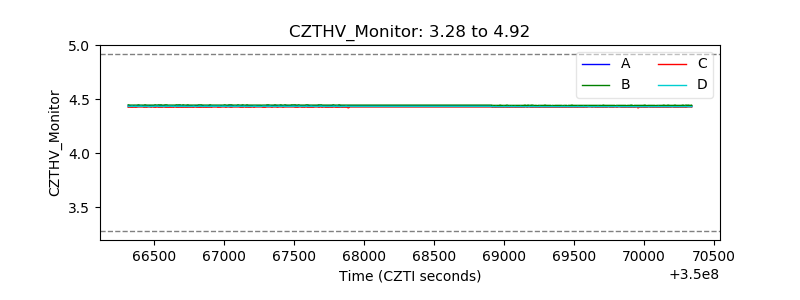 |
| D_VDD | 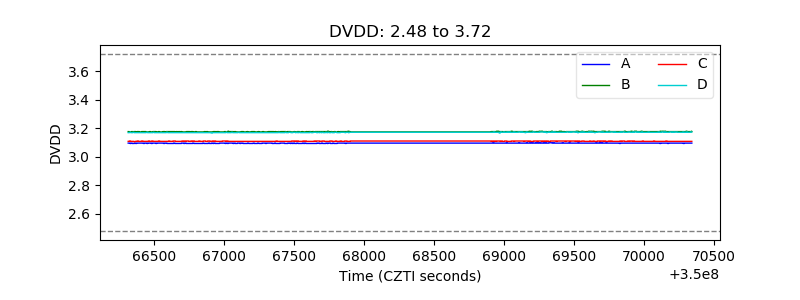 |
| Temperature 1 | 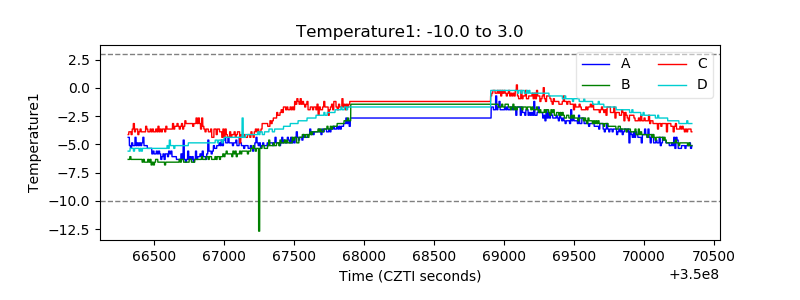 |
| Veto HV Monitor | 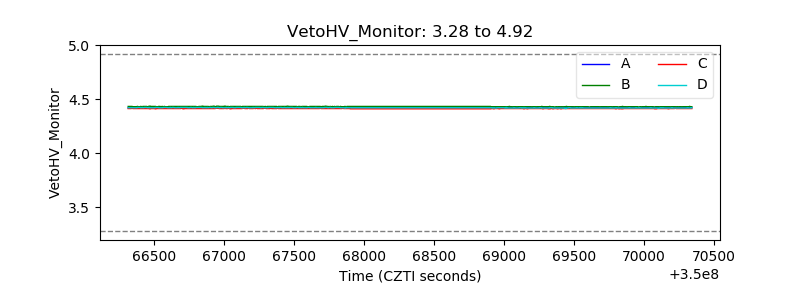 |
| Veto LLD | 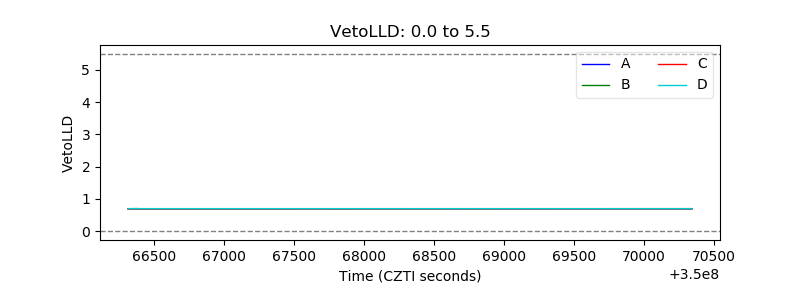 |
| Alpha Counter | 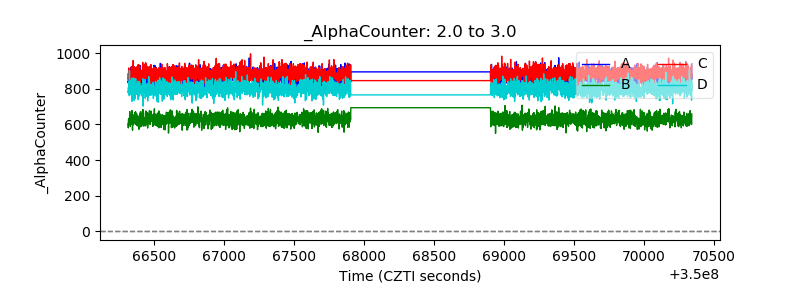 |
| _CPM_Rate | 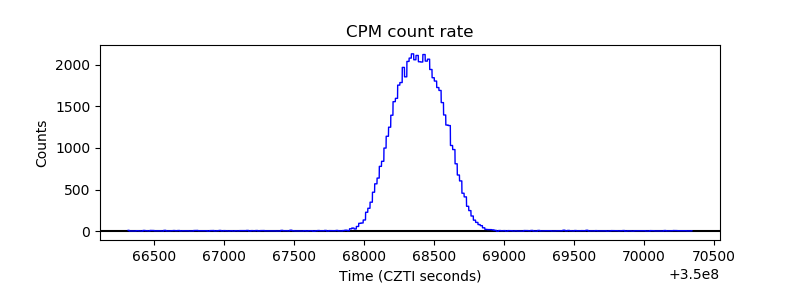 |
| CZT Counter | 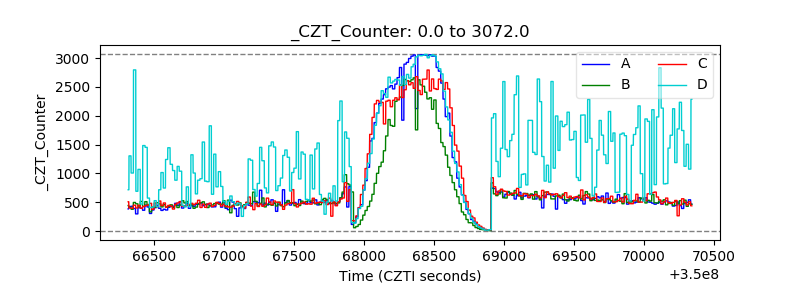 |
| +2.5 Volts monitor |  |
| +5 Volts monitor | 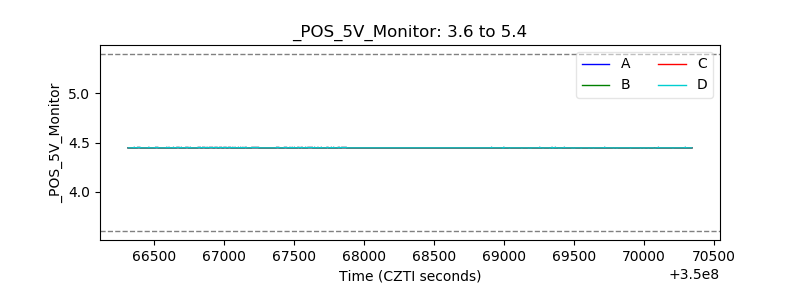 |
| _ROLL_ROT | 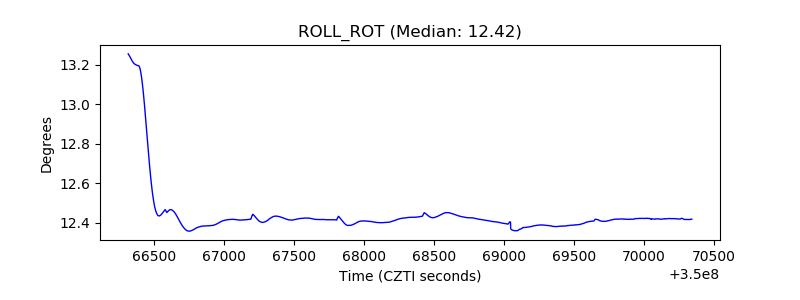 |
| _Roll_DEC | 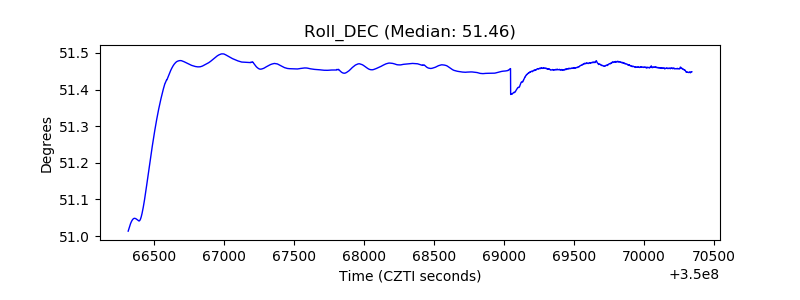 |
| _Roll_RA | 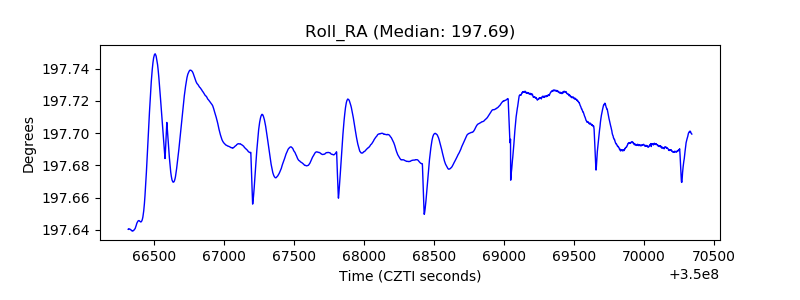 |
| Veto Counter | 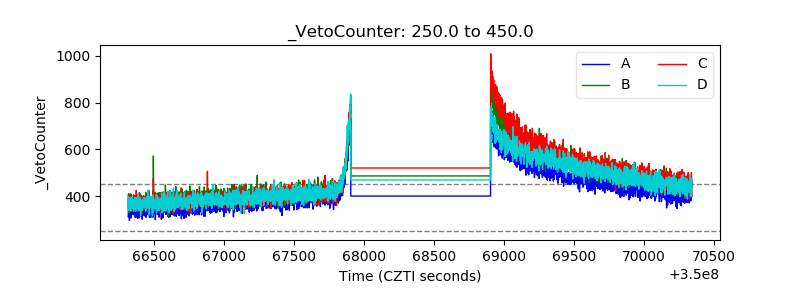 |