| Param | Original file | Final file |
|---|---|---|
| Filename | modeM0/AS1A10_123T08_9000004152_28948cztM0_level2.evt | modeM0/AS1A10_123T08_9000004152_28948cztM0_level2_quad_clean.evt |
| Size (bytes) | 689,800,320 | 101,917,440 |
| Size | 657.8 MB | 97.2 MB |
| Events in quadrant A | 3,165,120 | 706,773 |
| Events in quadrant B | 3,292,380 | 735,905 |
| Events in quadrant C | 3,458,670 | 703,805 |
| Events in quadrant D | 10,551,292 | 502,742 |
| Mode SS | |||
|---|---|---|---|
| Quadrant | BADHDUFLAG | Total packets | Discarded packets |
| A | 0 | 126 | 0 |
| B | 0 | 126 | 0 |
| C | 0 | 126 | 0 |
| D | 0 | 126 | 0 |
| Mode M0 | |||
|---|---|---|---|
| Quadrant | BADHDUFLAG | Total packets | Discarded packets |
| A | 0 | 13573 | 3 |
| B | 0 | 13905 | 2 |
| C | 0 | 14458 | 2 |
| D | 0 | 35669 | 2 |
| Mode M9 | |||
|---|---|---|---|
| Quadrant | BADHDUFLAG | Total packets | Discarded packets |
| A | 0 | 18 | 0 |
| B | 0 | 19 | 0 |
| C | 0 | 19 | 0 |
| D | 0 | 19 | 0 |
| Quadrant | Total seconds | Saturated seconds | Saturation percentage |
|---|---|---|---|
| A | 6254 | 47 | 0.751519% |
| B | 6254 | 60 | 0.959386% |
| C | 6254 | 196 | 3.133994% |
| D | 6254 | 3032 | 48.480972% |
Noise dominated data is calculated using 1-second bins in cleaned event files. If a bin has >2000 counts, and if more than 50% of those come from <1% of pixels, then it is considered to be noise-dominated and hence unusable.
| Quadrant | # 1 sec bins | Bins with >0 counts | Bins with >2000 counts | High rate bins dominated by noise | Noise dominated (total time) | Noise dominated (detector-on time) | Marked lightcurve |
|---|---|---|---|---|---|---|---|
| A | 7479 | 6257 | 0 | 0 | 0.00% | 0.00% | 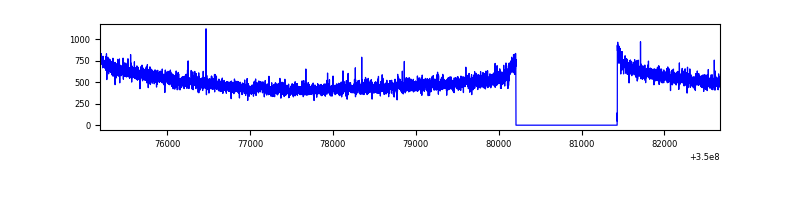 |
| B | 7479 | 6257 | 1 | 1 | 0.01% | 0.02% | 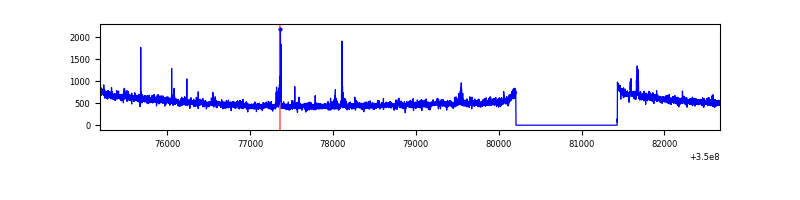 |
| C | 7479 | 6257 | 0 | 0 | 0.00% | 0.00% | 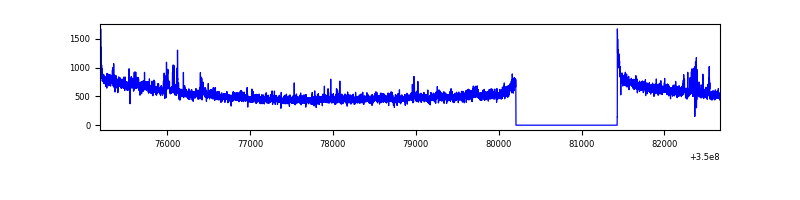 |
| D | 7479 | 6257 | 2930 | 2930 | 39.18% | 46.83% | 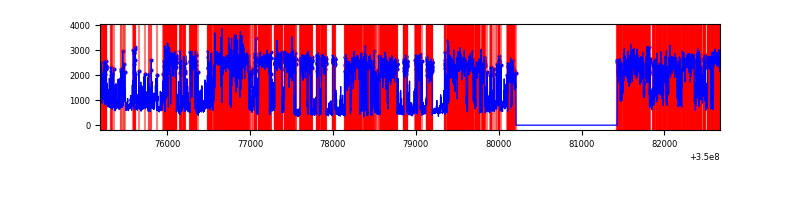 |
Top three noisy pixels from each quadrant. If the there are fewer than three noisy pixels in the level2.evt file, extra rows are filled as -1
| Pixel properties | Quadrant properties | ||||||
|---|---|---|---|---|---|---|---|
| Quadrant | DetID | PixID | Counts | Sigma | Mean | Median | Sigma |
| A | 13 | 254 | 11183 | 64.35 | 818 | 803 | 161.3 |
| A | 3 | 137 | 7746 | 43.04 | 818 | 803 | 161.3 |
| A | 0 | 226 | 6914 | 37.89 | 818 | 803 | 161.3 |
| B | 15 | 33 | 20082 | 124.14 | 825 | 805 | 155.3 |
| B | 12 | 111 | 18190 | 111.96 | 825 | 805 | 155.3 |
| B | 10 | 245 | 18113 | 111.46 | 825 | 805 | 155.3 |
| C | 14 | 238 | 152939 | 819.77 | 800 | 806 | 185.6 |
| C | 3 | 233 | 135363 | 725.06 | 800 | 806 | 185.6 |
| C | 14 | 254 | 36836 | 194.15 | 800 | 806 | 185.6 |
| D | 8 | 195 | 5078149 | 33431.45 | 644 | 626 | 151.9 |
| D | 1 | 52 | 1516634 | 9981.7 | 644 | 626 | 151.9 |
| D | 7 | 80 | 1139600 | 7499.24 | 644 | 626 | 151.9 |
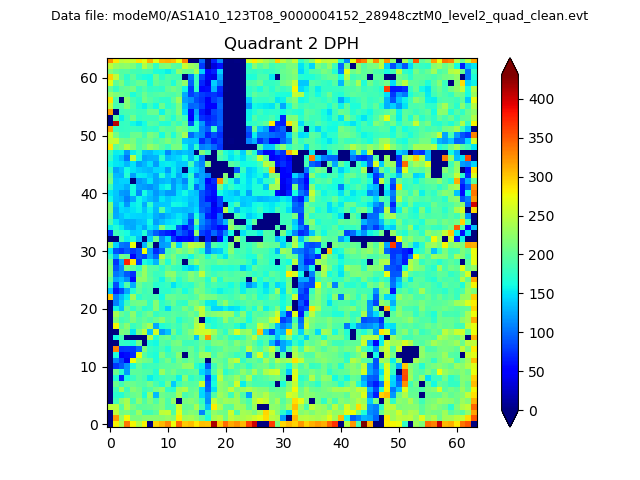
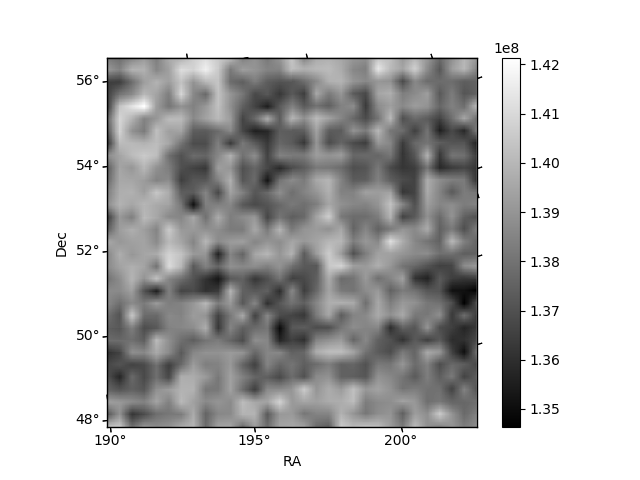
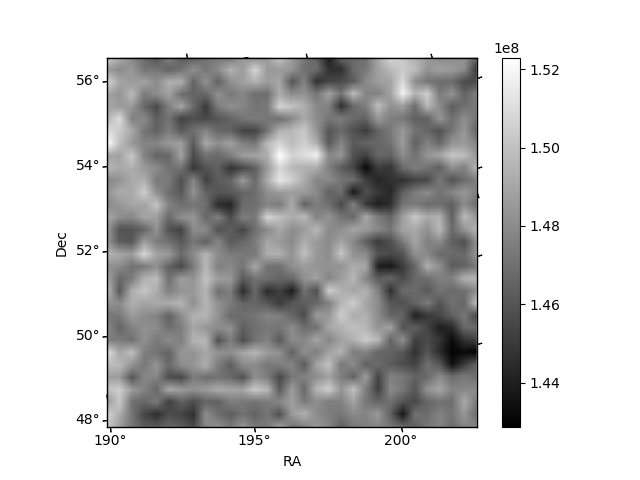
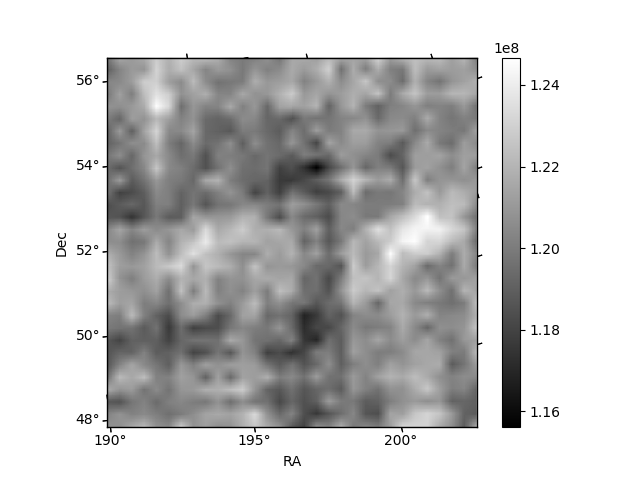
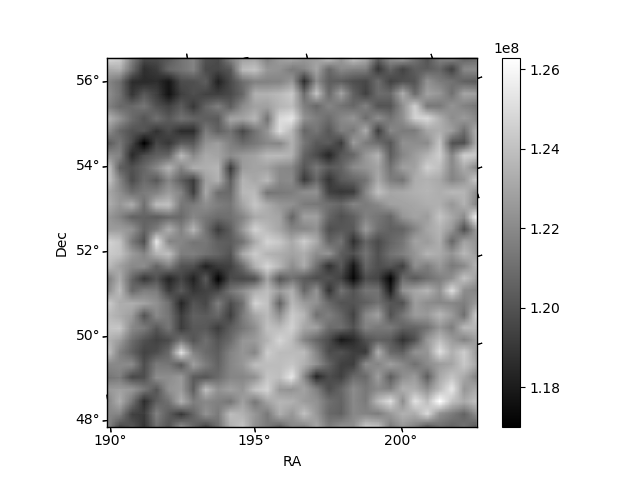
Histogram calculated using DETX and DETY for each event in the final _common_clean file
| Quadrant A | 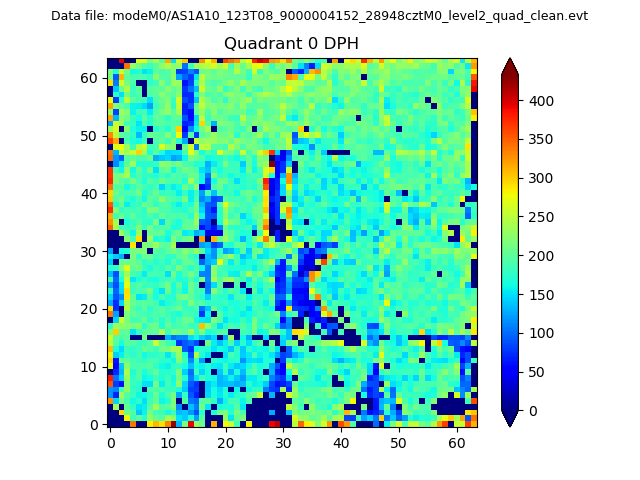 |
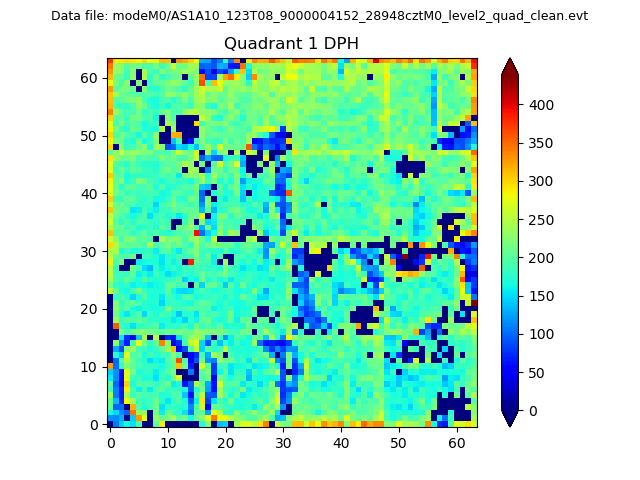 |
Quadrant B |
|---|---|---|---|
| Quadrant D | 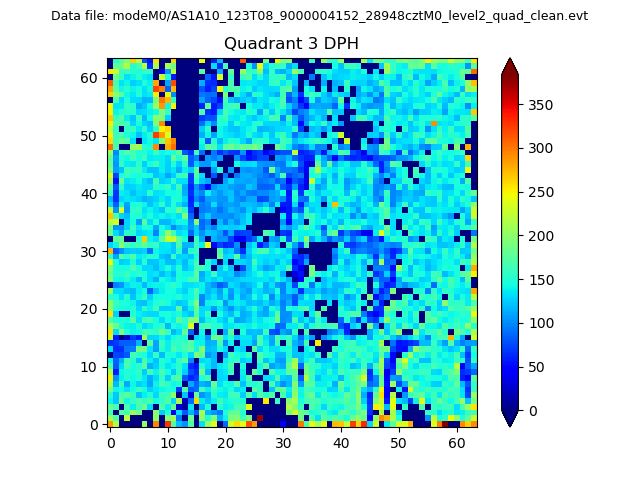 |
 |
Quadrant C |
| Plot type | Count rate plots | Images |
|---|---|---|
| Comparison with Poisson distribution Blue bars denote a histogram of data divided into 1 sec bins. Red curve is a Poisson curve with rate = median count rate of data. |
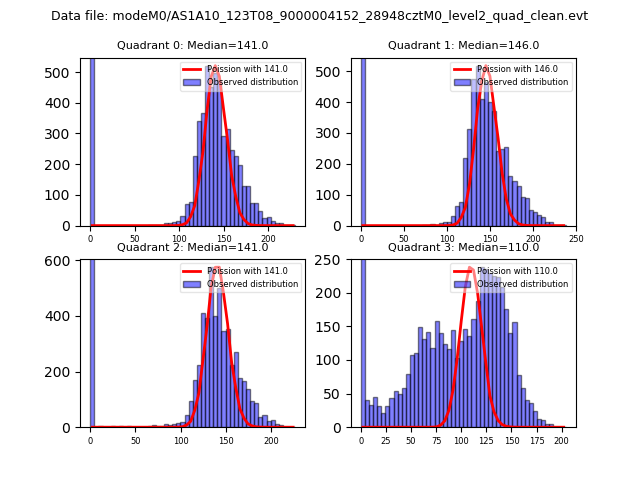 |
 |
| Quadrant-wise count rates Data is divided into 100 sec bins |
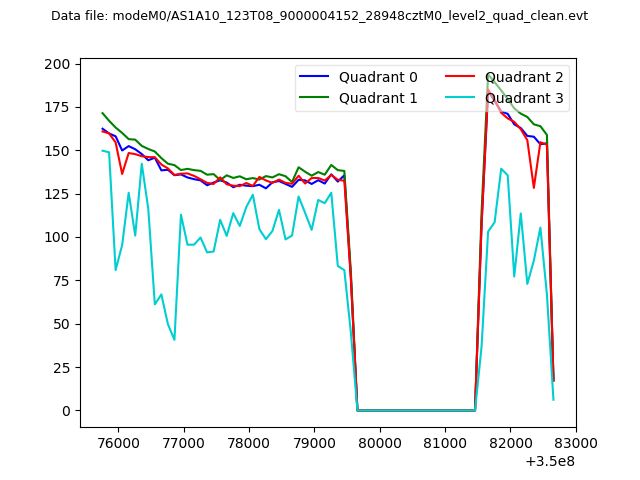 |
|
| Module-wise count rates for Quadrant A Data is divided into 100 sec bins |
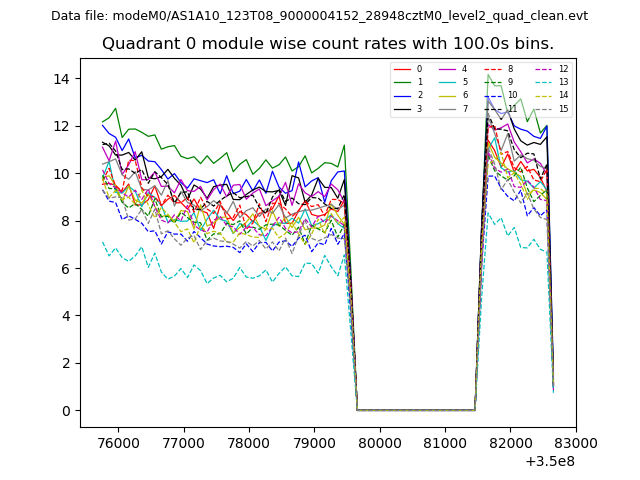 |
 |
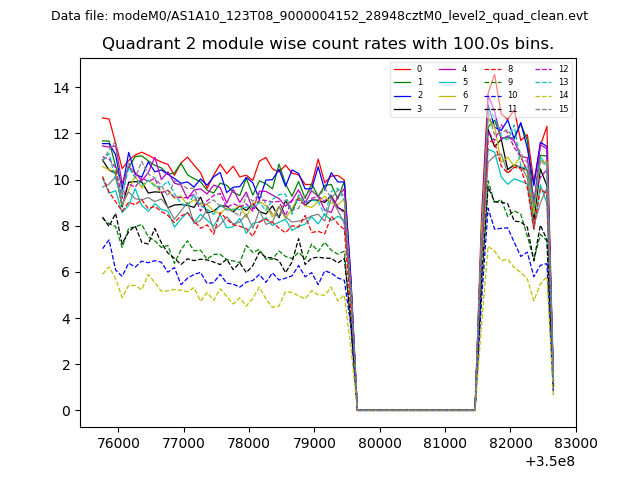
| Module-wise count rates for Quadrant B Data is divided into 100 sec bins |
 |
 |
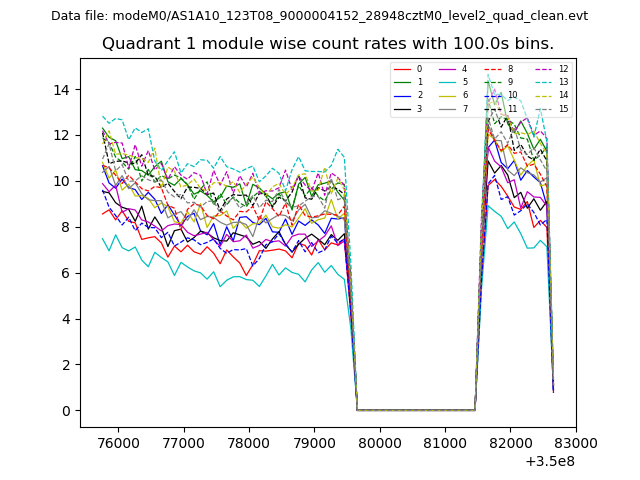
| Module-wise count rates for Quadrant C Data is divided into 100 sec bins |
 |
 |
| Module-wise count rates for Quadrant D Data is divided into 100 sec bins |
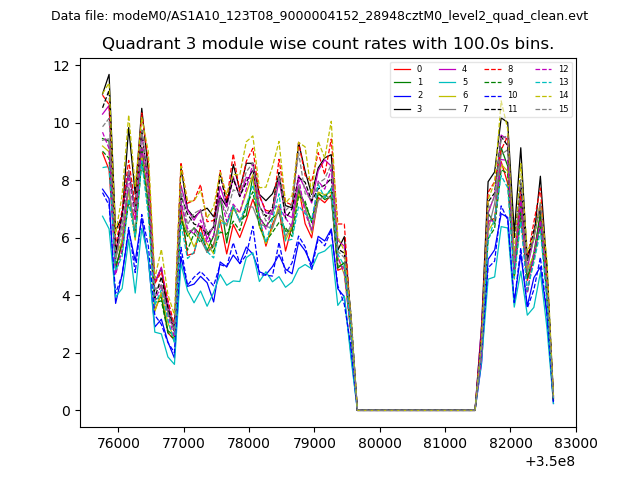 |
 |
| Parameter | Plot |
|---|---|
| CZT HV Monitor | 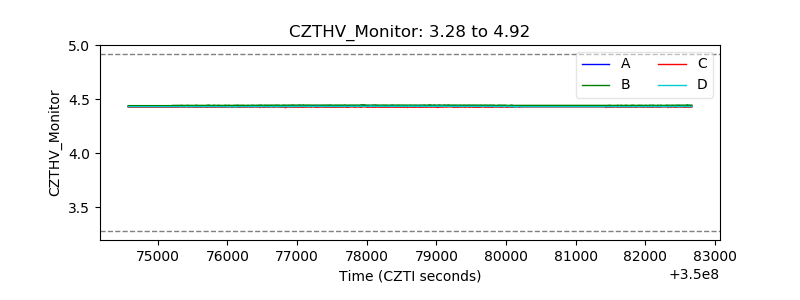 |
| D_VDD |  |
| Temperature 1 | 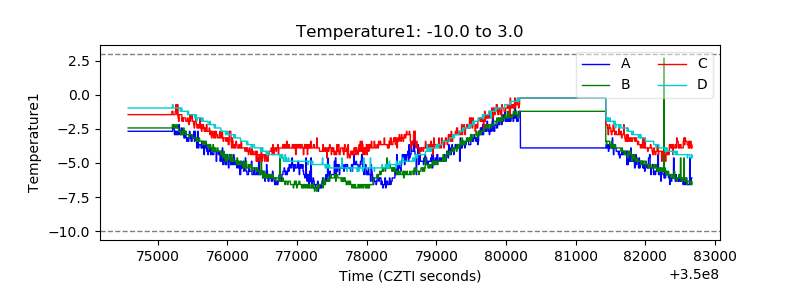 |
| Veto HV Monitor | 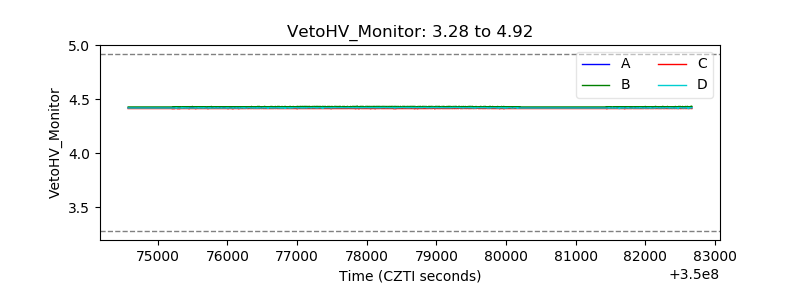 |
| Veto LLD | 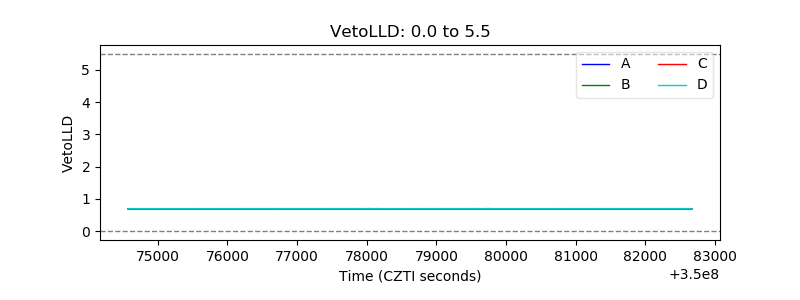 |
| Alpha Counter | 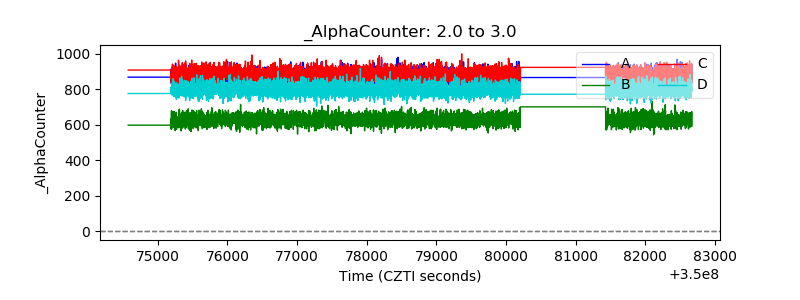 |
| _CPM_Rate | 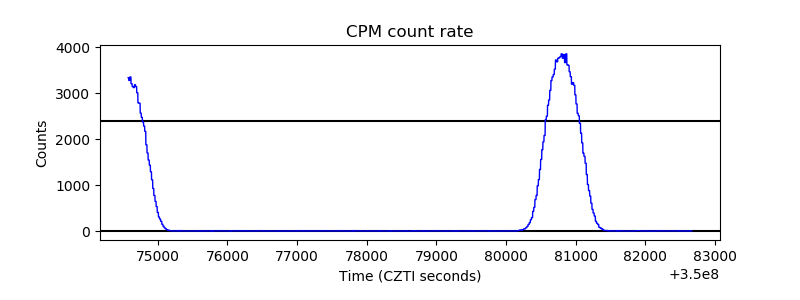 |
| CZT Counter | 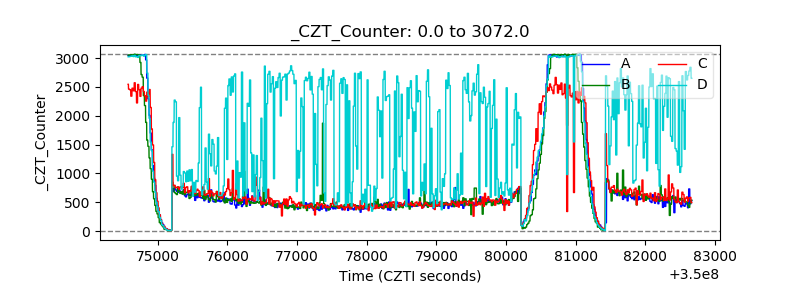 |
| +2.5 Volts monitor |  |
| +5 Volts monitor | 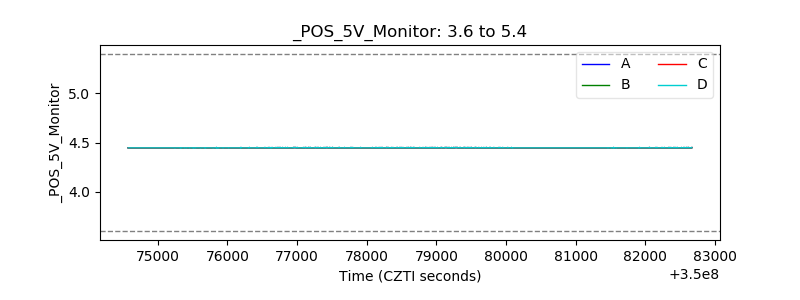 |
| _ROLL_ROT | 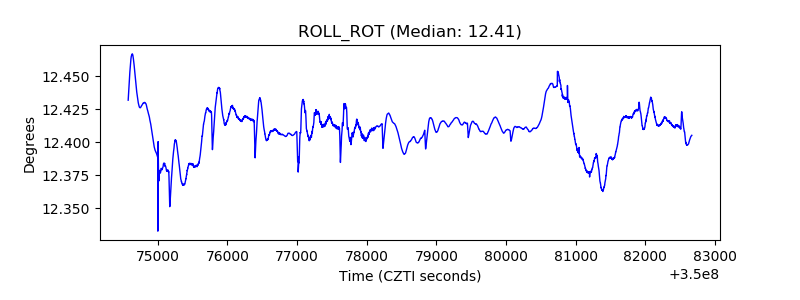 |
| _Roll_DEC | 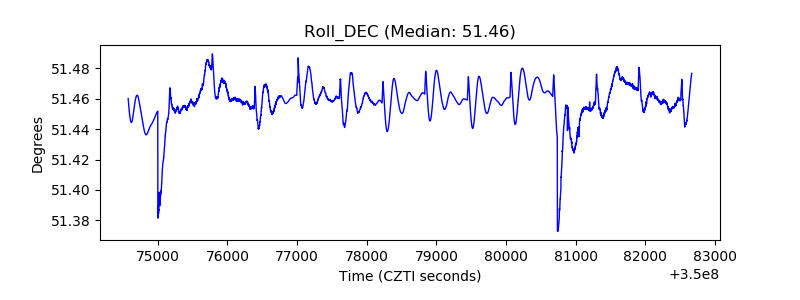 |
| _Roll_RA |  |
| Veto Counter | 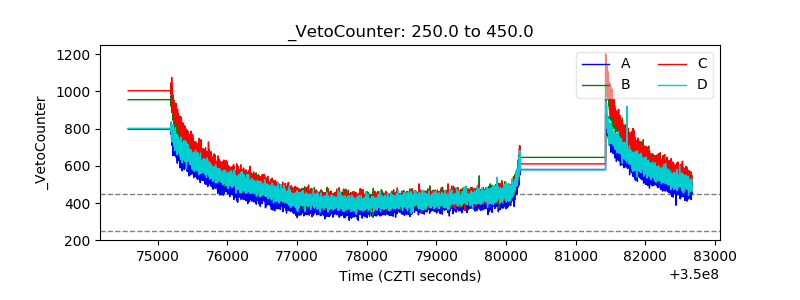 |