| Param | Original file | Final file |
|---|---|---|
| Filename | modeM0/AS1A10_123T08_9000004152_28950cztM0_level2.evt | modeM0/AS1A10_123T08_9000004152_28950cztM0_level2_quad_clean.evt |
| Size (bytes) | 602,173,440 | 107,092,800 |
| Size | 574.3 MB | 102.1 MB |
| Events in quadrant A | 3,050,458 | 734,247 |
| Events in quadrant B | 3,187,363 | 771,327 |
| Events in quadrant C | 3,227,937 | 736,879 |
| Events in quadrant D | 8,351,508 | 568,016 |
| Mode SS | |||
|---|---|---|---|
| Quadrant | BADHDUFLAG | Total packets | Discarded packets |
| A | 0 | 126 | 0 |
| B | 0 | 126 | 0 |
| C | 0 | 126 | 0 |
| D | 0 | 126 | 0 |
| Mode M0 | |||
|---|---|---|---|
| Quadrant | BADHDUFLAG | Total packets | Discarded packets |
| A | 0 | 13006 | 2 |
| B | 0 | 13309 | 2 |
| C | 0 | 13441 | 2 |
| D | 0 | 29095 | 2 |
| Mode M9 | |||
|---|---|---|---|
| Quadrant | BADHDUFLAG | Total packets | Discarded packets |
| A | 0 | 15 | 0 |
| B | 0 | 16 | 0 |
| C | 0 | 16 | 0 |
| D | 0 | 16 | 0 |
| Quadrant | Total seconds | Saturated seconds | Saturation percentage |
|---|---|---|---|
| A | 6192 | 14 | 0.226098% |
| B | 6192 | 36 | 0.581395% |
| C | 6192 | 99 | 1.598837% |
| D | 6192 | 1888 | 30.490956% |
Noise dominated data is calculated using 1-second bins in cleaned event files. If a bin has >2000 counts, and if more than 50% of those come from <1% of pixels, then it is considered to be noise-dominated and hence unusable.
| Quadrant | # 1 sec bins | Bins with >0 counts | Bins with >2000 counts | High rate bins dominated by noise | Noise dominated (total time) | Noise dominated (detector-on time) | Marked lightcurve |
|---|---|---|---|---|---|---|---|
| A | 7542 | 6191 | 0 | 0 | 0.00% | 0.00% | 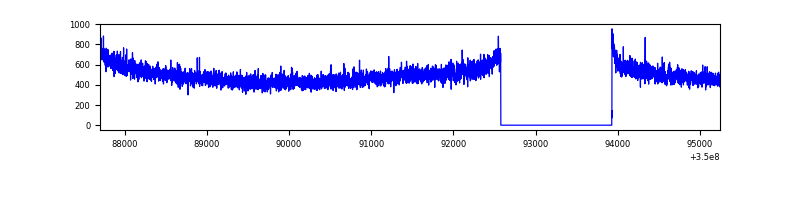 |
| B | 7542 | 6191 | 7 | 7 | 0.09% | 0.11% | 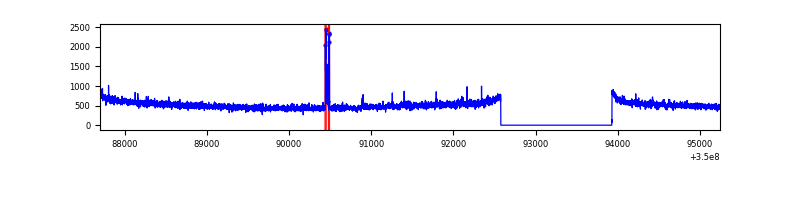 |
| C | 7542 | 6191 | 0 | 0 | 0.00% | 0.00% | 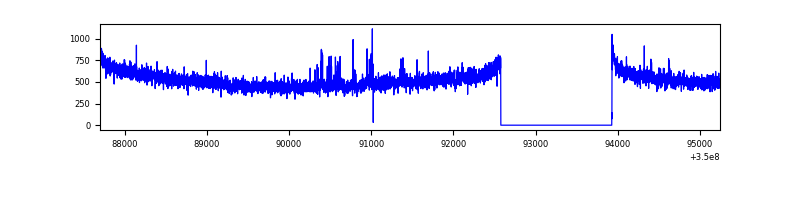 |
| D | 7542 | 6191 | 1816 | 1816 | 24.08% | 29.33% | 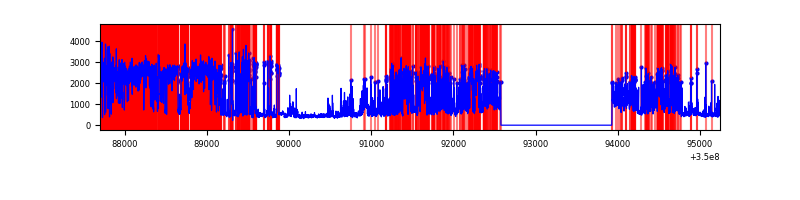 |
Top three noisy pixels from each quadrant. If the there are fewer than three noisy pixels in the level2.evt file, extra rows are filled as -1
| Pixel properties | Quadrant properties | ||||||
|---|---|---|---|---|---|---|---|
| Quadrant | DetID | PixID | Counts | Sigma | Mean | Median | Sigma |
| A | 13 | 254 | 10991 | 64.97 | 790 | 775 | 157.2 |
| A | 3 | 137 | 7216 | 40.96 | 790 | 775 | 157.2 |
| A | 0 | 226 | 6554 | 36.75 | 790 | 775 | 157.2 |
| B | 10 | 245 | 40179 | 267.71 | 802 | 783 | 147.2 |
| B | 12 | 111 | 17508 | 113.65 | 802 | 783 | 147.2 |
| B | 11 | 111 | 16012 | 103.49 | 802 | 783 | 147.2 |
| C | 14 | 238 | 144061 | 801.6 | 775 | 782 | 178.7 |
| C | 3 | 233 | 26224 | 142.34 | 775 | 782 | 178.7 |
| C | 14 | 254 | 25436 | 137.93 | 775 | 782 | 178.7 |
| D | 1 | 52 | 2703727 | 17530.09 | 655 | 639 | 154.2 |
| D | 8 | 195 | 1820423 | 11801.68 | 655 | 639 | 154.2 |
| D | 7 | 80 | 635824 | 4119.31 | 655 | 639 | 154.2 |
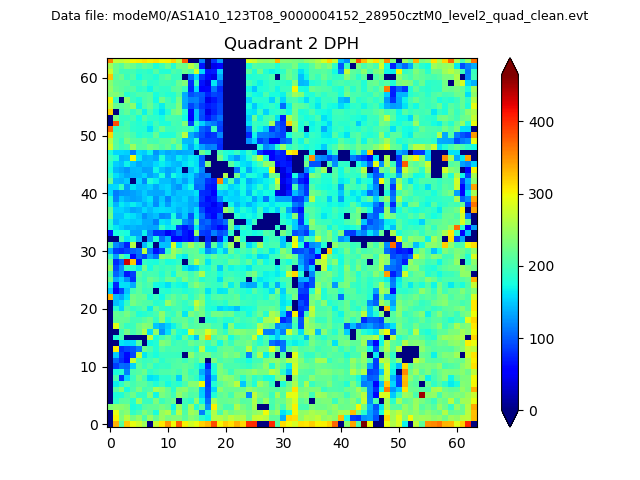
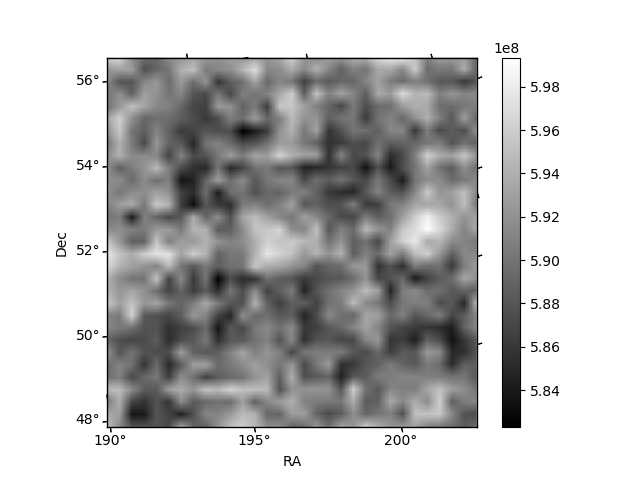
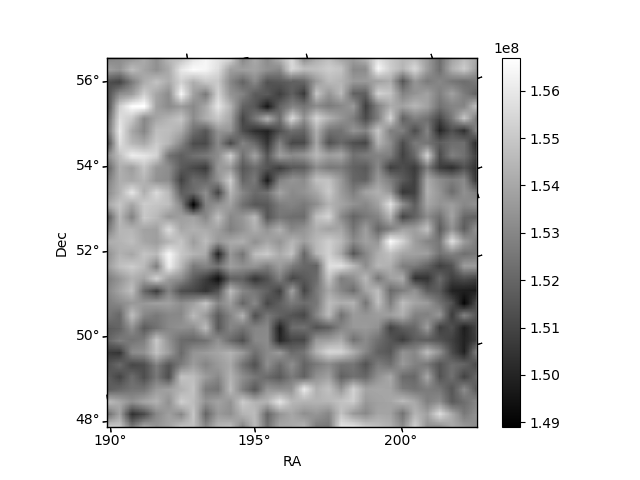
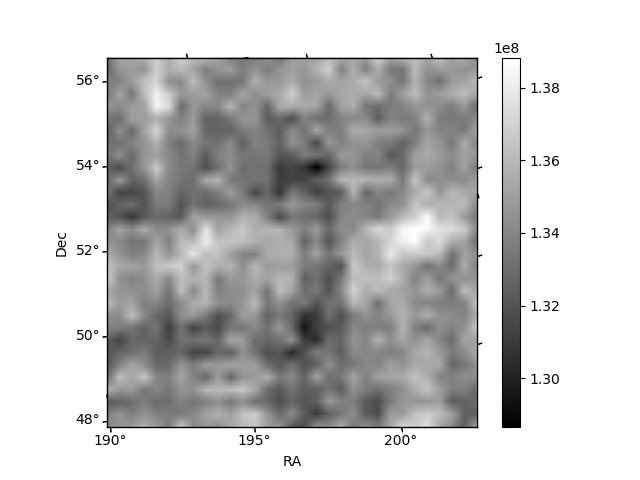
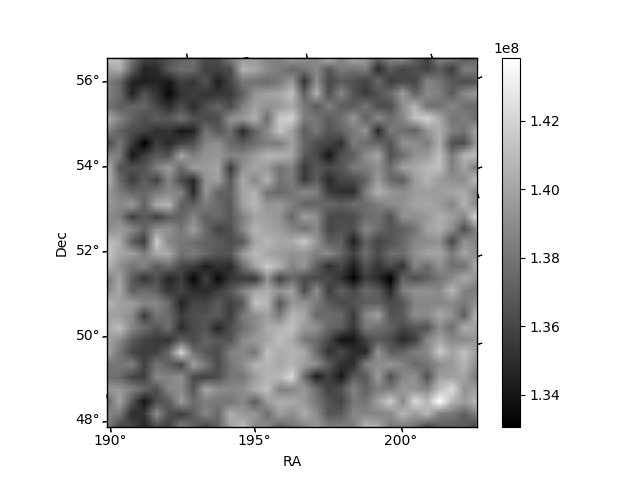
Histogram calculated using DETX and DETY for each event in the final _common_clean file
| Quadrant A | 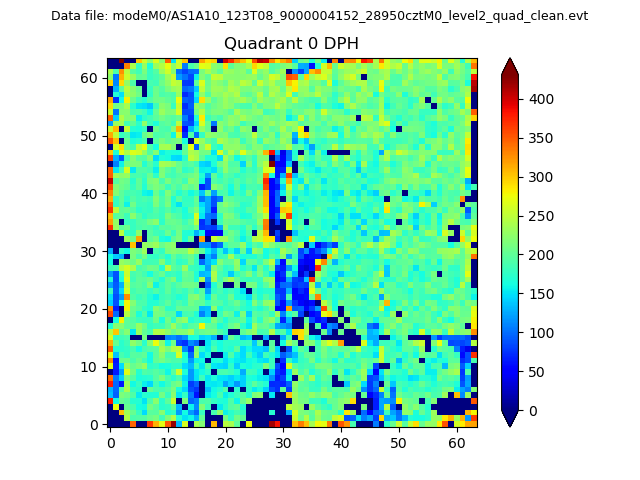 |
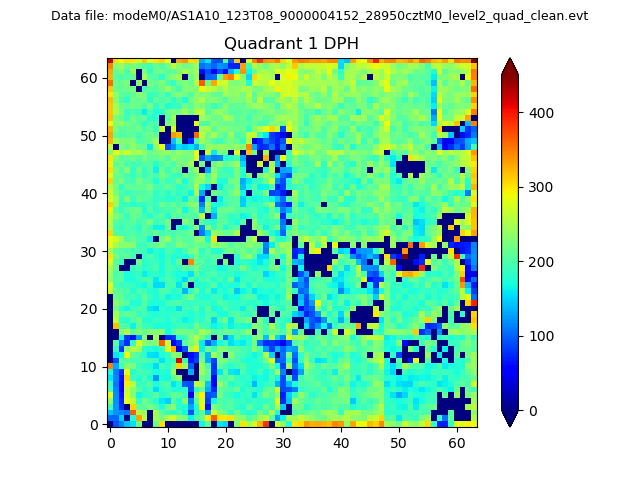 |
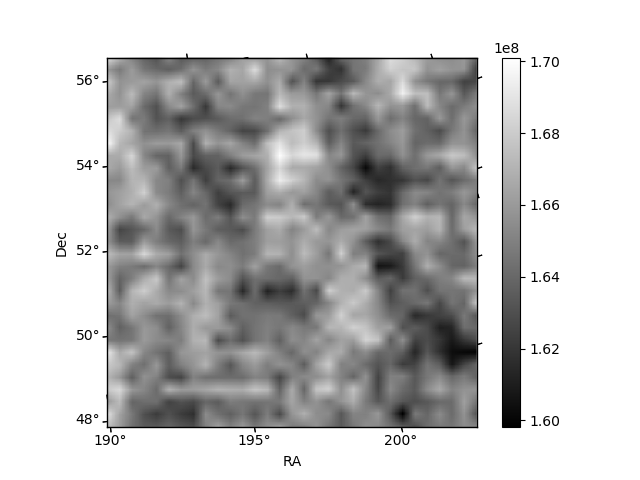
Quadrant B |
|---|---|---|---|
| Quadrant D | 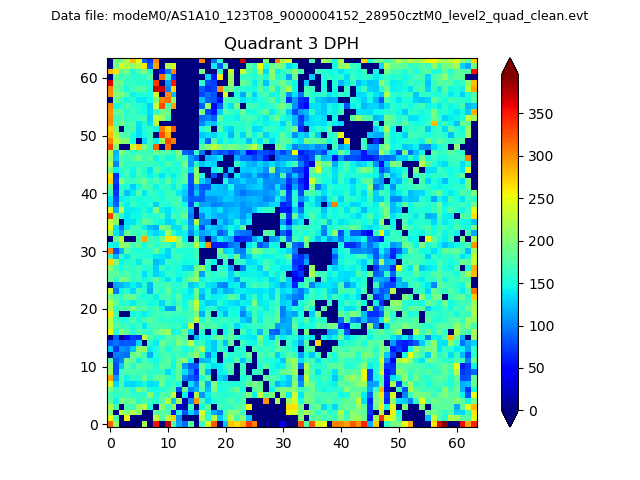 |
 |
Quadrant C |
| Plot type | Count rate plots | Images |
|---|---|---|
| Comparison with Poisson distribution Blue bars denote a histogram of data divided into 1 sec bins. Red curve is a Poisson curve with rate = median count rate of data. |
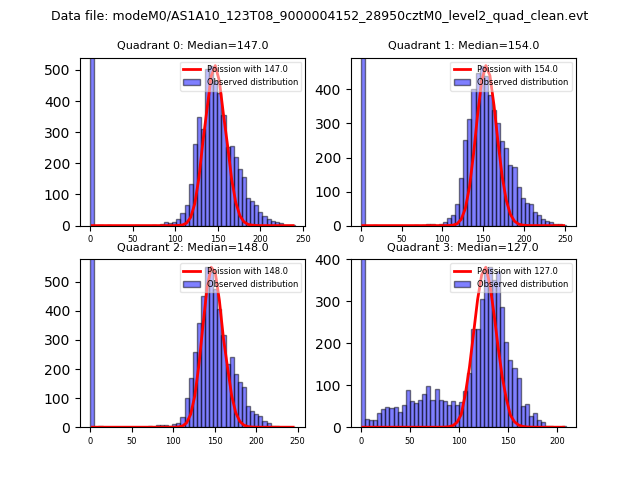 |
 |
| Quadrant-wise count rates Data is divided into 100 sec bins |
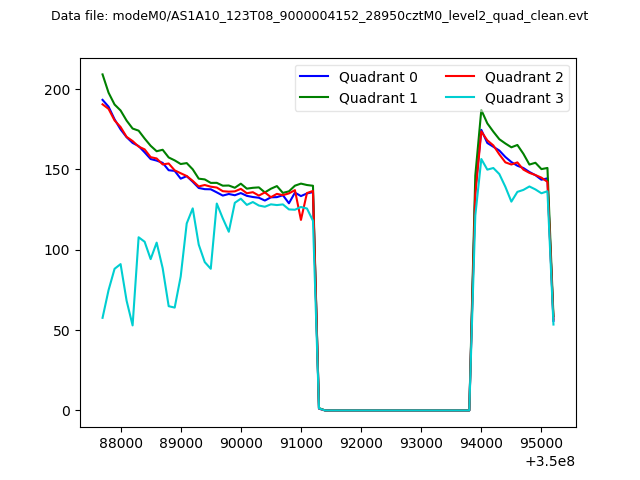 |
|
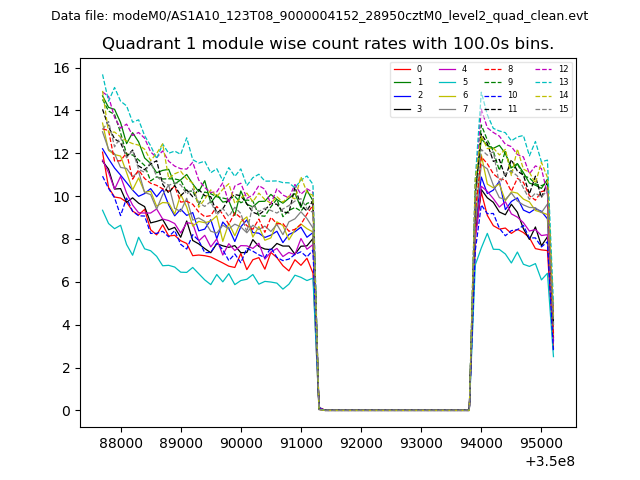
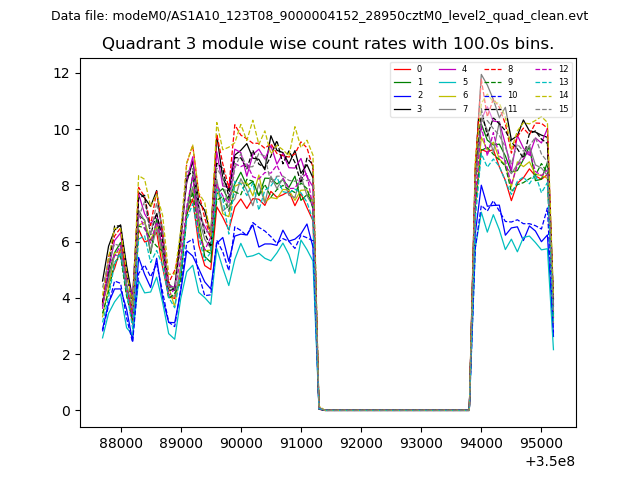
| Module-wise count rates for Quadrant A Data is divided into 100 sec bins |
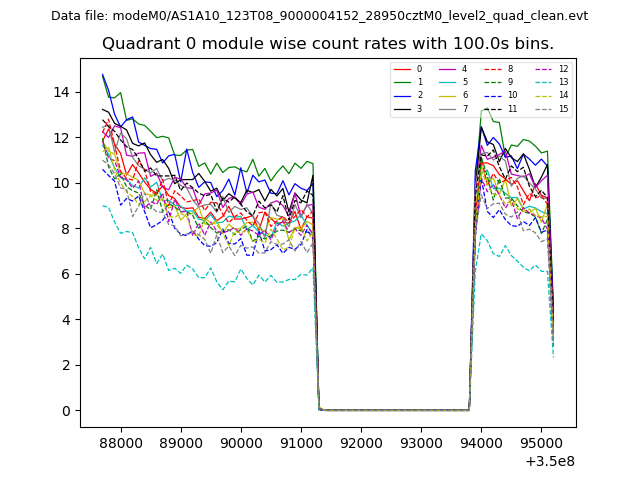 |
 |
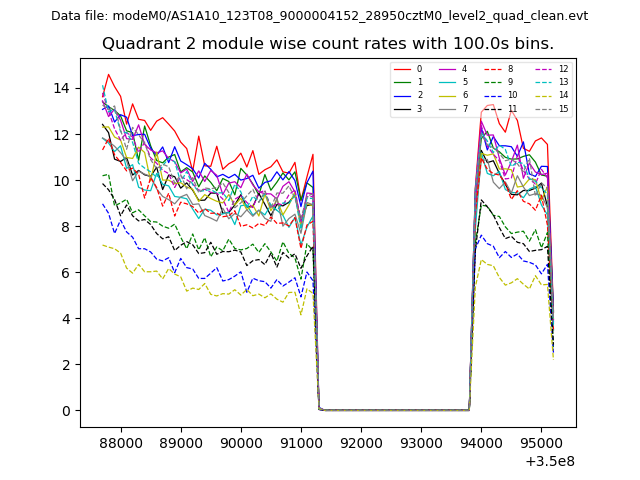
| Module-wise count rates for Quadrant B Data is divided into 100 sec bins |
 |
 |
| Module-wise count rates for Quadrant C Data is divided into 100 sec bins |
 |
 |
| Module-wise count rates for Quadrant D Data is divided into 100 sec bins |
 |
 |
| Parameter | Plot |
|---|---|
| CZT HV Monitor | 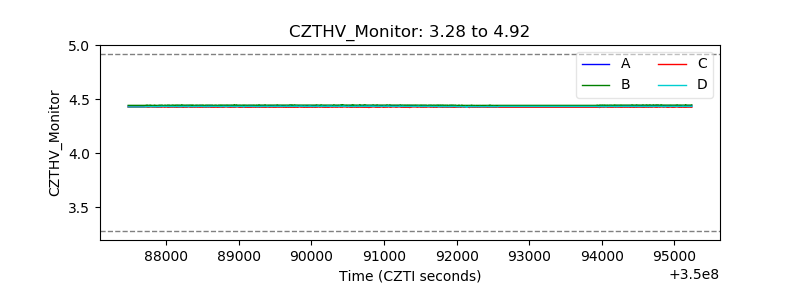 |
| D_VDD |  |
| Temperature 1 | 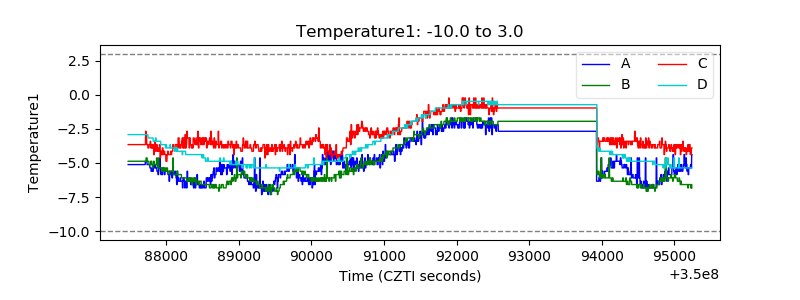 |
| Veto HV Monitor |  |
| Veto LLD | 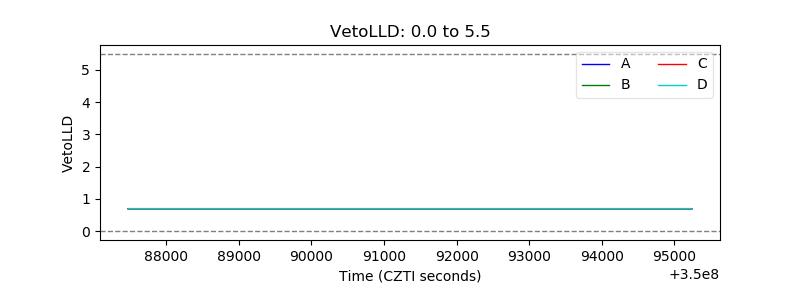 |
| Alpha Counter | 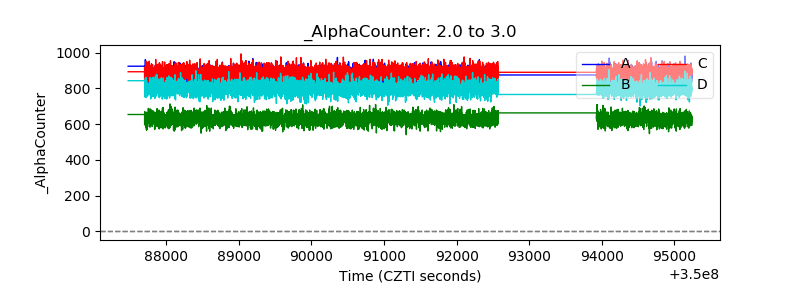 |
| _CPM_Rate | 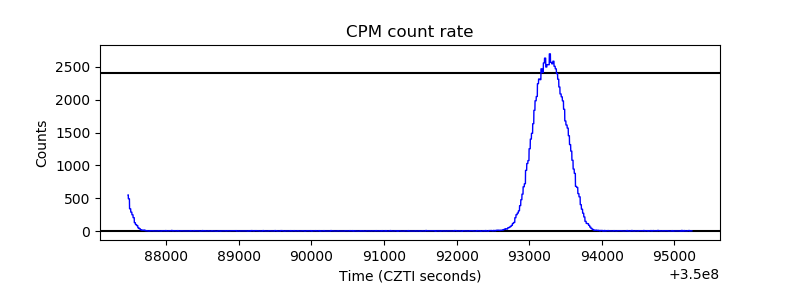 |
| CZT Counter | 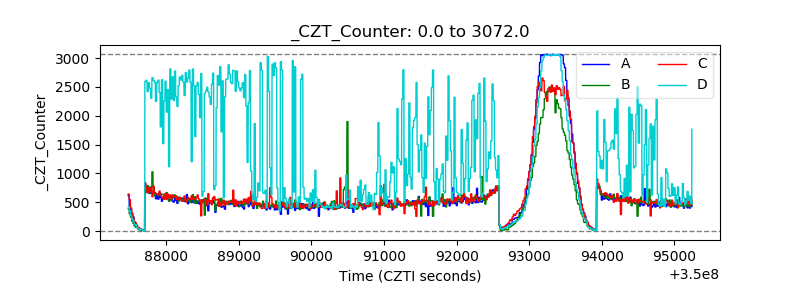 |
| +2.5 Volts monitor | 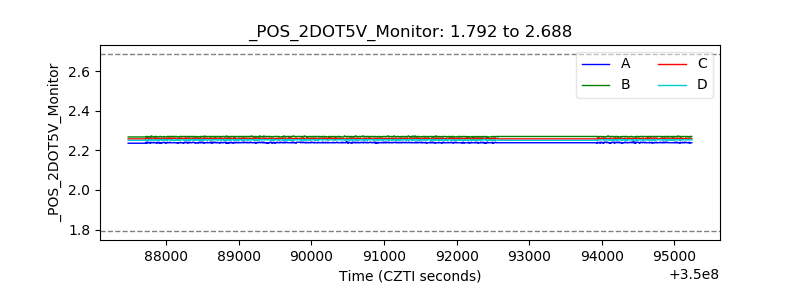 |
| +5 Volts monitor |  |
| _ROLL_ROT | 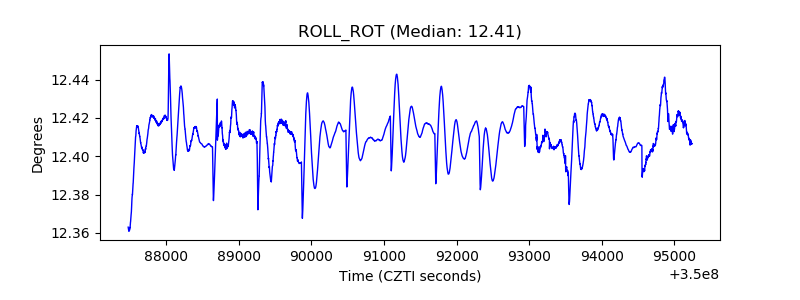 |
| _Roll_DEC | 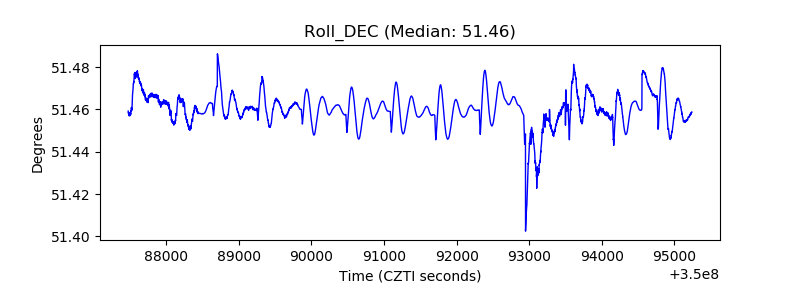 |
| _Roll_RA |  |
| Veto Counter | 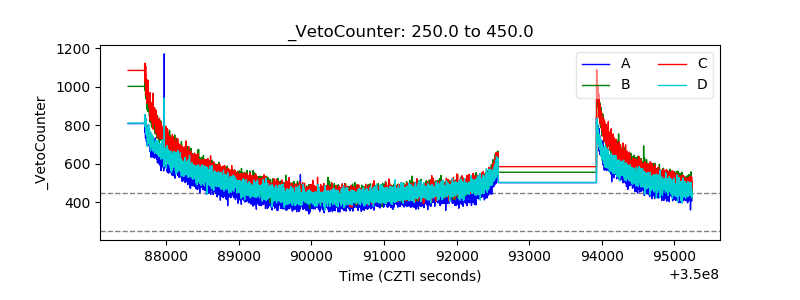 |