| Param | Original file | Final file |
|---|---|---|
| Filename | modeM0/AS1A10_123T08_9000004152_28951cztM0_level2.evt | modeM0/AS1A10_123T08_9000004152_28951cztM0_level2_quad_clean.evt |
| Size (bytes) | 519,264,000 | 99,383,040 |
| Size | 495.2 MB | 94.8 MB |
| Events in quadrant A | 3,047,566 | 648,930 |
| Events in quadrant B | 3,149,322 | 676,935 |
| Events in quadrant C | 3,273,468 | 646,021 |
| Events in quadrant D | 5,826,528 | 596,343 |
| Mode SS | |||
|---|---|---|---|
| Quadrant | BADHDUFLAG | Total packets | Discarded packets |
| A | 0 | 128 | 0 |
| B | 0 | 128 | 0 |
| C | 0 | 128 | 0 |
| D | 0 | 128 | 0 |
| Mode M0 | |||
|---|---|---|---|
| Quadrant | BADHDUFLAG | Total packets | Discarded packets |
| A | 0 | 13124 | 2 |
| B | 0 | 13282 | 2 |
| C | 0 | 13588 | 2 |
| D | 0 | 21733 | 2 |
| Mode M9 | |||
|---|---|---|---|
| Quadrant | BADHDUFLAG | Total packets | Discarded packets |
| A | 0 | 15 | 0 |
| B | 0 | 16 | 0 |
| C | 0 | 16 | 0 |
| D | 0 | 16 | 0 |
| Quadrant | Total seconds | Saturated seconds | Saturation percentage |
|---|---|---|---|
| A | 6328 | 18 | 0.284450% |
| B | 6328 | 52 | 0.821745% |
| C | 6328 | 112 | 1.769912% |
| D | 6328 | 494 | 7.806574% |
Noise dominated data is calculated using 1-second bins in cleaned event files. If a bin has >2000 counts, and if more than 50% of those come from <1% of pixels, then it is considered to be noise-dominated and hence unusable.
| Quadrant | # 1 sec bins | Bins with >0 counts | Bins with >2000 counts | High rate bins dominated by noise | Noise dominated (total time) | Noise dominated (detector-on time) | Marked lightcurve |
|---|---|---|---|---|---|---|---|
| A | 7596 | 6326 | 0 | 0 | 0.00% | 0.00% | 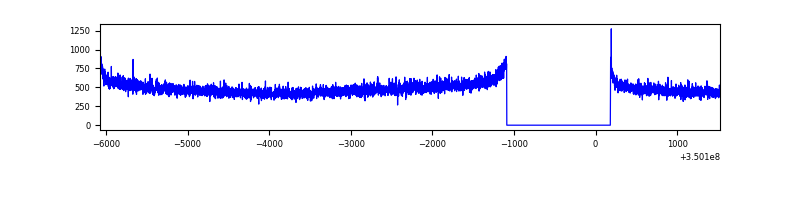 |
| B | 7596 | 6326 | 1 | 1 | 0.01% | 0.02% | 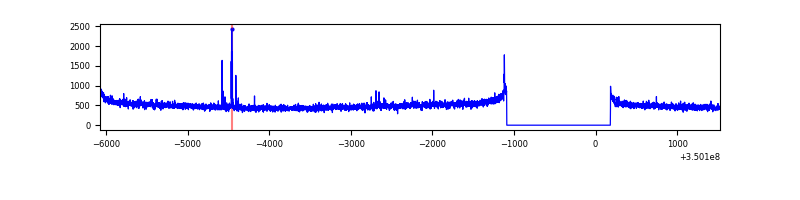 |
| C | 7596 | 6326 | 0 | 0 | 0.00% | 0.00% | 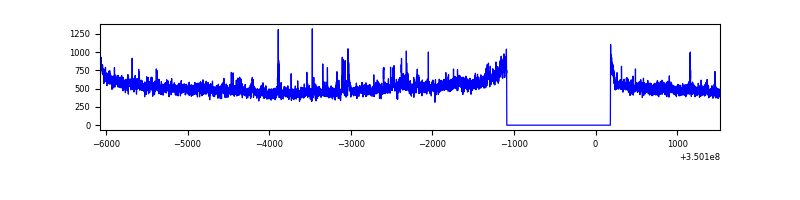 |
| D | 7596 | 6326 | 458 | 458 | 6.03% | 7.24% | 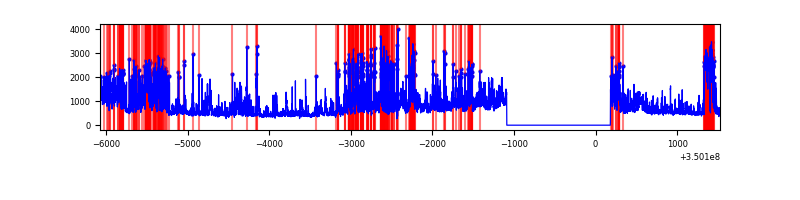 |
Top three noisy pixels from each quadrant. If the there are fewer than three noisy pixels in the level2.evt file, extra rows are filled as -1
| Pixel properties | Quadrant properties | ||||||
|---|---|---|---|---|---|---|---|
| Quadrant | DetID | PixID | Counts | Sigma | Mean | Median | Sigma |
| A | 13 | 254 | 10948 | 64.67 | 790 | 776 | 157.3 |
| A | 3 | 137 | 7463 | 42.52 | 790 | 776 | 157.3 |
| A | 0 | 226 | 6503 | 36.41 | 790 | 776 | 157.3 |
| B | 10 | 245 | 22284 | 144.77 | 795 | 775 | 148.6 |
| B | 12 | 111 | 17939 | 115.52 | 795 | 775 | 148.6 |
| B | 11 | 111 | 16297 | 104.47 | 795 | 775 | 148.6 |
| C | 14 | 238 | 136747 | 771.23 | 764 | 769 | 176.3 |
| C | 3 | 233 | 120083 | 676.72 | 764 | 769 | 176.3 |
| C | 14 | 254 | 20380 | 111.23 | 764 | 769 | 176.3 |
| D | 8 | 195 | 1034161 | 5862.87 | 739 | 719 | 176.3 |
| D | 1 | 52 | 899607 | 5099.52 | 739 | 719 | 176.3 |
| D | 12 | 79 | 866513 | 4911.78 | 739 | 719 | 176.3 |
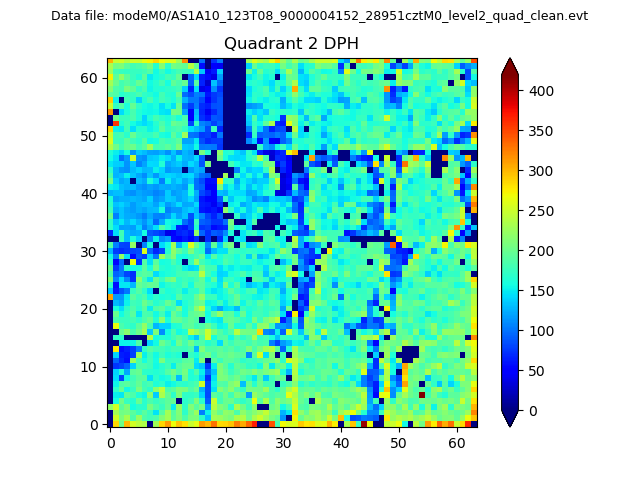
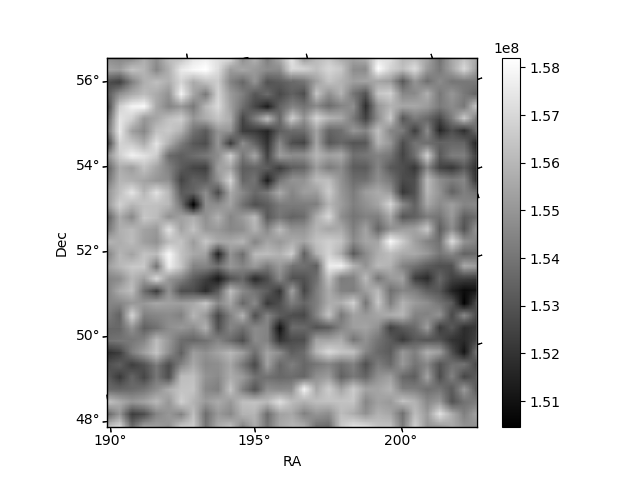
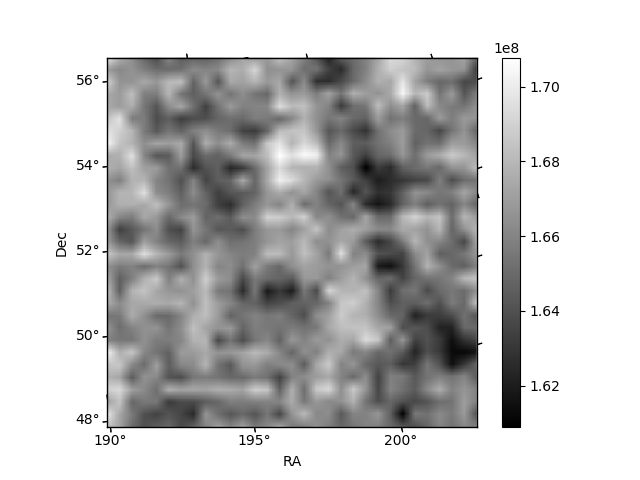
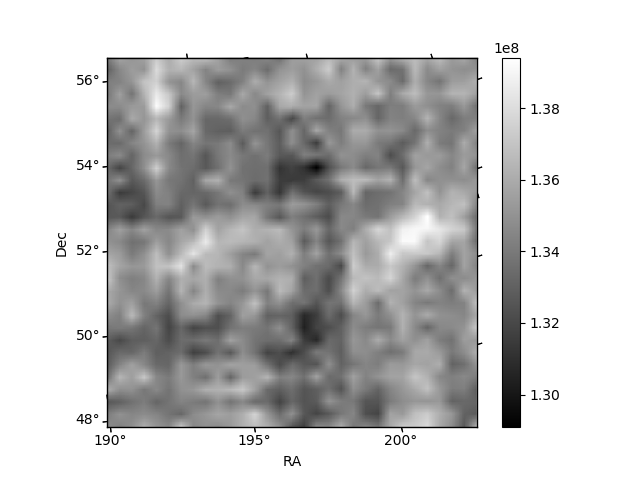
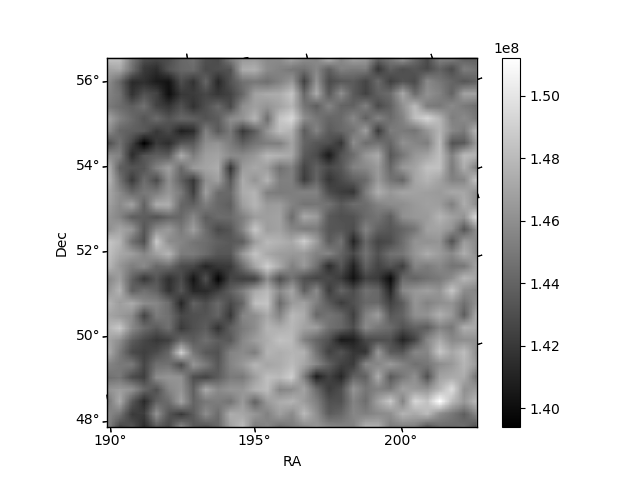
Histogram calculated using DETX and DETY for each event in the final _common_clean file
| Quadrant A | 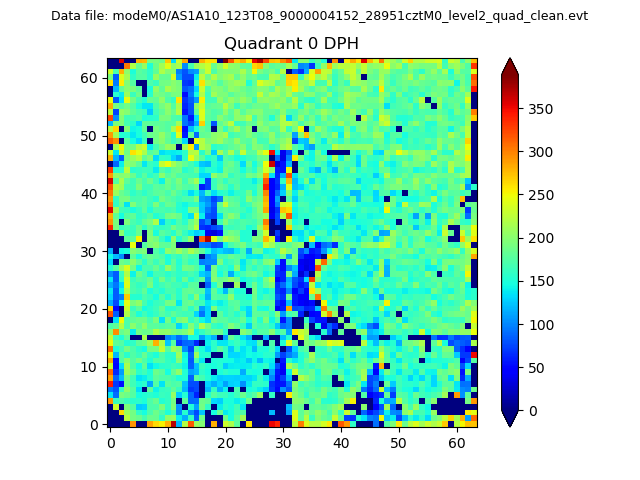 |
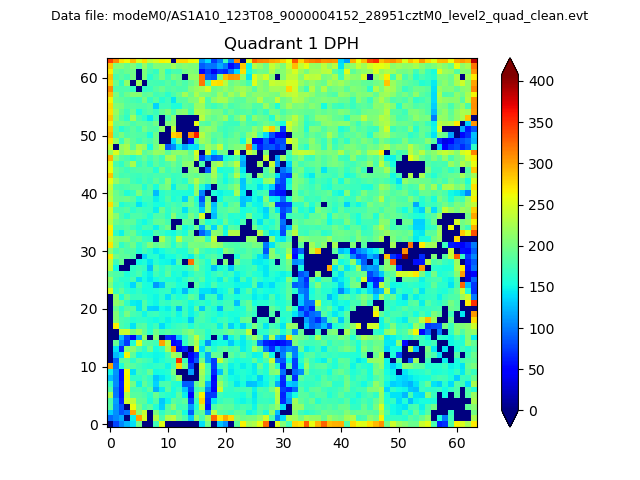 |
Quadrant B |
|---|---|---|---|
| Quadrant D | 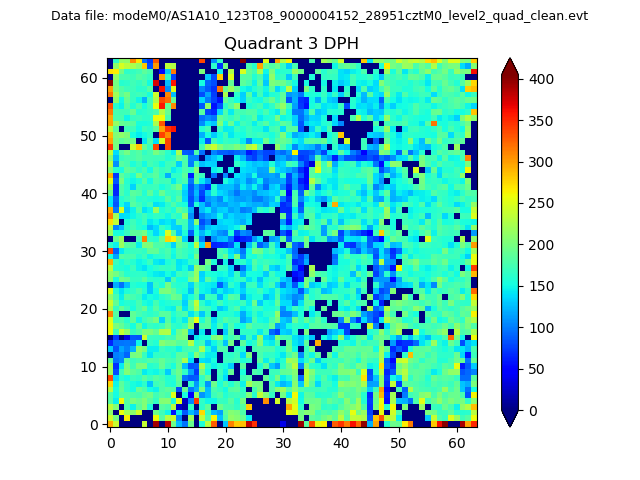 |
 |
Quadrant C |
| Plot type | Count rate plots | Images |
|---|---|---|
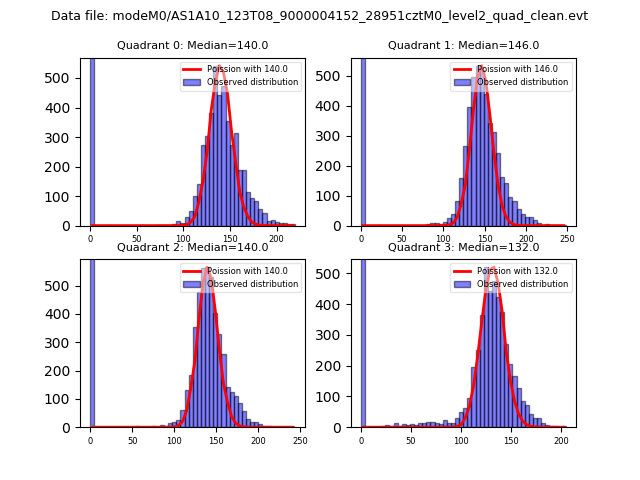
| Comparison with Poisson distribution Blue bars denote a histogram of data divided into 1 sec bins. Red curve is a Poisson curve with rate = median count rate of data. |
 |
 |
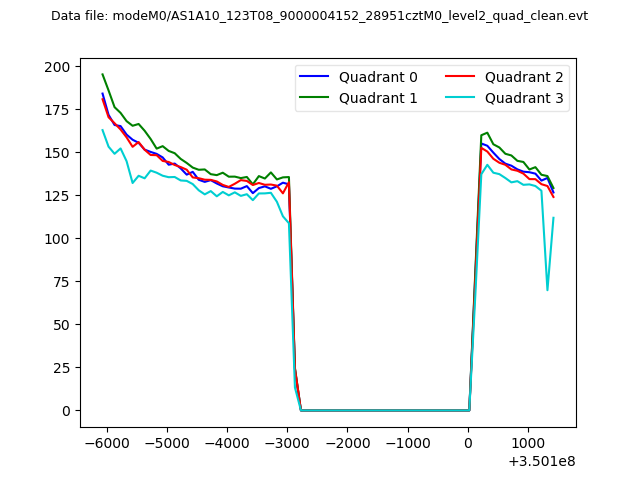
| Quadrant-wise count rates Data is divided into 100 sec bins |
 |
|
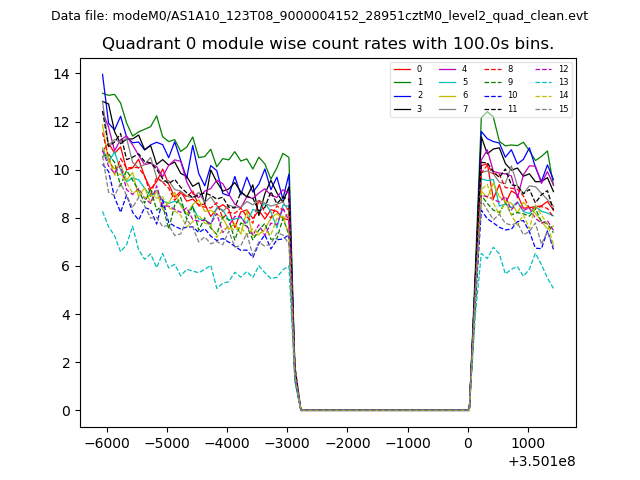
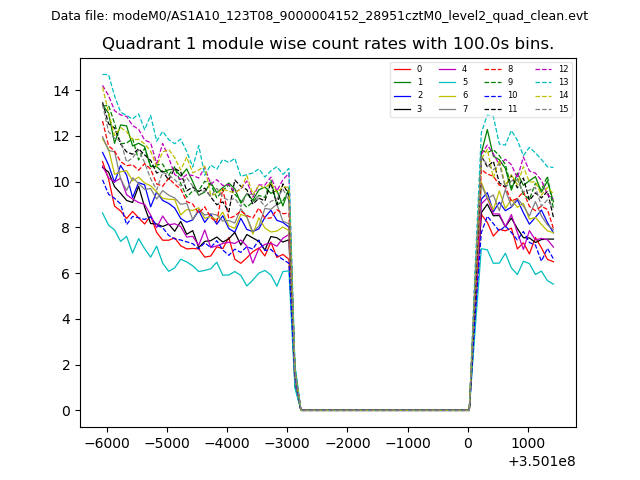
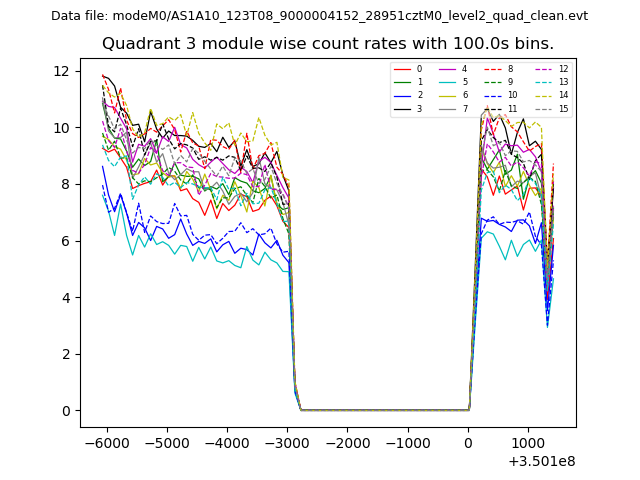
| Module-wise count rates for Quadrant A Data is divided into 100 sec bins |
 |
 |
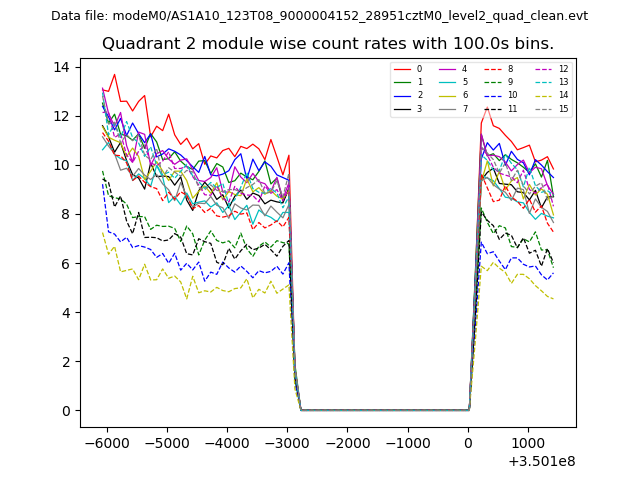
| Module-wise count rates for Quadrant B Data is divided into 100 sec bins |
 |
 |
| Module-wise count rates for Quadrant C Data is divided into 100 sec bins |
 |
 |
| Module-wise count rates for Quadrant D Data is divided into 100 sec bins |
 |
 |
| Parameter | Plot |
|---|---|
| CZT HV Monitor | 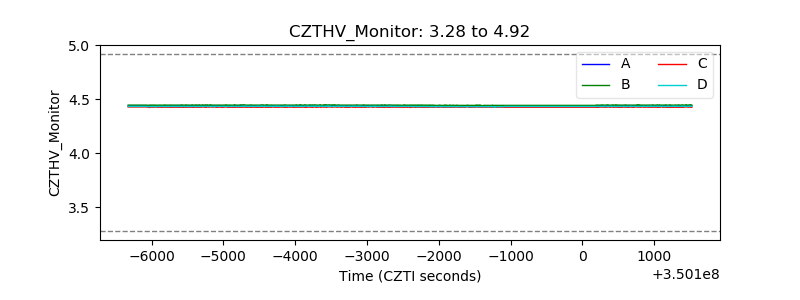 |
| D_VDD |  |
| Temperature 1 | 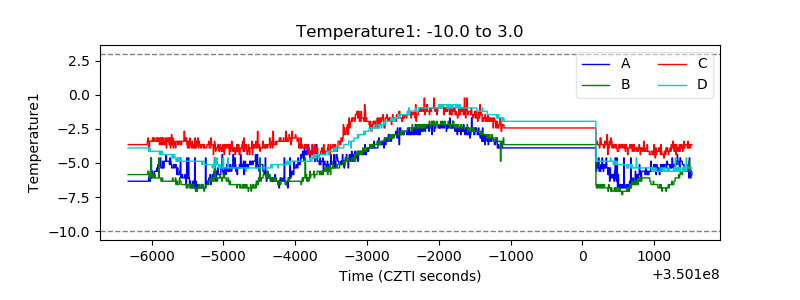 |
| Veto HV Monitor |  |
| Veto LLD | 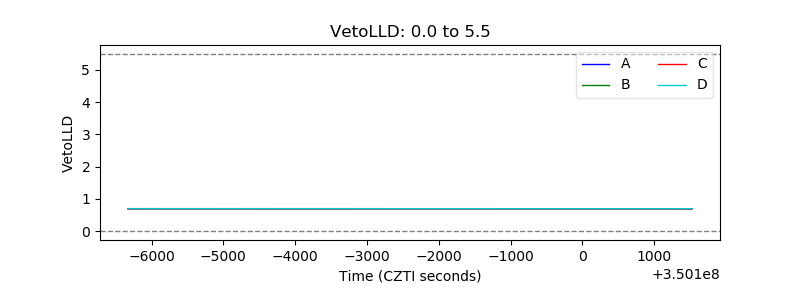 |
| Alpha Counter | 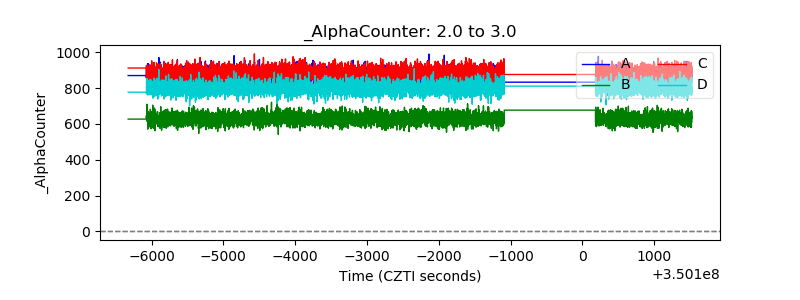 |
| _CPM_Rate | 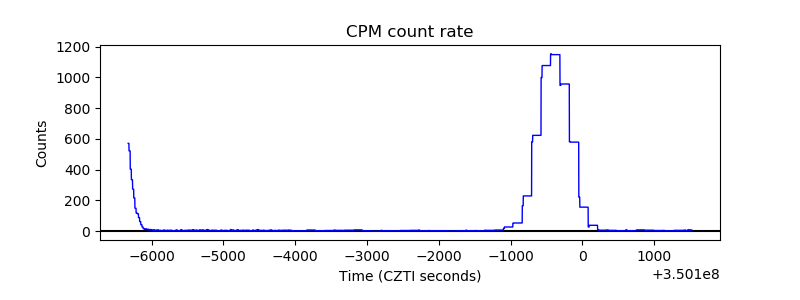 |
| CZT Counter | 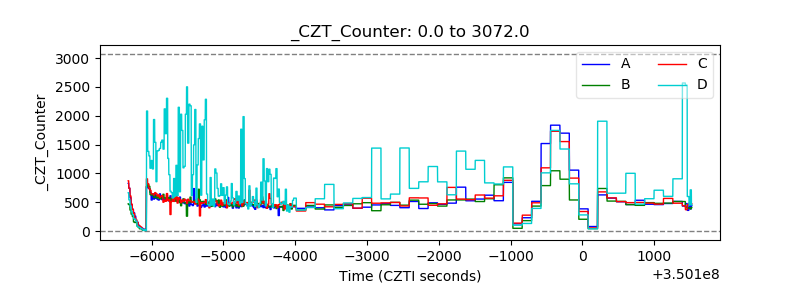 |
| +2.5 Volts monitor |  |
| +5 Volts monitor |  |
| _ROLL_ROT | 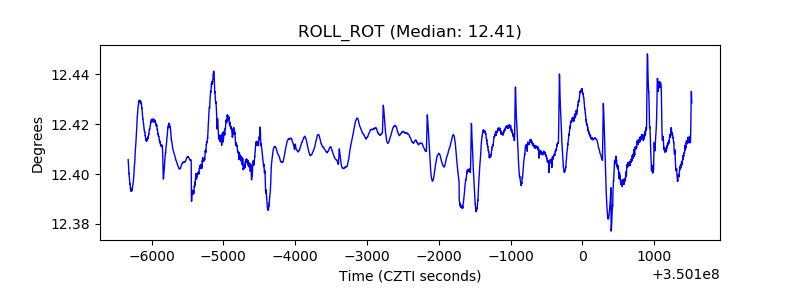 |
| _Roll_DEC | 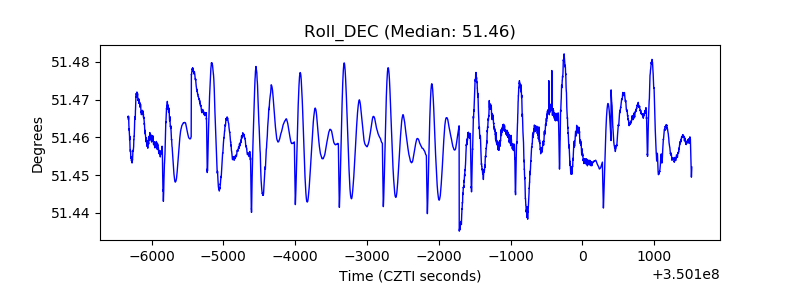 |
| _Roll_RA | 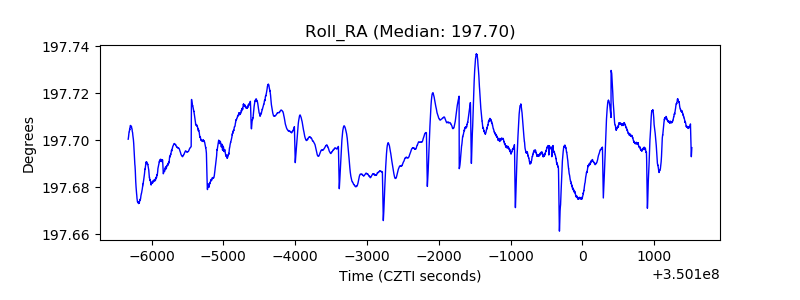 |
| Veto Counter | 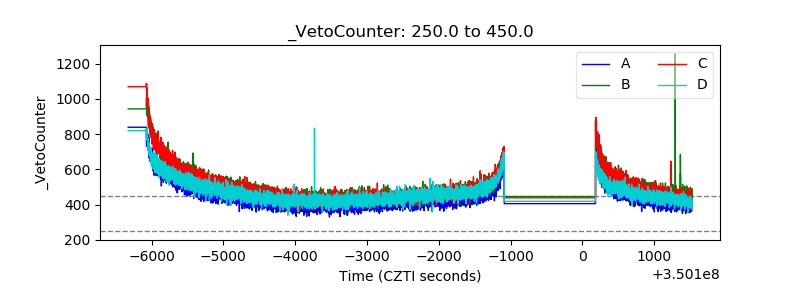 |