| Param | Original file | Final file |
|---|---|---|
| Filename | modeM0/AS1A10_123T08_9000004152_28954cztM0_level2.evt | modeM0/AS1A10_123T08_9000004152_28954cztM0_level2_quad_clean.evt |
| Size (bytes) | 1,455,687,360 | 250,312,320 |
| Size | 1.4 GB | 238.7 MB |
| Events in quadrant A | 8,727,474 | 1,589,476 |
| Events in quadrant B | 8,823,880 | 1,645,173 |
| Events in quadrant C | 9,615,365 | 1,578,269 |
| Events in quadrant D | 15,677,886 | 1,501,257 |
| Mode SS | |||
|---|---|---|---|
| Quadrant | BADHDUFLAG | Total packets | Discarded packets |
| A | 0 | 374 | 0 |
| B | 0 | 374 | 0 |
| C | 0 | 374 | 0 |
| D | 0 | 374 | 0 |
| Mode M0 | |||
|---|---|---|---|
| Quadrant | BADHDUFLAG | Total packets | Discarded packets |
| A | 0 | 38126 | 3 |
| B | 0 | 38188 | 3 |
| C | 0 | 40593 | 3 |
| D | 0 | 59035 | 3 |
| Mode M9 | |||
|---|---|---|---|
| Quadrant | BADHDUFLAG | Total packets | Discarded packets |
| A | 0 | 18 | 0 |
| B | 0 | 18 | 0 |
| C | 0 | 18 | 0 |
| D | 0 | 18 | 0 |
| Quadrant | Total seconds | Saturated seconds | Saturation percentage |
|---|---|---|---|
| A | 18390 | 298 | 1.620446% |
| B | 18390 | 346 | 1.881457% |
| C | 18391 | 591 | 3.213528% |
| D | 18390 | 1317 | 7.161501% |
Noise dominated data is calculated using 1-second bins in cleaned event files. If a bin has >2000 counts, and if more than 50% of those come from <1% of pixels, then it is considered to be noise-dominated and hence unusable.
| Quadrant | # 1 sec bins | Bins with >0 counts | Bins with >2000 counts | High rate bins dominated by noise | Noise dominated (total time) | Noise dominated (detector-on time) | Marked lightcurve |
|---|---|---|---|---|---|---|---|
| A | 20130 | 18394 | 13 | 13 | 0.06% | 0.07% | 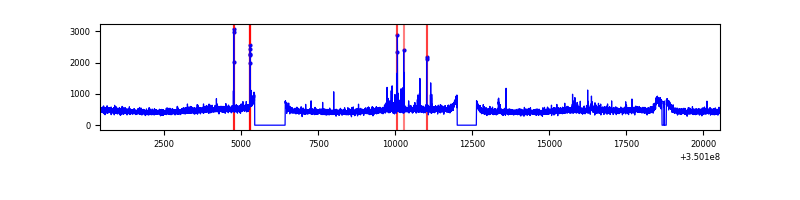 |
| B | 20130 | 18394 | 3 | 3 | 0.01% | 0.02% | 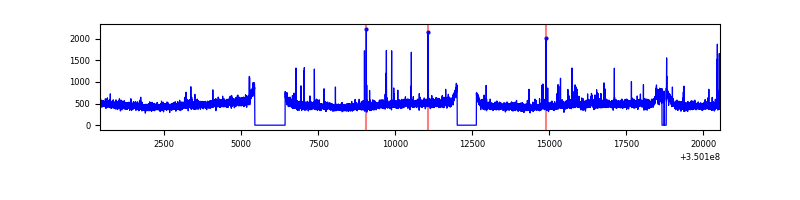 |
| C | 20131 | 18395 | 5 | 5 | 0.02% | 0.03% | 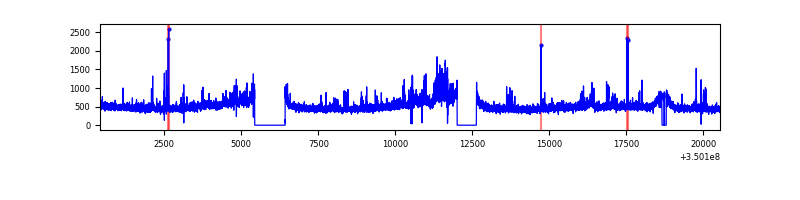 |
| D | 20130 | 18394 | 988 | 988 | 4.91% | 5.37% | 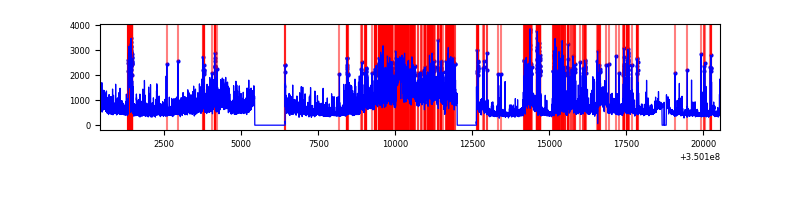 |
Top three noisy pixels from each quadrant. If the there are fewer than three noisy pixels in the level2.evt file, extra rows are filled as -1
| Pixel properties | Quadrant properties | ||||||
|---|---|---|---|---|---|---|---|
| Quadrant | DetID | PixID | Counts | Sigma | Mean | Median | Sigma |
| A | 12 | 96 | 94973 | 209.49 | 2215 | 2167 | 443.0 |
| A | 13 | 254 | 32193 | 67.78 | 2215 | 2167 | 443.0 |
| A | 15 | 192 | 29152 | 60.91 | 2215 | 2167 | 443.0 |
| B | 10 | 245 | 54339 | 123.97 | 2208 | 2153 | 420.9 |
| B | 12 | 111 | 52946 | 120.67 | 2208 | 2153 | 420.9 |
| B | 11 | 111 | 47838 | 108.53 | 2208 | 2153 | 420.9 |
| C | 3 | 233 | 764022 | 1570.79 | 2112 | 2123 | 485.0 |
| C | 14 | 238 | 414269 | 849.71 | 2112 | 2123 | 485.0 |
| C | 14 | 254 | 108225 | 218.75 | 2112 | 2123 | 485.0 |
| D | 8 | 195 | 3609250 | 7273.57 | 2093 | 2035 | 495.9 |
| D | 1 | 52 | 2337245 | 4708.71 | 2093 | 2035 | 495.9 |
| D | 7 | 80 | 1205054 | 2425.76 | 2093 | 2035 | 495.9 |
Histogram calculated using DETX and DETY for each event in the final _common_clean file
| Quadrant A |  |
 |
Quadrant B |
|---|---|---|---|
| Quadrant D |  |
 |
Quadrant C |
| Plot type | Count rate plots | Images |
|---|---|---|
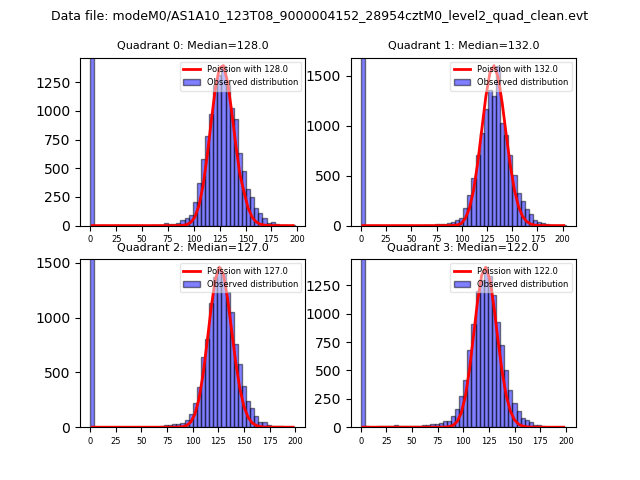
| Comparison with Poisson distribution Blue bars denote a histogram of data divided into 1 sec bins. Red curve is a Poisson curve with rate = median count rate of data. |
 |
 |
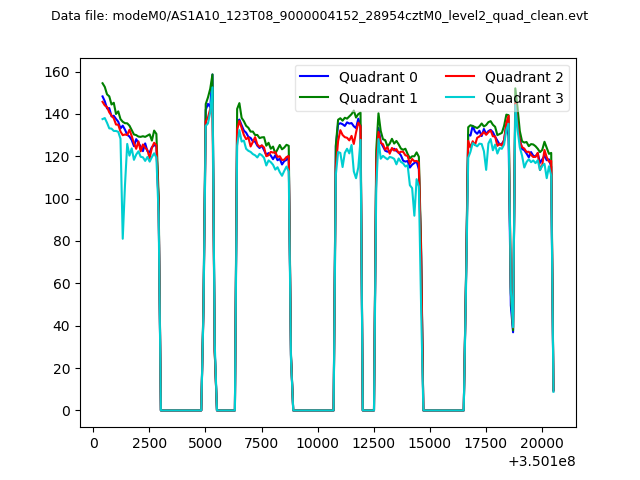
| Quadrant-wise count rates Data is divided into 100 sec bins |
 |
|
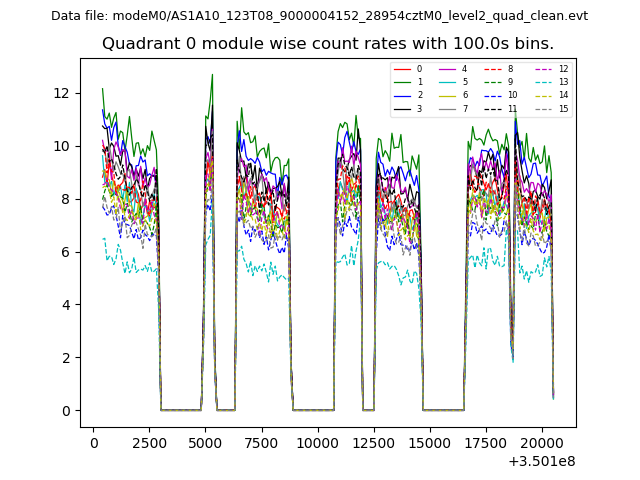
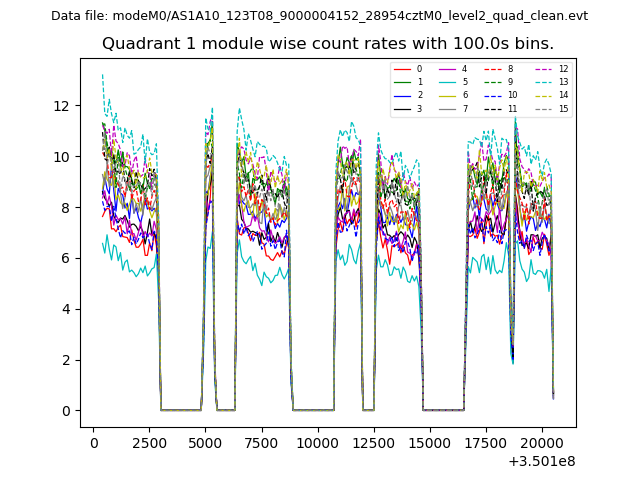
| Module-wise count rates for Quadrant A Data is divided into 100 sec bins |
 |
 |
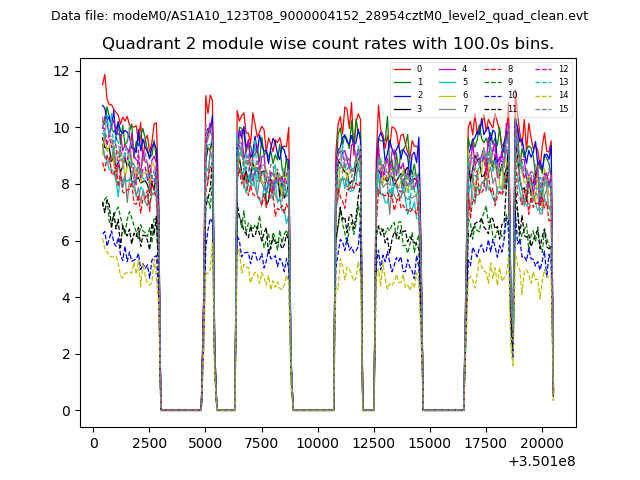
| Module-wise count rates for Quadrant B Data is divided into 100 sec bins |
 |
 |
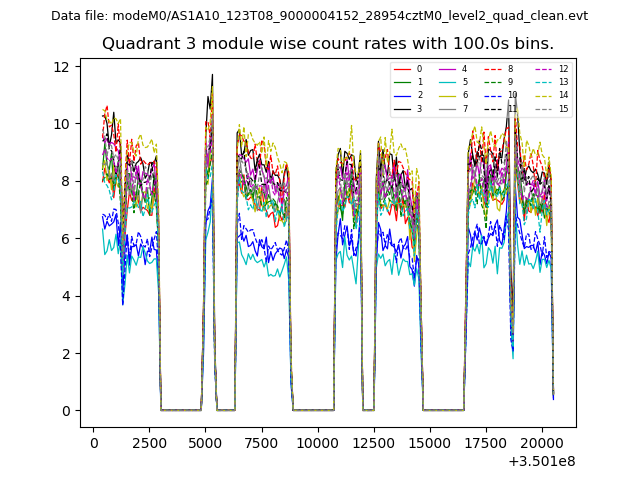
| Module-wise count rates for Quadrant C Data is divided into 100 sec bins |
 |
 |
| Module-wise count rates for Quadrant D Data is divided into 100 sec bins |
 |
 |
| Parameter | Plot |
|---|---|
| CZT HV Monitor | 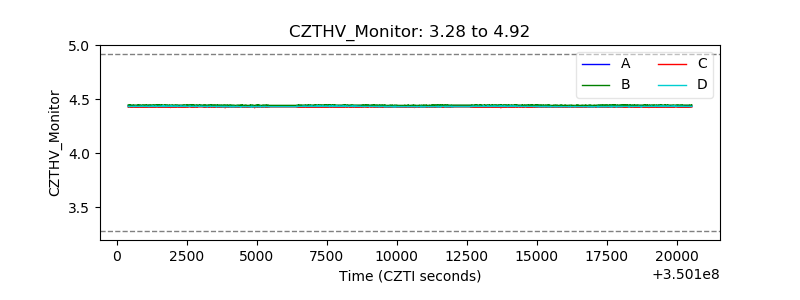 |
| D_VDD | 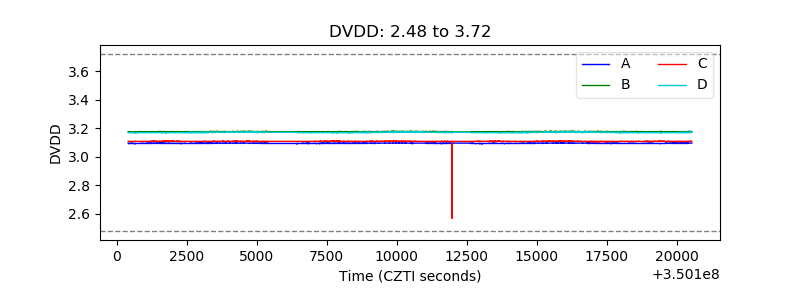 |
| Temperature 1 | 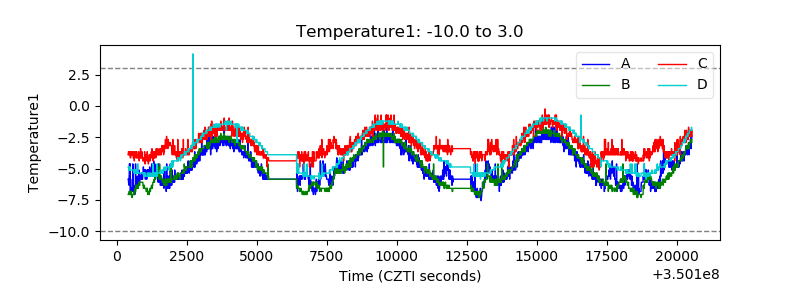 |
| Veto HV Monitor | 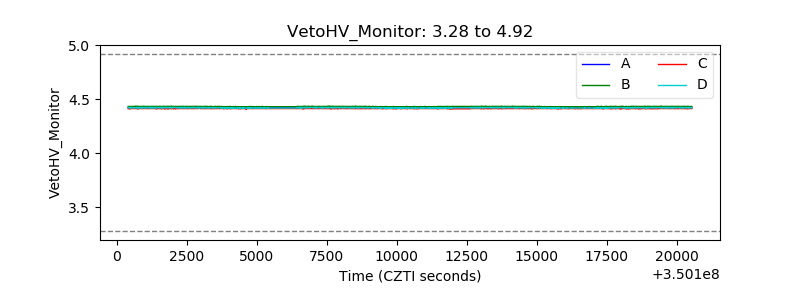 |
| Veto LLD | 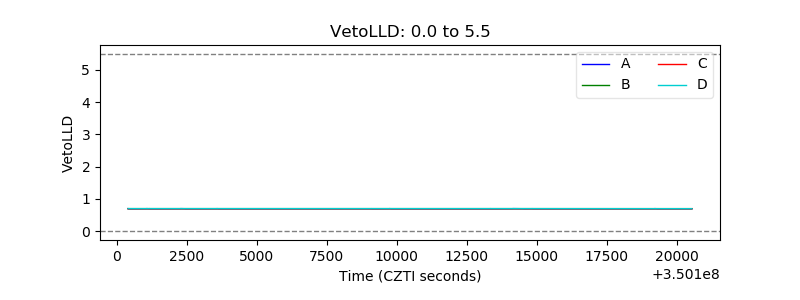 |
| Alpha Counter | 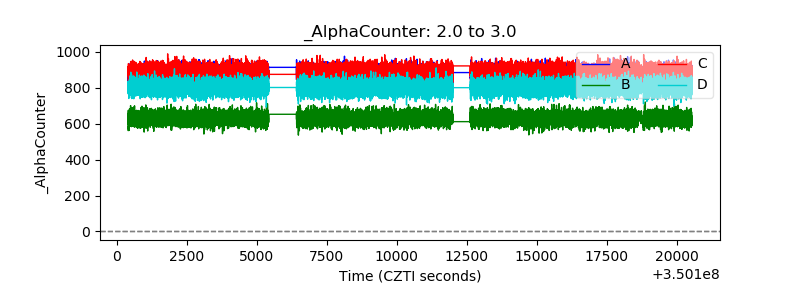 |
| _CPM_Rate | 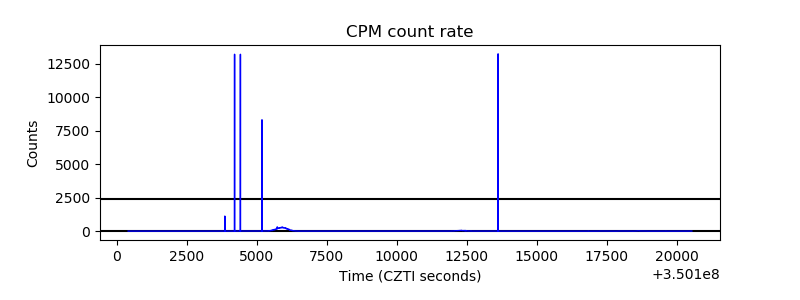 |
| CZT Counter |  |
| +2.5 Volts monitor |  |
| +5 Volts monitor |  |
| _ROLL_ROT | 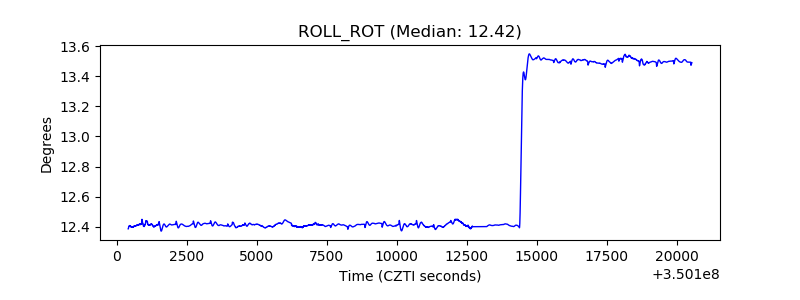 |
| _Roll_DEC | 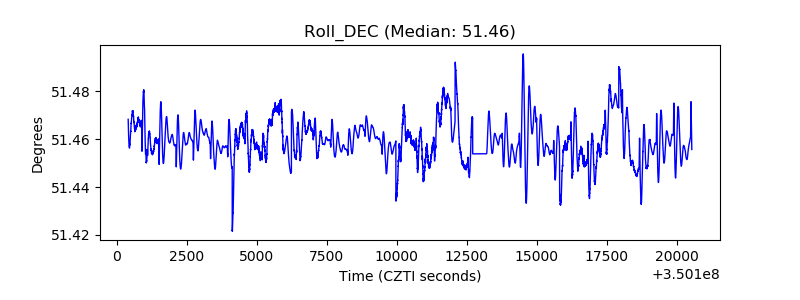 |
| _Roll_RA |  |
| Veto Counter | 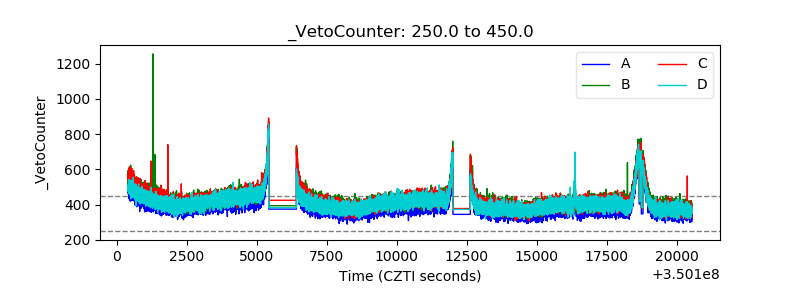 |