| Param | Original file | Final file |
|---|---|---|
| Filename | modeM0/AS1A10_123T08_9000004152_28955cztM0_level2.evt | modeM0/AS1A10_123T08_9000004152_28955cztM0_level2_quad_clean.evt |
| Size (bytes) | 486,731,520 | 94,351,680 |
| Size | 464.2 MB | 90.0 MB |
| Events in quadrant A | 3,243,821 | 594,936 |
| Events in quadrant B | 3,389,184 | 610,882 |
| Events in quadrant C | 3,337,484 | 586,702 |
| Events in quadrant D | 4,290,465 | 573,175 |
| Mode SS | |||
|---|---|---|---|
| Quadrant | BADHDUFLAG | Total packets | Discarded packets |
| A | 0 | 142 | 0 |
| B | 0 | 142 | 0 |
| C | 0 | 142 | 0 |
| D | 0 | 142 | 0 |
| Mode M0 | |||
|---|---|---|---|
| Quadrant | BADHDUFLAG | Total packets | Discarded packets |
| A | 0 | 14399 | 1 |
| B | 0 | 14700 | 1 |
| C | 0 | 14522 | 1 |
| D | 0 | 17446 | 1 |
| Mode M9 | |||
|---|---|---|---|
| Quadrant | BADHDUFLAG | Total packets | Discarded packets |
| A | 0 | 2 | 0 |
| B | 0 | 2 | 0 |
| C | 0 | 2 | 0 |
| D | 0 | 2 | 0 |
| Quadrant | Total seconds | Saturated seconds | Saturation percentage |
|---|---|---|---|
| A | 7062 | 128 | 1.812518% |
| B | 7062 | 151 | 2.138204% |
| C | 7063 | 181 | 2.562650% |
| D | 7063 | 144 | 2.038794% |
Noise dominated data is calculated using 1-second bins in cleaned event files. If a bin has >2000 counts, and if more than 50% of those come from <1% of pixels, then it is considered to be noise-dominated and hence unusable.
| Quadrant | # 1 sec bins | Bins with >0 counts | Bins with >2000 counts | High rate bins dominated by noise | Noise dominated (total time) | Noise dominated (detector-on time) | Marked lightcurve |
|---|---|---|---|---|---|---|---|
| A | 7277 | 7063 | 0 | 0 | 0.00% | 0.00% | 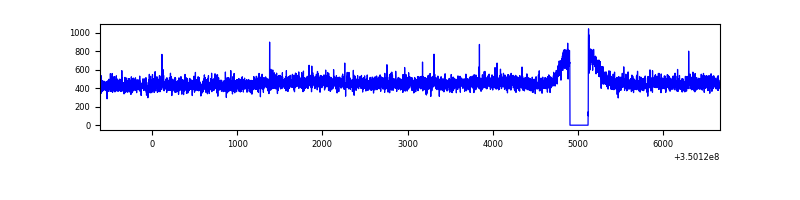 |
| B | 7277 | 7063 | 11 | 11 | 0.15% | 0.16% | 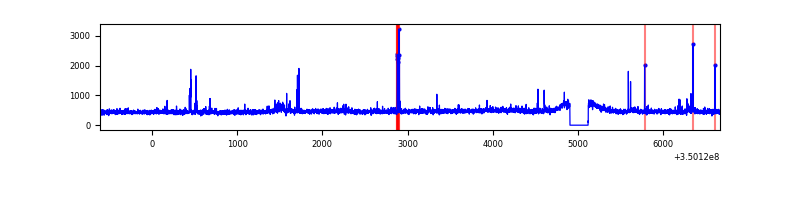 |
| C | 7278 | 7064 | 0 | 0 | 0.00% | 0.00% | 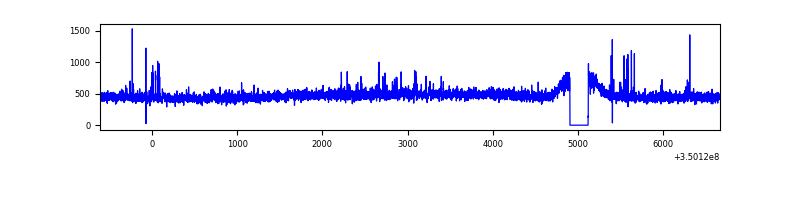 |
| D | 7278 | 7064 | 63 | 63 | 0.87% | 0.89% | 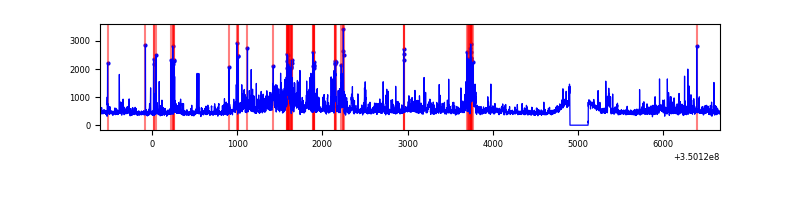 |
Top three noisy pixels from each quadrant. If the there are fewer than three noisy pixels in the level2.evt file, extra rows are filled as -1
| Pixel properties | Quadrant properties | ||||||
|---|---|---|---|---|---|---|---|
| Quadrant | DetID | PixID | Counts | Sigma | Mean | Median | Sigma |
| A | 13 | 254 | 12151 | 66.71 | 836 | 817 | 169.9 |
| A | 6 | 16 | 11494 | 62.84 | 836 | 817 | 169.9 |
| A | 3 | 137 | 8456 | 44.96 | 836 | 817 | 169.9 |
| B | 10 | 245 | 97491 | 600.97 | 831 | 808 | 160.9 |
| B | 12 | 111 | 20270 | 120.97 | 831 | 808 | 160.9 |
| B | 11 | 111 | 18613 | 110.67 | 831 | 808 | 160.9 |
| C | 14 | 238 | 149978 | 792.14 | 797 | 800 | 188.3 |
| C | 14 | 254 | 31862 | 164.94 | 797 | 800 | 188.3 |
| C | 3 | 233 | 28909 | 149.26 | 797 | 800 | 188.3 |
| D | 1 | 52 | 562329 | 2890.54 | 803 | 778 | 194.3 |
| D | 8 | 195 | 392802 | 2017.91 | 803 | 778 | 194.3 |
| D | 7 | 80 | 127123 | 650.35 | 803 | 778 | 194.3 |
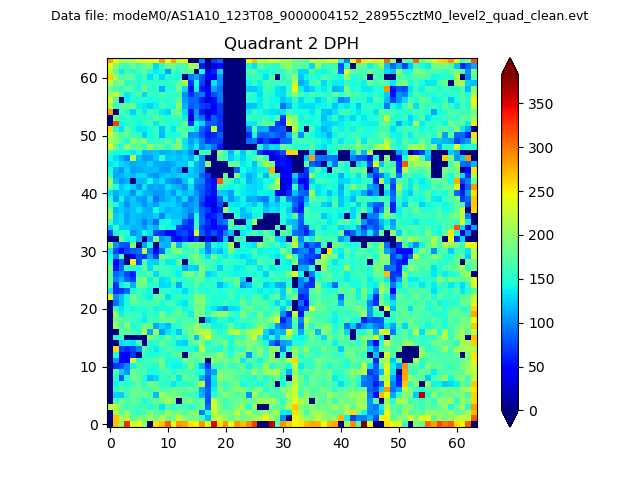
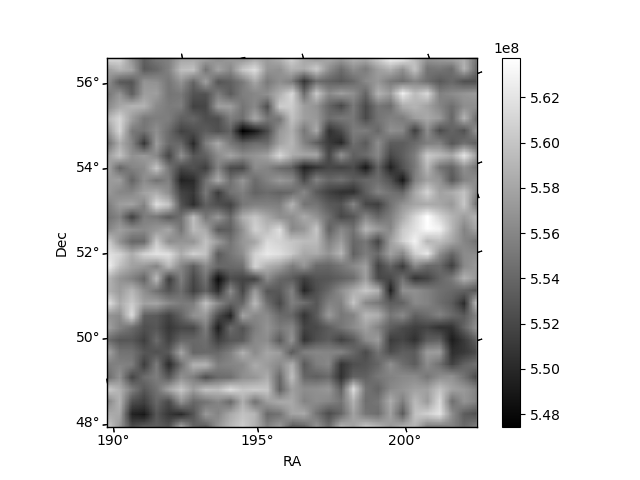
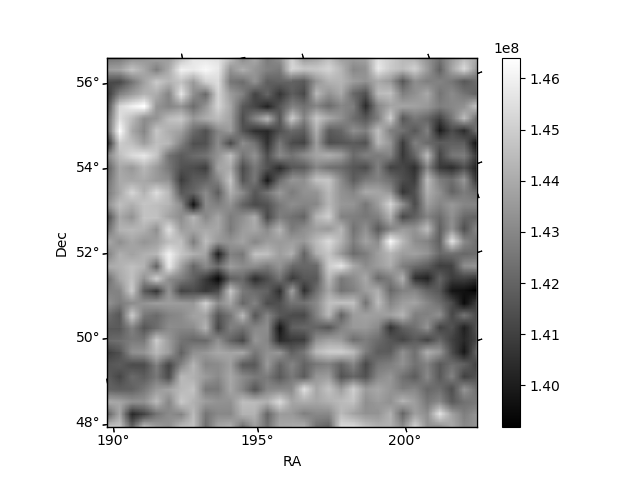
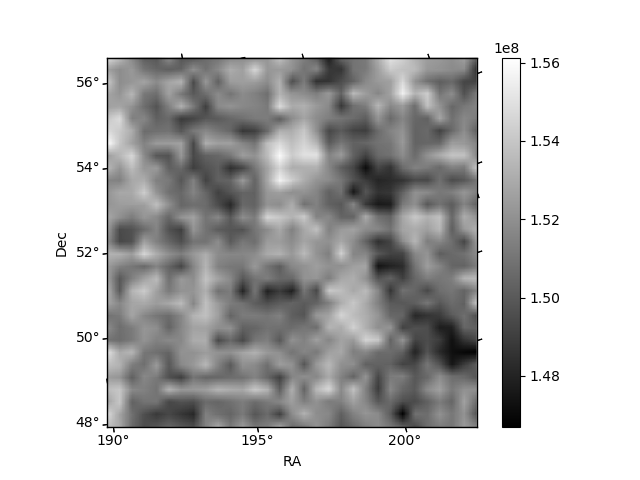
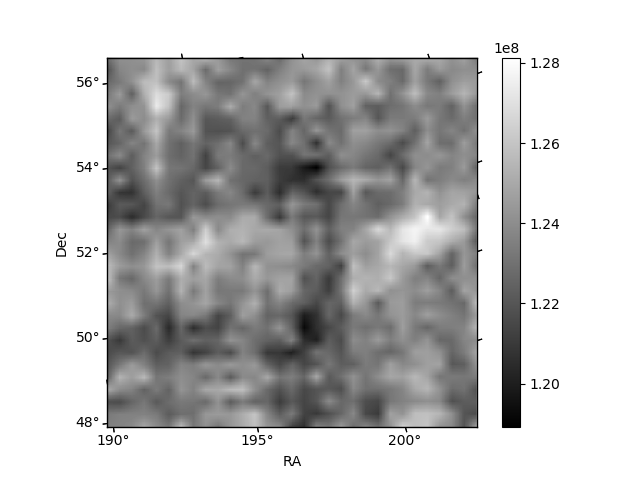
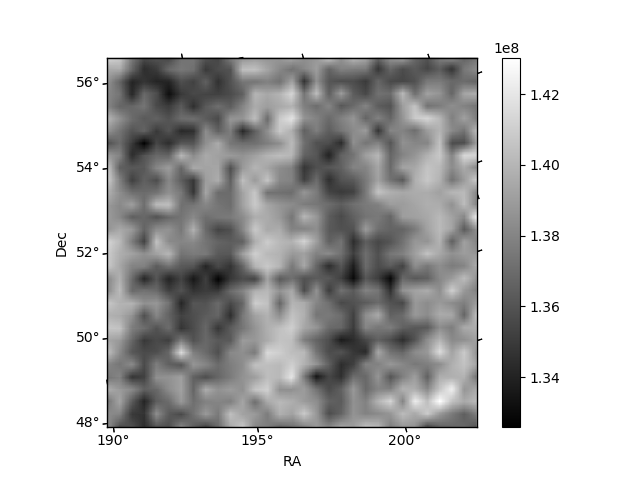
Histogram calculated using DETX and DETY for each event in the final _common_clean file
| Quadrant A | 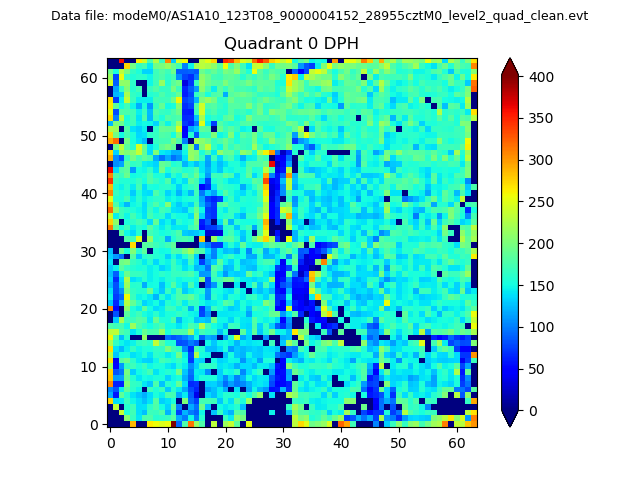 |
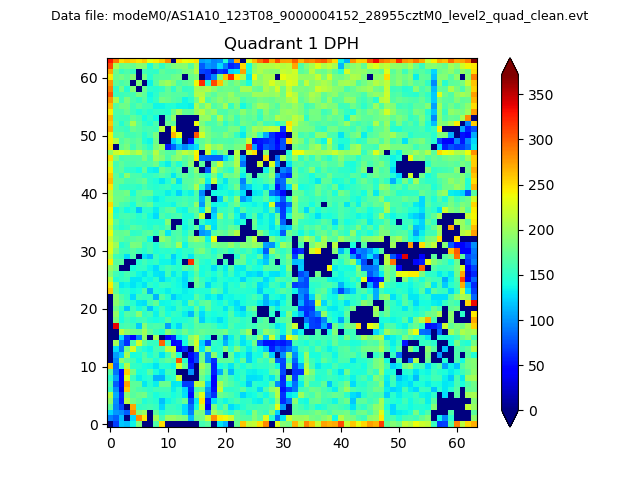 |
Quadrant B |
|---|---|---|---|
| Quadrant D | 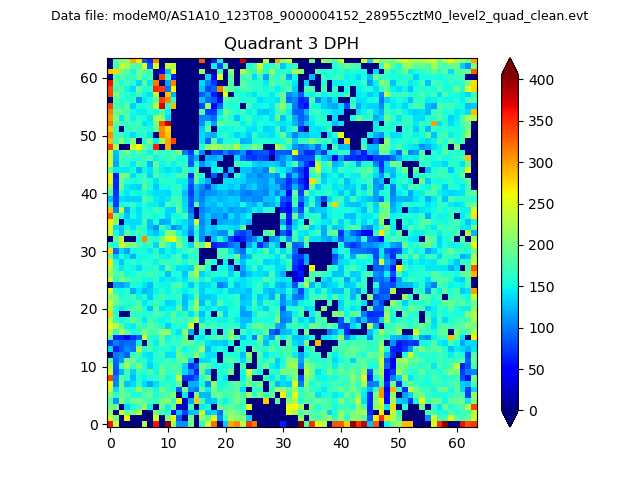 |
 |
Quadrant C |
| Plot type | Count rate plots | Images |
|---|---|---|
| Comparison with Poisson distribution Blue bars denote a histogram of data divided into 1 sec bins. Red curve is a Poisson curve with rate = median count rate of data. |
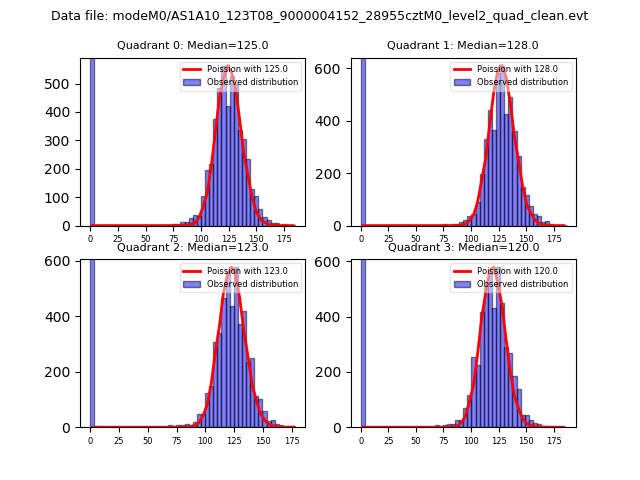 |
 |
| Quadrant-wise count rates Data is divided into 100 sec bins |
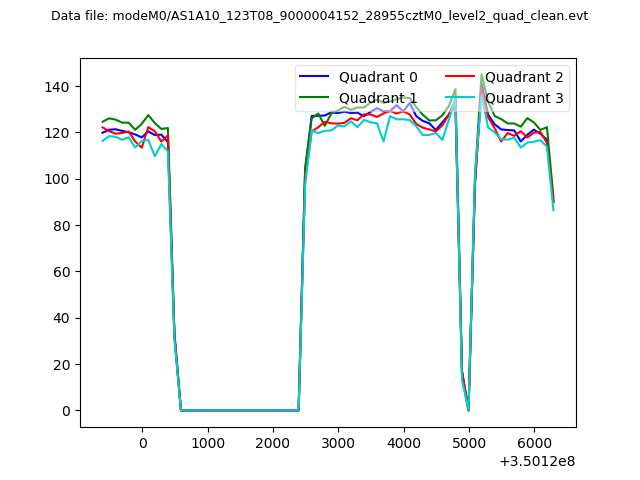 |
|
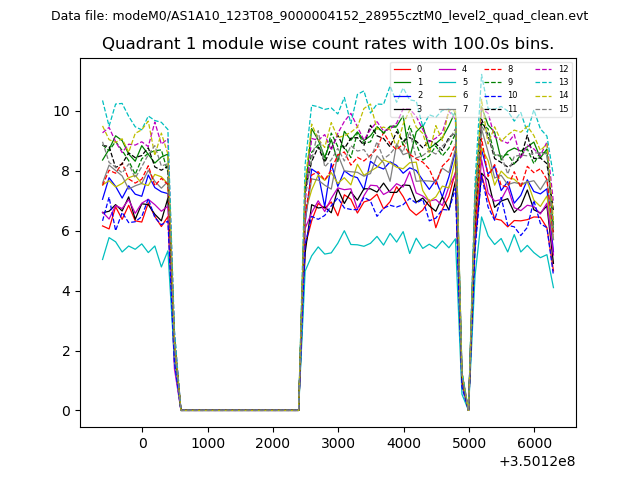
| Module-wise count rates for Quadrant A Data is divided into 100 sec bins |
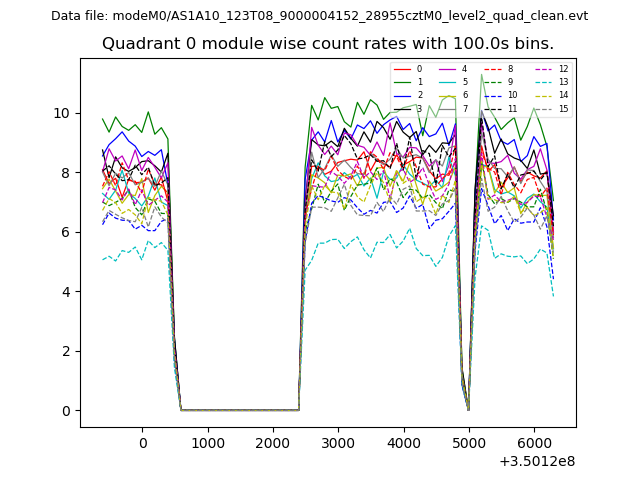 |
 |
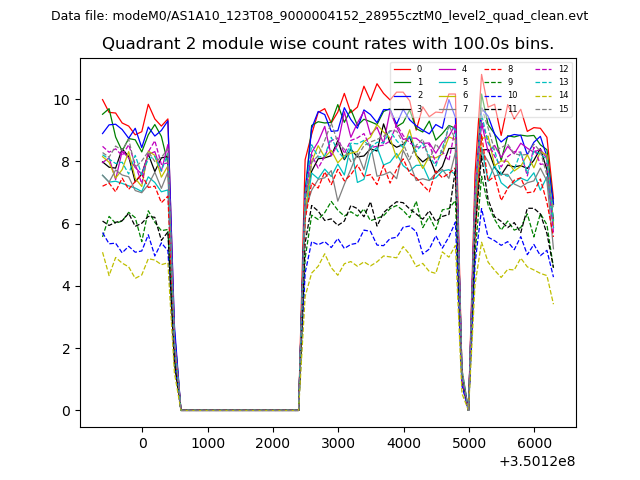
| Module-wise count rates for Quadrant B Data is divided into 100 sec bins |
 |
 |
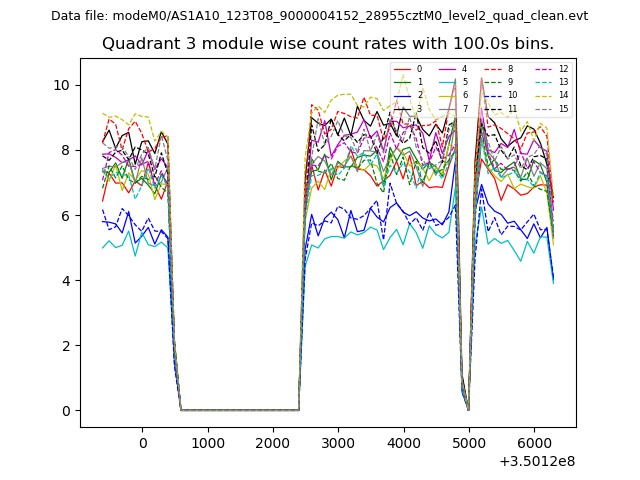
| Module-wise count rates for Quadrant C Data is divided into 100 sec bins |
 |
 |
| Module-wise count rates for Quadrant D Data is divided into 100 sec bins |
 |
 |
| Parameter | Plot |
|---|---|
| CZT HV Monitor | 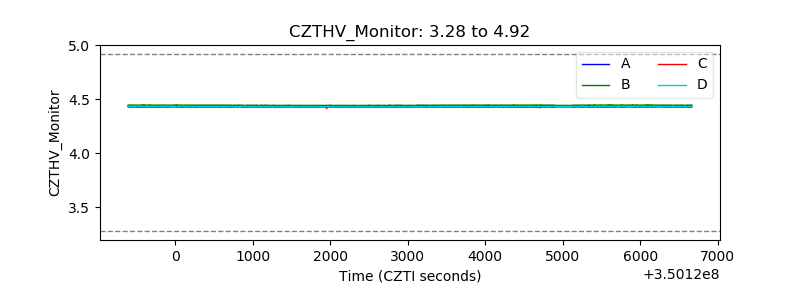 |
| D_VDD | 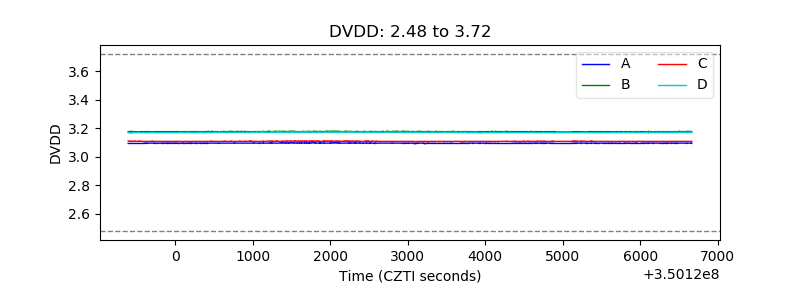 |
| Temperature 1 | 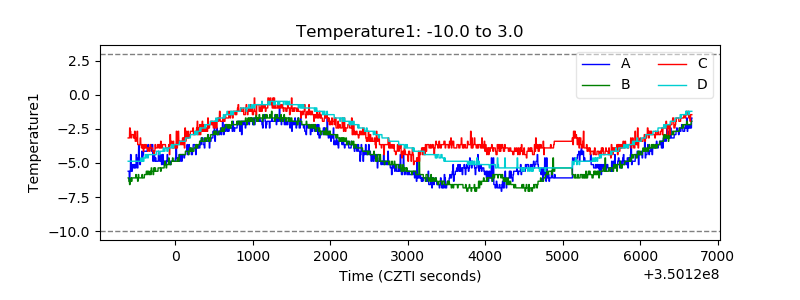 |
| Veto HV Monitor |  |
| Veto LLD | 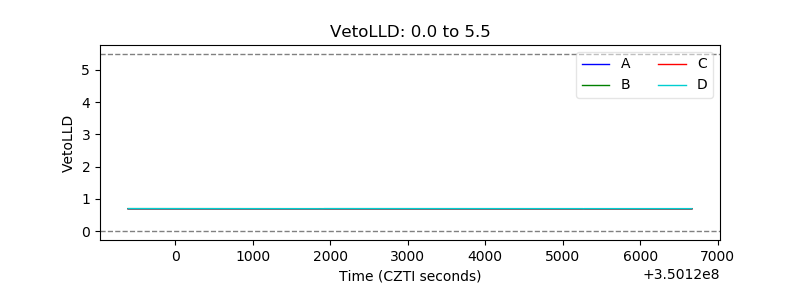 |
| Alpha Counter | 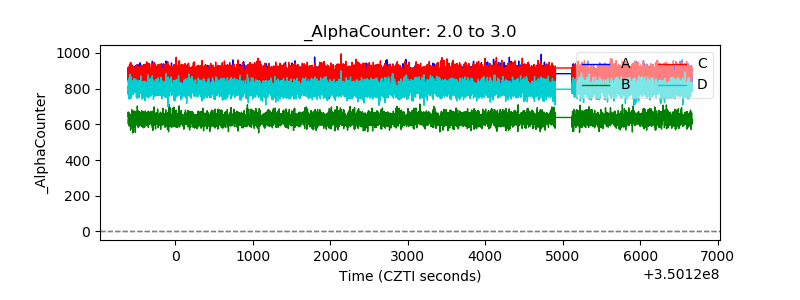 |
| _CPM_Rate | 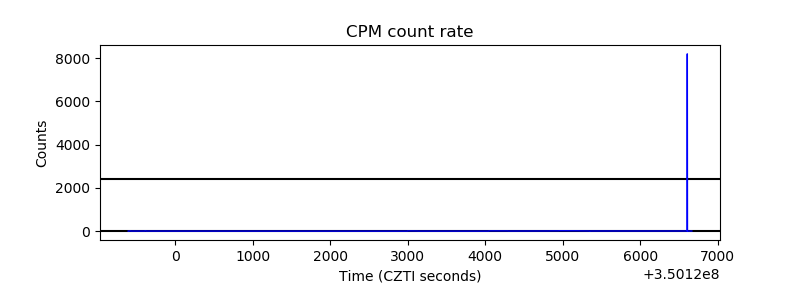 |
| CZT Counter | 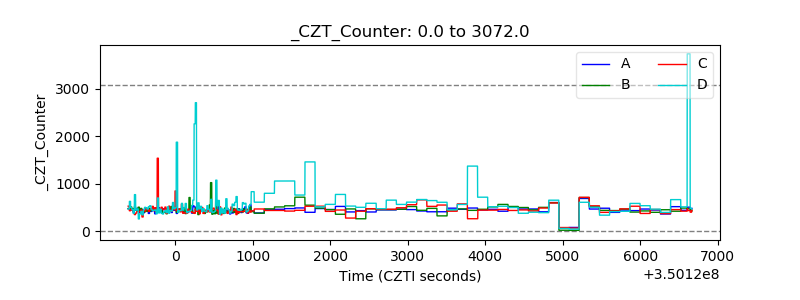 |
| +2.5 Volts monitor |  |
| +5 Volts monitor | 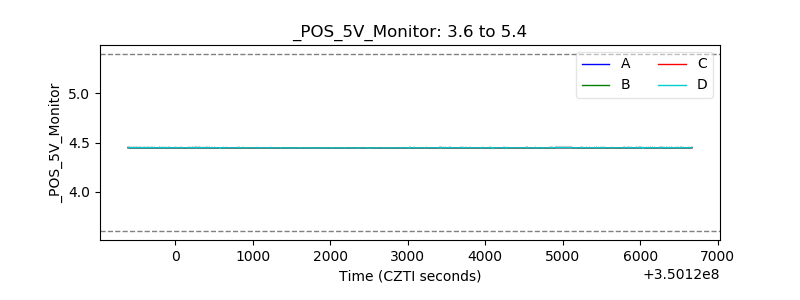 |
| _ROLL_ROT | 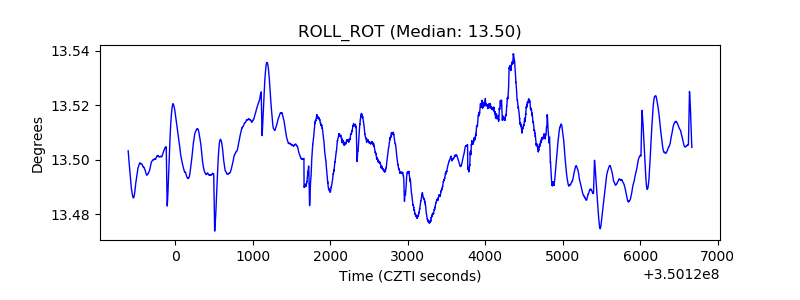 |
| _Roll_DEC | 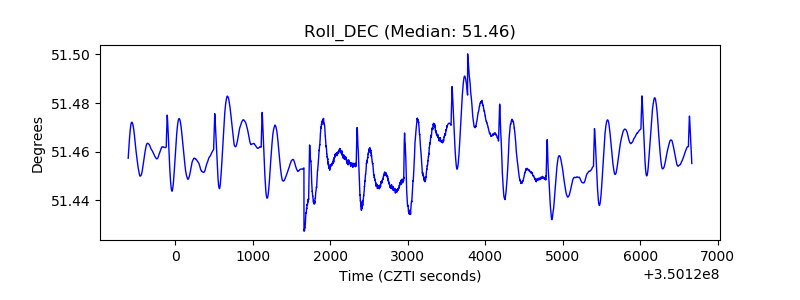 |
| _Roll_RA | 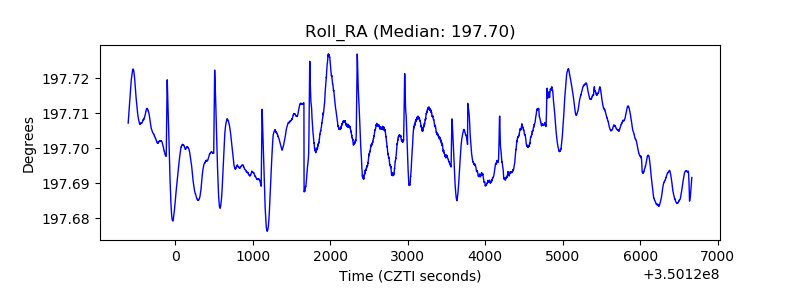 |
| Veto Counter | 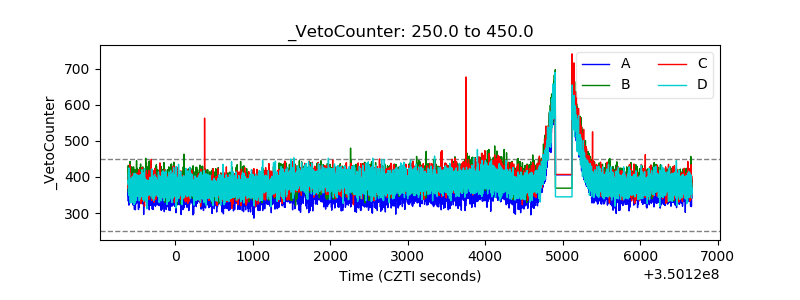 |