| Param | Original file | Final file |
|---|---|---|
| Filename | modeM0/AS1A10_123T08_9000004152_28962cztM0_level2.evt | modeM0/AS1A10_123T08_9000004152_28962cztM0_level2_quad_clean.evt |
| Size (bytes) | 613,581,120 | 80,769,600 |
| Size | 585.2 MB | 77.0 MB |
| Events in quadrant A | 3,004,392 | 516,432 |
| Events in quadrant B | 3,197,560 | 529,450 |
| Events in quadrant C | 3,182,623 | 503,655 |
| Events in quadrant D | 8,757,425 | 442,454 |
| Mode SS | |||
|---|---|---|---|
| Quadrant | BADHDUFLAG | Total packets | Discarded packets |
| A | 0 | 132 | 0 |
| B | 0 | 132 | 0 |
| C | 0 | 132 | 0 |
| D | 0 | 132 | 0 |
| Mode M0 | |||
|---|---|---|---|
| Quadrant | BADHDUFLAG | Total packets | Discarded packets |
| A | 0 | 13229 | 1 |
| B | 0 | 13728 | 1 |
| C | 0 | 13469 | 1 |
| D | 0 | 30578 | 1 |
| Mode M9 | |||
|---|---|---|---|
| Quadrant | BADHDUFLAG | Total packets | Discarded packets |
| A | 0 | 4 | 0 |
| B | 0 | 4 | 0 |
| C | 0 | 4 | 0 |
| D | 0 | 4 | 0 |
| Quadrant | Total seconds | Saturated seconds | Saturation percentage |
|---|---|---|---|
| A | 6498 | 105 | 1.615882% |
| B | 6499 | 174 | 2.677335% |
| C | 6499 | 182 | 2.800431% |
| D | 6499 | 1582 | 24.342206% |
Noise dominated data is calculated using 1-second bins in cleaned event files. If a bin has >2000 counts, and if more than 50% of those come from <1% of pixels, then it is considered to be noise-dominated and hence unusable.
| Quadrant | # 1 sec bins | Bins with >0 counts | Bins with >2000 counts | High rate bins dominated by noise | Noise dominated (total time) | Noise dominated (detector-on time) | Marked lightcurve |
|---|---|---|---|---|---|---|---|
| A | 6893 | 6496 | 0 | 0 | 0.00% | 0.00% | 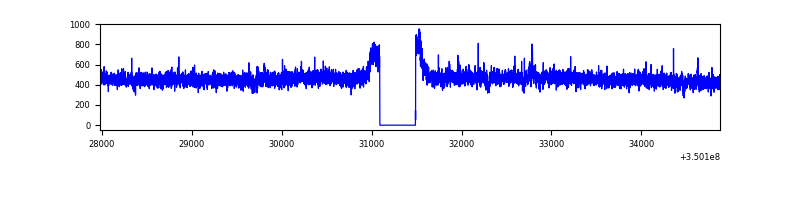 |
| B | 6894 | 6497 | 47 | 47 | 0.68% | 0.72% | 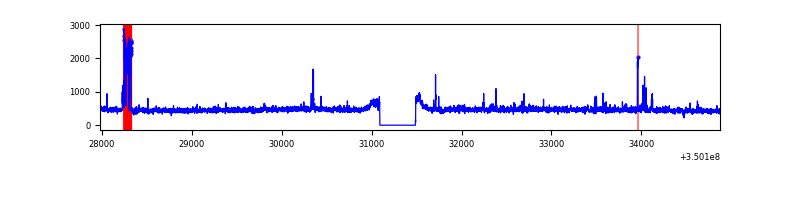 |
| C | 6894 | 6497 | 2 | 2 | 0.03% | 0.03% |  |
| D | 6894 | 6497 | 1469 | 1469 | 21.31% | 22.61% | 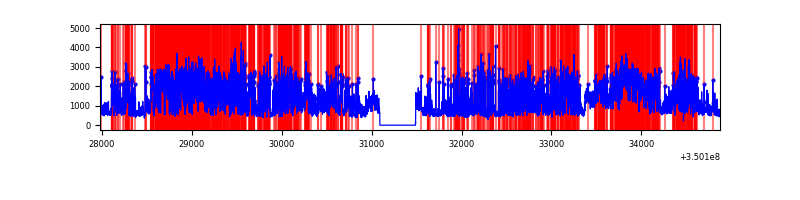 |
Top three noisy pixels from each quadrant. If the there are fewer than three noisy pixels in the level2.evt file, extra rows are filled as -1
| Pixel properties | Quadrant properties | ||||||
|---|---|---|---|---|---|---|---|
| Quadrant | DetID | PixID | Counts | Sigma | Mean | Median | Sigma |
| A | 13 | 254 | 12685 | 76.28 | 770 | 752 | 156.4 |
| A | 6 | 16 | 10247 | 60.7 | 770 | 752 | 156.4 |
| A | 13 | 6 | 8594 | 50.13 | 770 | 752 | 156.4 |
| B | 5 | 255 | 134108 | 903.13 | 764 | 743 | 147.7 |
| B | 15 | 35 | 28765 | 189.76 | 764 | 743 | 147.7 |
| B | 12 | 111 | 18397 | 119.55 | 764 | 743 | 147.7 |
| C | 14 | 238 | 144987 | 829.94 | 740 | 744 | 173.8 |
| C | 3 | 233 | 73981 | 421.39 | 740 | 744 | 173.8 |
| C | 14 | 254 | 40147 | 226.72 | 740 | 744 | 173.8 |
| D | 7 | 80 | 3626592 | 21985.21 | 685 | 666 | 164.9 |
| D | 1 | 52 | 1064883 | 6452.71 | 685 | 666 | 164.9 |
| D | 8 | 195 | 910553 | 5516.95 | 685 | 666 | 164.9 |
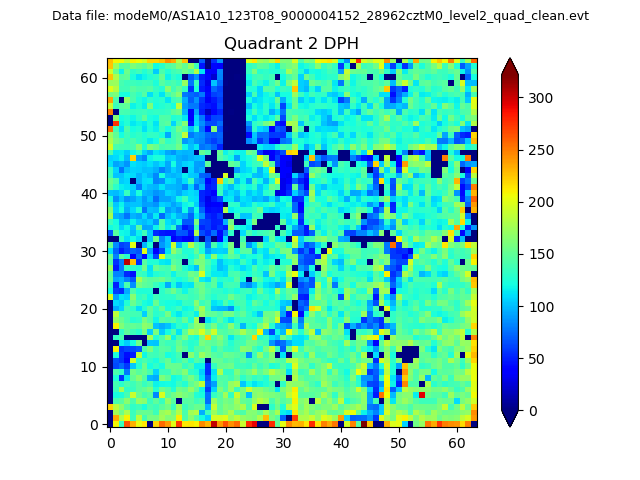
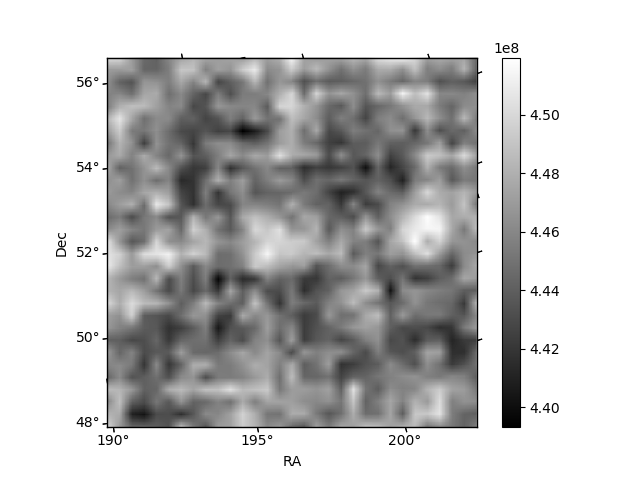
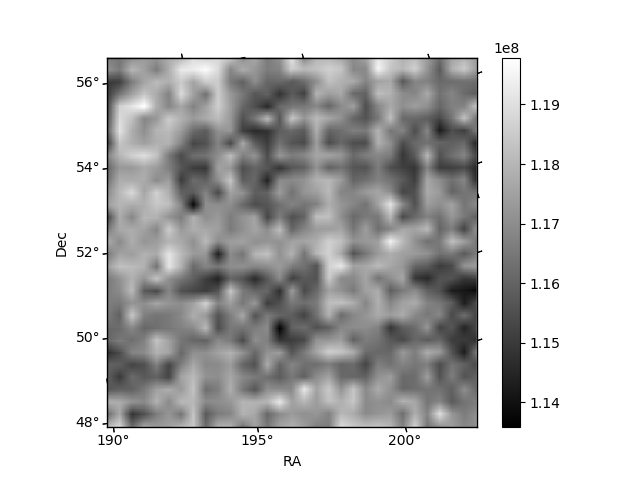
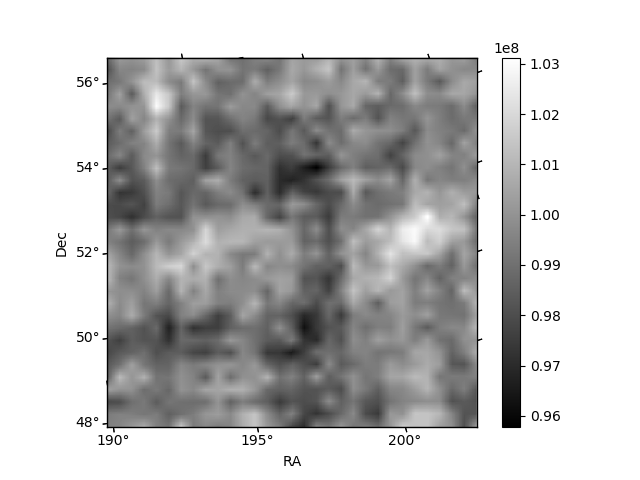
Histogram calculated using DETX and DETY for each event in the final _common_clean file
| Quadrant A |  |
 |
Quadrant B |
|---|---|---|---|
| Quadrant D |  |
 |
Quadrant C |
| Plot type | Count rate plots | Images |
|---|---|---|
| Comparison with Poisson distribution Blue bars denote a histogram of data divided into 1 sec bins. Red curve is a Poisson curve with rate = median count rate of data. |
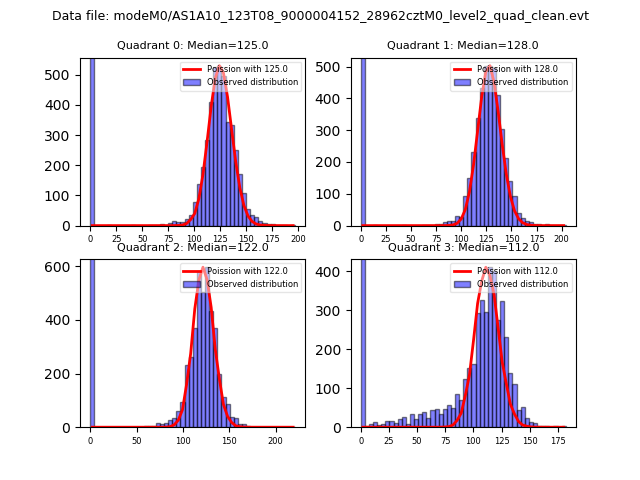 |
 |
| Quadrant-wise count rates Data is divided into 100 sec bins |
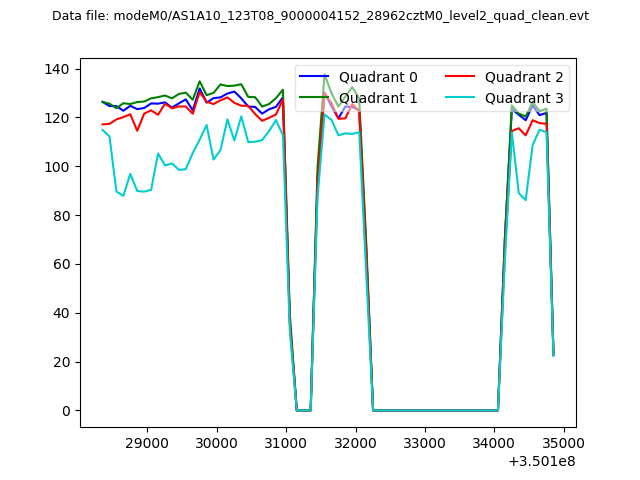 |
|
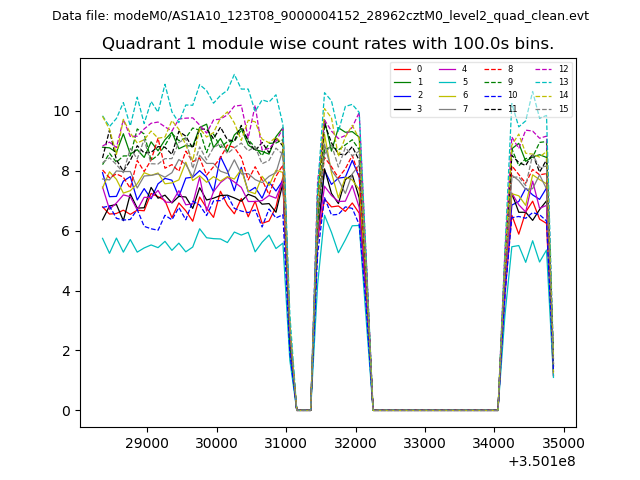
| Module-wise count rates for Quadrant A Data is divided into 100 sec bins |
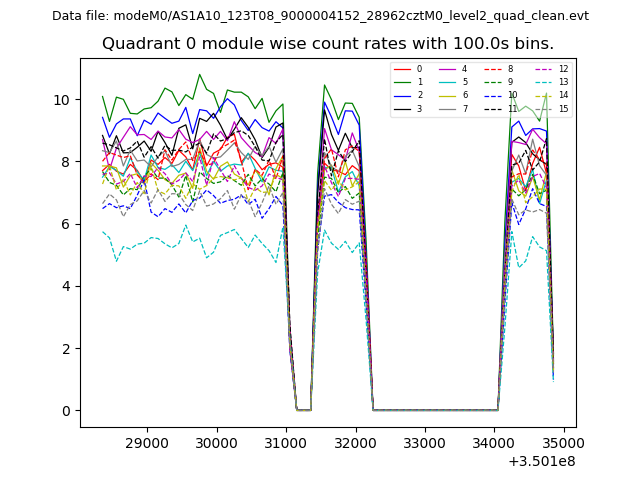 |
 |
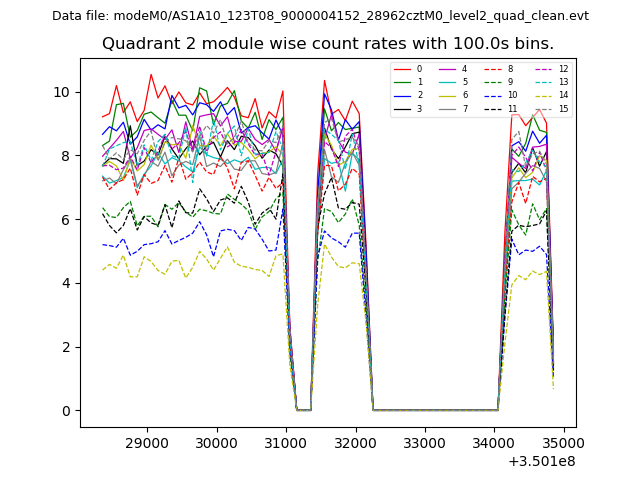
| Module-wise count rates for Quadrant B Data is divided into 100 sec bins |
 |
 |
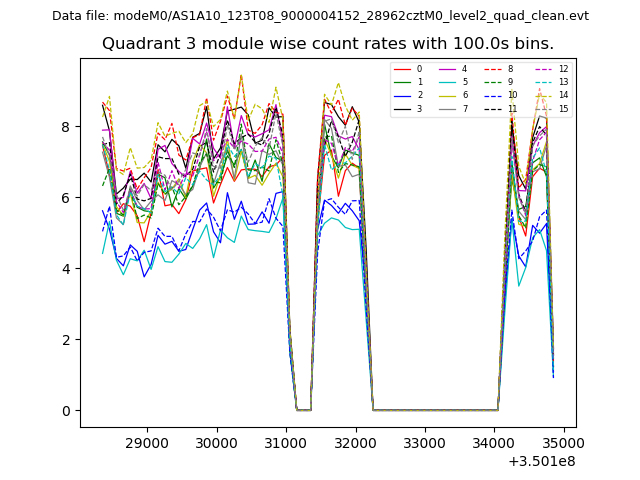
| Module-wise count rates for Quadrant C Data is divided into 100 sec bins |
 |
 |
| Module-wise count rates for Quadrant D Data is divided into 100 sec bins |
 |
 |
| Parameter | Plot |
|---|---|
| CZT HV Monitor | 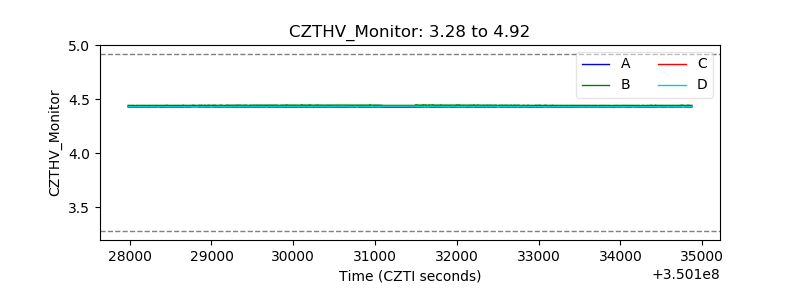 |
| D_VDD | 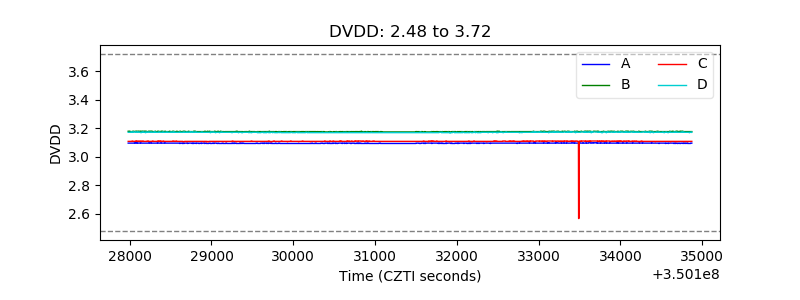 |
| Temperature 1 | 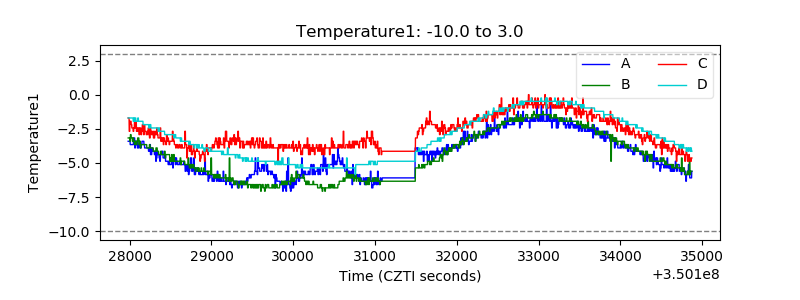 |
| Veto HV Monitor | 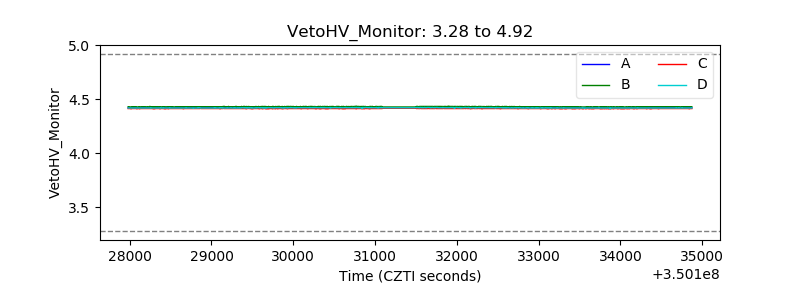 |
| Veto LLD | 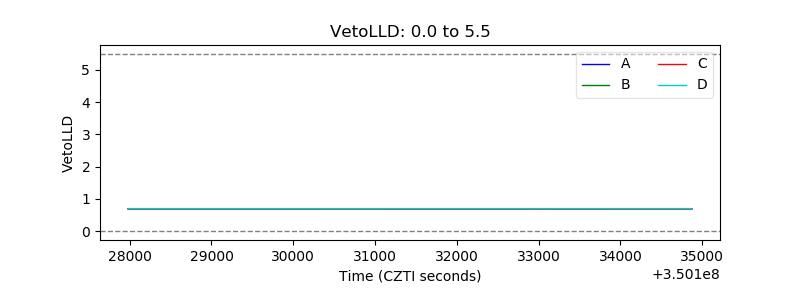 |
| Alpha Counter | 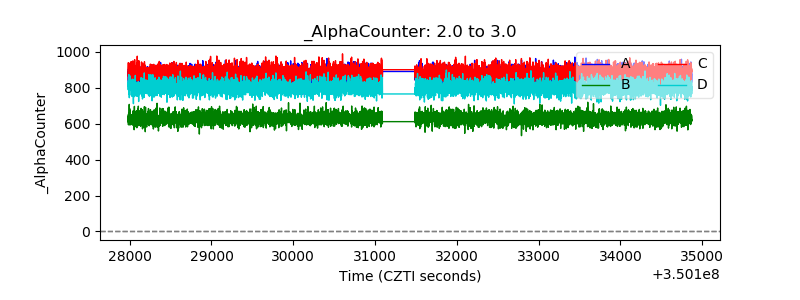 |
| _CPM_Rate | 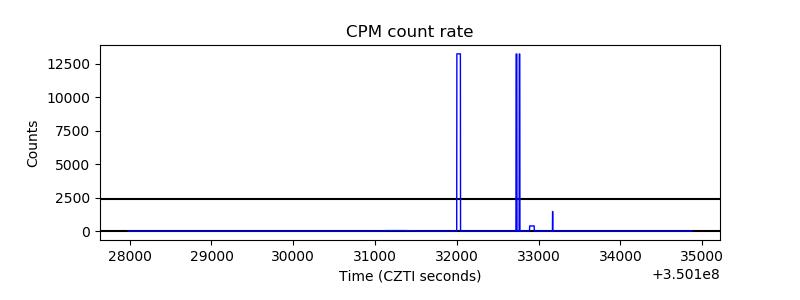 |
| CZT Counter | 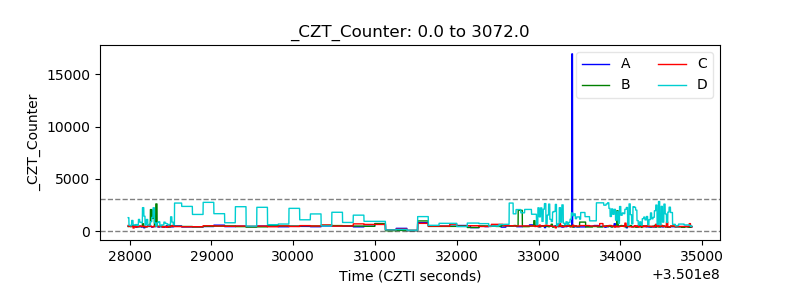 |
| +2.5 Volts monitor |  |
| +5 Volts monitor |  |
| _ROLL_ROT | 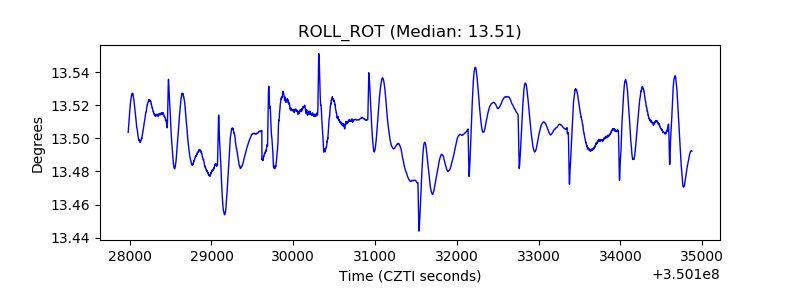 |
| _Roll_DEC | 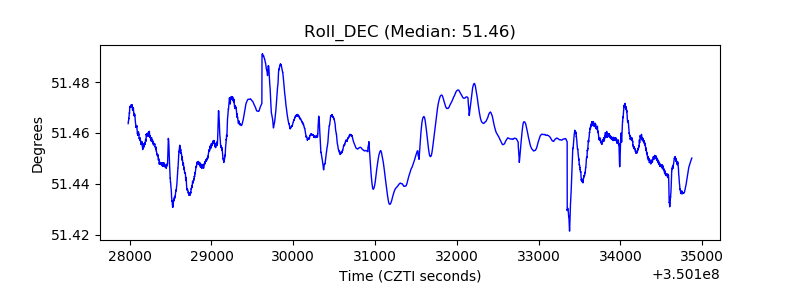 |
| _Roll_RA | 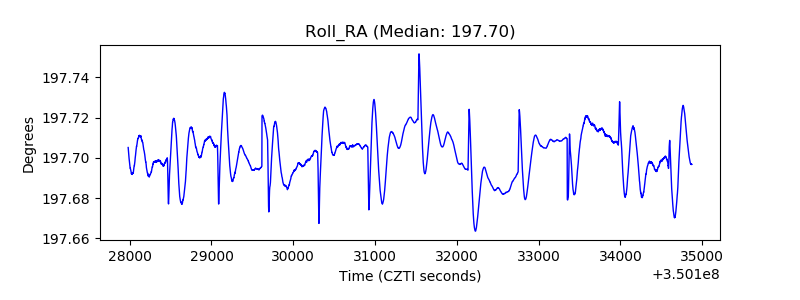 |
| Veto Counter | 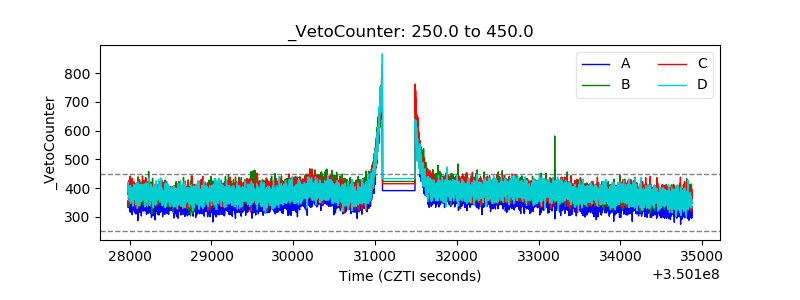 |