| Param | Original file | Final file |
|---|---|---|
| Filename | modeM0/AS1A10_048T03_9000004154cztM0_level2.fits | modeM0/AS1A10_048T03_9000004154cztM0_level2_quad_clean.evt |
| Size (bytes) | 1,275,050,880 | 1,123,056,000 |
| Size | 1.2 GB | 1.0 GB |
| Events in quadrant A | 7,937,932 | 6,634,930 |
| Events in quadrant B | 7,655,066 | 6,713,135 |
| Events in quadrant C | 7,760,770 | 6,370,871 |
| Events in quadrant D | 6,422,852 | 5,459,120 |
| Mode M9 | |||
|---|---|---|---|
| Quadrant | BADHDUFLAG | Total packets | Discarded packets |
| A | 0 | 226 | 0 |
| B | 0 | 226 | 0 |
| C | 0 | 226 | 0 |
| D | 0 | 226 | 0 |
| Mode M0 | |||
|---|---|---|---|
| Quadrant | BADHDUFLAG | Total packets | Discarded packets |
| A | 0 | 275906 | 0 |
| B | 0 | 284977 | 0 |
| C | 0 | 272797 | 0 |
| D | 0 | 452770 | 0 |
| Mode SS | |||
|---|---|---|---|
| Quadrant | BADHDUFLAG | Total packets | Discarded packets |
| A | 0 | 2622 | 0 |
| B | 0 | 2622 | 0 |
| C | 0 | 2622 | 0 |
| D | 0 | 2622 | 0 |
| Quadrant | Total seconds | Saturated seconds | Saturation percentage |
|---|---|---|---|
| A | 128918 | 1852 | 1.436572% |
| B | 128918 | 2787 | 2.161839% |
| C | 128918 | 2493 | 1.933787% |
| D | 128918 | 13476 | 10.453156% |
Noise dominated data is calculated using 1-second bins in cleaned event files. If a bin has >2000 counts, and if more than 50% of those come from <1% of pixels, then it is considered to be noise-dominated and hence unusable.
| Quadrant | # 1 sec bins | Bins with >0 counts | Bins with >2000 counts | High rate bins dominated by noise | Noise dominated (total time) | Noise dominated (detector-on time) | Marked lightcurve |
|---|---|---|---|---|---|---|---|
| A | 151304 | 128914 | 0 | 0 | 0.00% | 0.00% |  |
| B | 151304 | 128909 | 0 | 0 | 0.00% | 0.00% |  |
| C | 151304 | 128910 | 0 | 0 | 0.00% | 0.00% |  |
| D | 151304 | 128718 | 0 | 0 | 0.00% | 0.00% |  |
Top three noisy pixels from each quadrant. If the there are fewer than three noisy pixels in the level2.evt file, extra rows are filled as -1
| Pixel properties | Quadrant properties | ||||||
|---|---|---|---|---|---|---|---|
| Quadrant | DetID | PixID | Counts | Sigma | Mean | Median | Sigma |
| A | 0 | 29 | 7555 | 11.15 | 2071 | 1945 | 503.2 |
| A | 7 | 110 | 6445 | 8.94 | 2071 | 1945 | 503.2 |
| A | 0 | 30 | 6031 | 8.12 | 2071 | 1945 | 503.2 |
| B | 2 | 9 | 6148 | 10.72 | 2023 | 1928 | 393.8 |
| B | 2 | 8 | 5102 | 8.06 | 2023 | 1928 | 393.8 |
| B | 5 | 225 | 5030 | 7.88 | 2023 | 1928 | 393.8 |
| C | 12 | 241 | 5433 | 6.73 | 2052 | 1918 | 522.2 |
| C | 3 | 126 | 5173 | 6.23 | 2052 | 1918 | 522.2 |
| C | 9 | 209 | 5137 | 6.16 | 2052 | 1918 | 522.2 |
| D | 15 | 46 | 4777 | 6.4 | 1831 | 1667 | 485.8 |
| D | 3 | 14 | 4490 | 5.81 | 1831 | 1667 | 485.8 |
| D | 7 | 3 | 4483 | 5.8 | 1831 | 1667 | 485.8 |
Histogram calculated using DETX and DETY for each event in the final _common_clean file
| Quadrant A |  |
 |
Quadrant B |
|---|---|---|---|
| Quadrant D |  |
 |
Quadrant C |
| Plot type | Count rate plots | Images |
|---|---|---|
| Comparison with Poisson distribution Blue bars denote a histogram of data divided into 1 sec bins. Red curve is a Poisson curve with rate = median count rate of data. |
 |
 |
| Quadrant-wise count rates Data is divided into 100 sec bins |
 |
|
| Module-wise count rates for Quadrant A Data is divided into 100 sec bins |
 |
 |
| Module-wise count rates for Quadrant B Data is divided into 100 sec bins |
 |
 |
| Module-wise count rates for Quadrant C Data is divided into 100 sec bins |
 |
 |
| Module-wise count rates for Quadrant D Data is divided into 100 sec bins |
 |
 |
| Parameter | Plot |
|---|---|
| CZT HV Monitor |  |
| D_VDD | 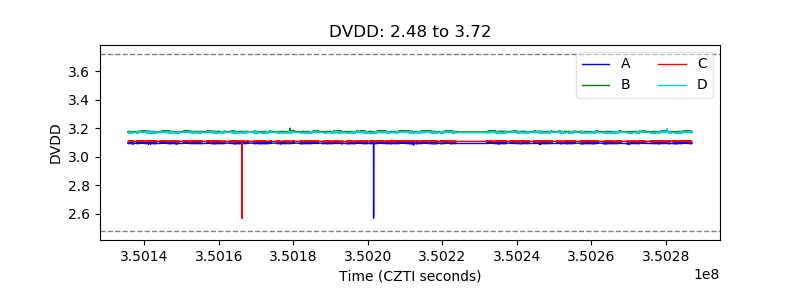 |
| Temperature 1 |  |
| Veto HV Monitor |  |
| Veto LLD |  |
| Alpha Counter |  |
| _CPM_Rate |  |
| CZT Counter |  |
| +2.5 Volts monitor |  |
| +5 Volts monitor |  |
| _ROLL_ROT |  |
| _Roll_DEC |  |
| _Roll_RA |  |
| Veto Counter |  |